| Param | Original file | Final file |
|---|---|---|
| Filename | modeM0/AS1A10_048T04_9000004984_34740cztM0_level2.evt | modeM0/AS1A10_048T04_9000004984_34740cztM0_level2_quad_clean.evt |
| Size (bytes) | 508,668,480 | 63,397,440 |
| Size | 485.1 MB | 60.5 MB |
| Events in quadrant A | 2,942,507 | 425,474 |
| Events in quadrant B | 3,802,248 | 427,898 |
| Events in quadrant C | 2,843,810 | 432,950 |
| Events in quadrant D | 5,476,982 | 281,537 |
| Mode SS | |||
|---|---|---|---|
| Quadrant | BADHDUFLAG | Total packets | Discarded packets |
| A | 0 | 104 | 0 |
| B | 0 | 104 | 0 |
| C | 0 | 104 | 0 |
| D | 0 | 104 | 0 |
| Mode M0 | |||
|---|---|---|---|
| Quadrant | BADHDUFLAG | Total packets | Discarded packets |
| A | 0 | 11918 | 3 |
| B | 0 | 14566 | 2 |
| C | 0 | 11192 | 2 |
| D | 0 | 19795 | 2 |
| Mode M9 | |||
|---|---|---|---|
| Quadrant | BADHDUFLAG | Total packets | Discarded packets |
| A | 0 | 28 | 0 |
| B | 0 | 28 | 0 |
| C | 0 | 28 | 0 |
| D | 0 | 29 | 0 |
| Quadrant | Total seconds | Saturated seconds | Saturation percentage |
|---|---|---|---|
| A | 5003 | 8 | 0.159904% |
| B | 5003 | 248 | 4.957026% |
| C | 5003 | 23 | 0.459724% |
| D | 5003 | 1040 | 20.787527% |
Noise dominated data is calculated using 1-second bins in cleaned event files. If a bin has >2000 counts, and if more than 50% of those come from <1% of pixels, then it is considered to be noise-dominated and hence unusable.
| Quadrant | # 1 sec bins | Bins with >0 counts | Bins with >2000 counts | High rate bins dominated by noise | Noise dominated (total time) | Noise dominated (detector-on time) | Marked lightcurve |
|---|---|---|---|---|---|---|---|
| A | 7036 | 5005 | 2 | 2 | 0.03% | 0.04% | 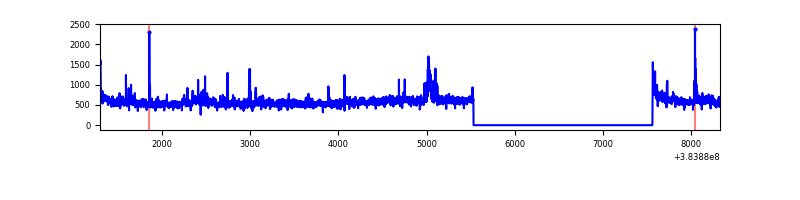 |
| B | 7036 | 5005 | 170 | 170 | 2.42% | 3.40% | 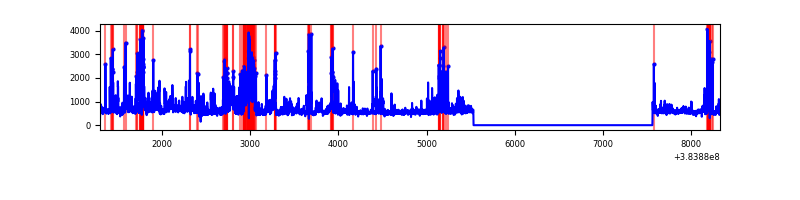 |
| C | 7036 | 5005 | 15 | 15 | 0.21% | 0.30% | 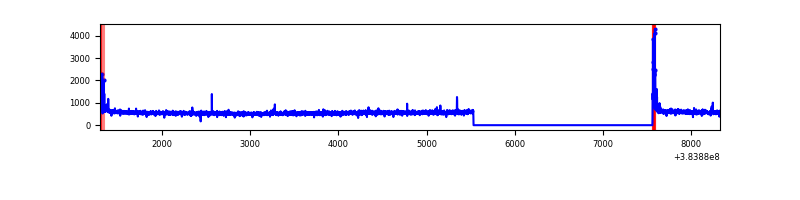 |
| D | 7036 | 5005 | 717 | 717 | 10.19% | 14.33% | 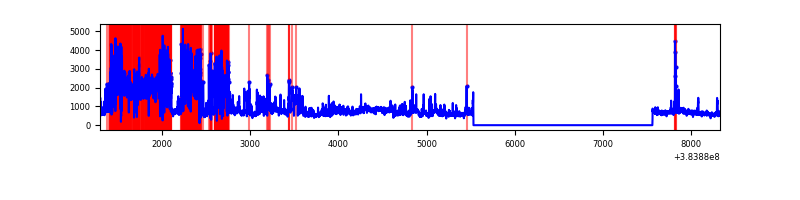 |
Top three noisy pixels from each quadrant. If the there are fewer than three noisy pixels in the level2.evt file, extra rows are filled as -1
| Pixel properties | Quadrant properties | ||||||
|---|---|---|---|---|---|---|---|
| Quadrant | DetID | PixID | Counts | Sigma | Mean | Median | Sigma |
| A | 15 | 169 | 241174 | 1843.74 | 654 | 642 | 130.5 |
| A | 15 | 223 | 91801 | 698.76 | 654 | 642 | 130.5 |
| A | 10 | 83 | 47506 | 359.22 | 654 | 642 | 130.5 |
| B | 4 | 171 | 539996 | 4486.96 | 637 | 622 | 120.2 |
| B | 5 | 172 | 435695 | 3619.3 | 637 | 622 | 120.2 |
| B | 0 | 190 | 148995 | 1234.29 | 637 | 622 | 120.2 |
| C | 15 | 214 | 214439 | 1451.83 | 642 | 649 | 147.3 |
| C | 0 | 10 | 87169 | 587.55 | 642 | 649 | 147.3 |
| C | 0 | 207 | 20218 | 132.89 | 642 | 649 | 147.3 |
| D | 10 | 118 | 2371344 | 18041.21 | 544 | 532 | 131.4 |
| D | 8 | 195 | 784260 | 5963.95 | 544 | 532 | 131.4 |
| D | 2 | 249 | 65306 | 492.91 | 544 | 532 | 131.4 |
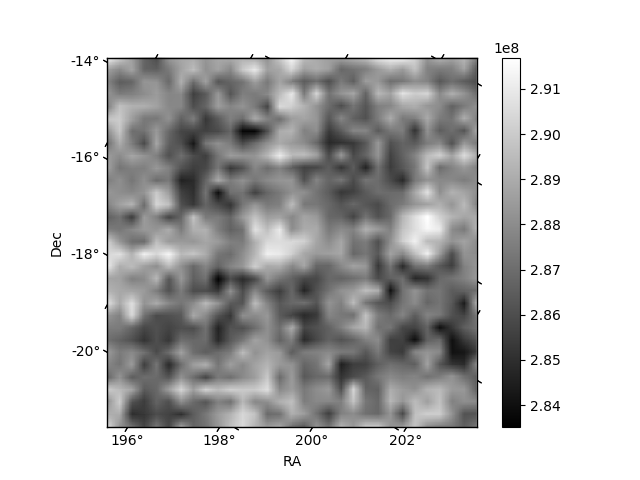
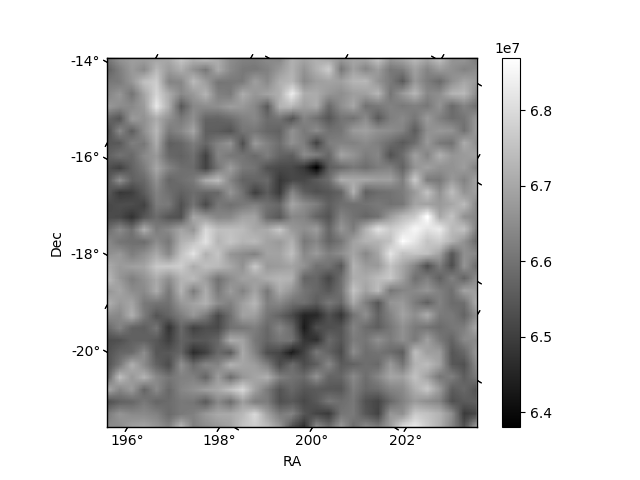
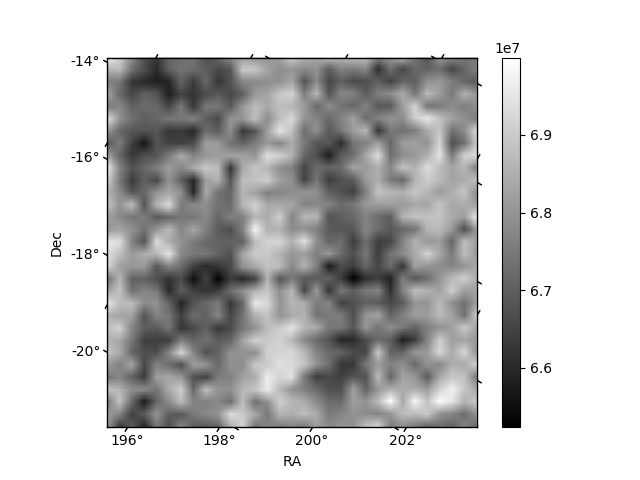
Histogram calculated using DETX and DETY for each event in the final _common_clean file
| Quadrant A | 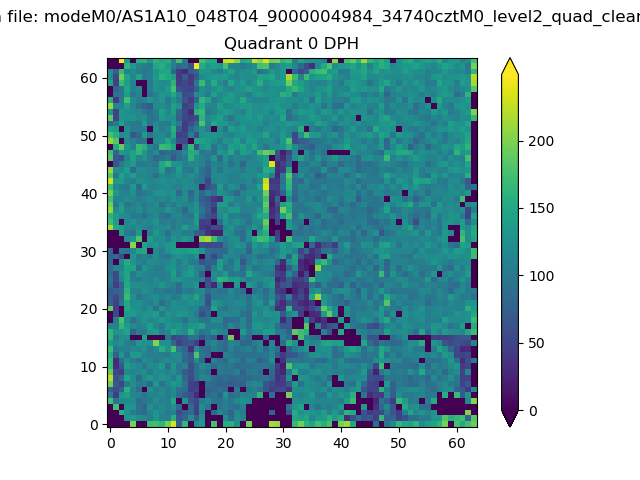 |
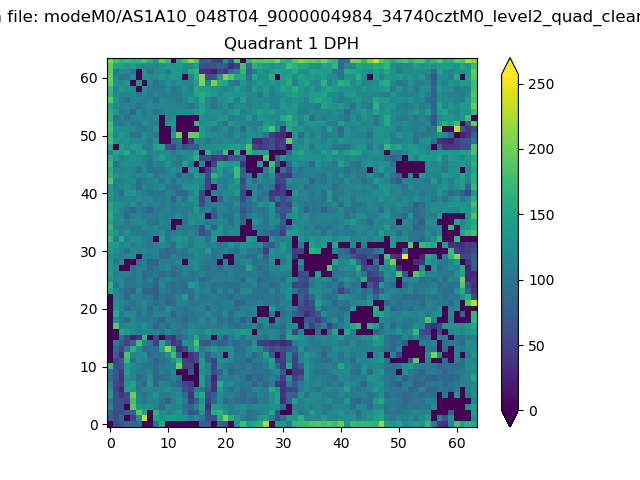 |
Quadrant B |
|---|---|---|---|
| Quadrant D | 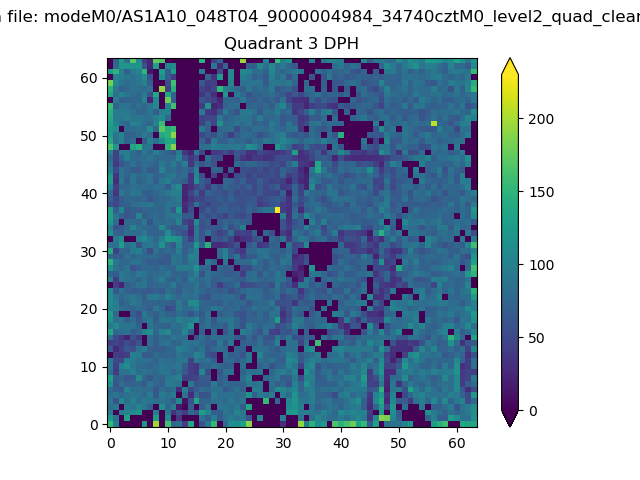 |
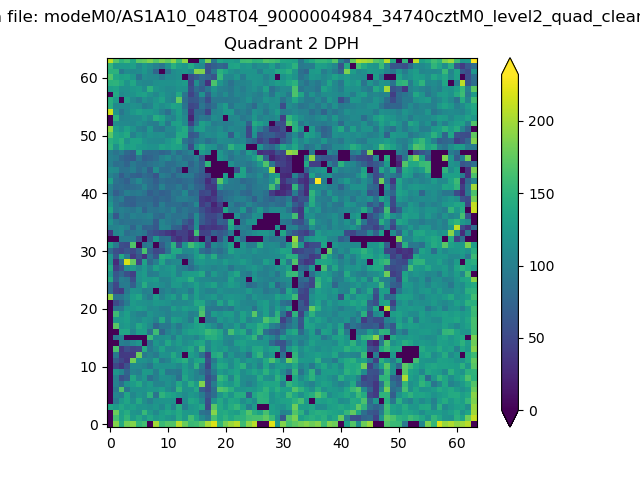 |
Quadrant C |
| Plot type | Count rate plots | Images |
|---|---|---|
| Comparison with Poisson distribution Blue bars denote a histogram of data divided into 1 sec bins. Red curve is a Poisson curve with rate = median count rate of data. |
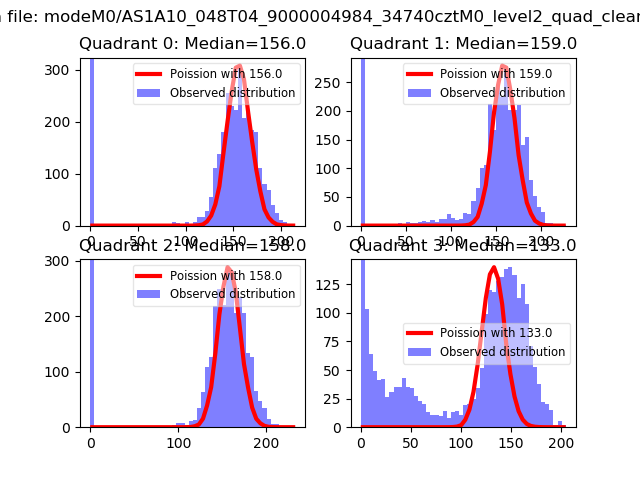 |
 |
| Quadrant-wise count rates Data is divided into 100 sec bins |
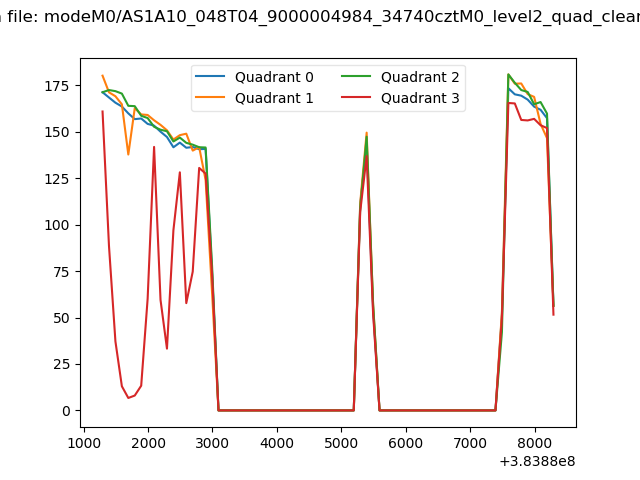 |
|
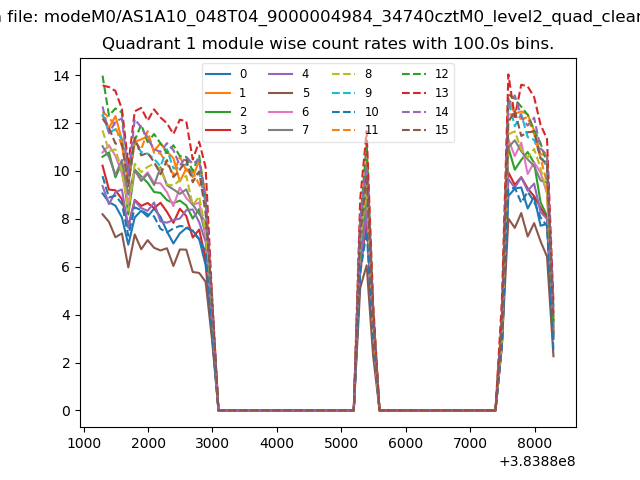
| Module-wise count rates for Quadrant A Data is divided into 100 sec bins |
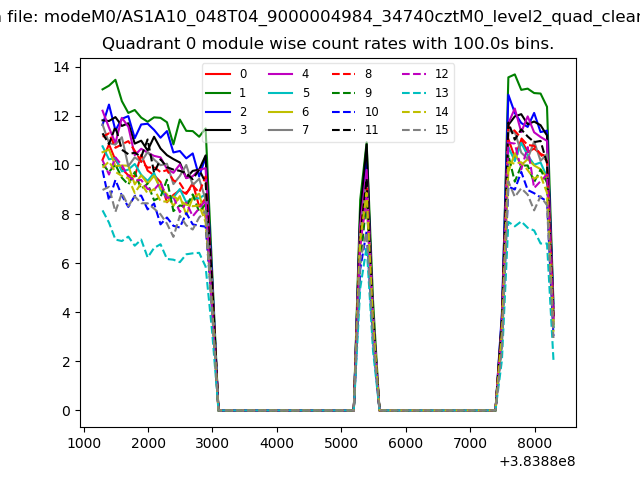 |
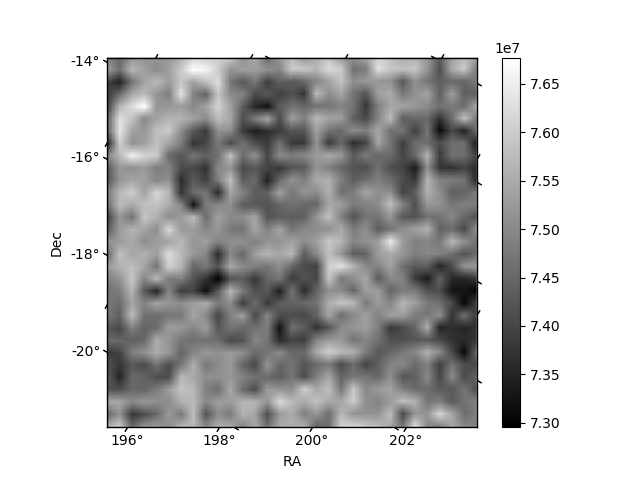 |
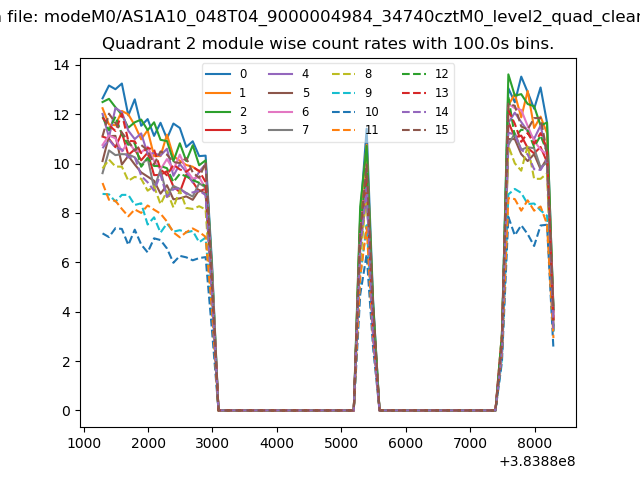
| Module-wise count rates for Quadrant B Data is divided into 100 sec bins |
 |
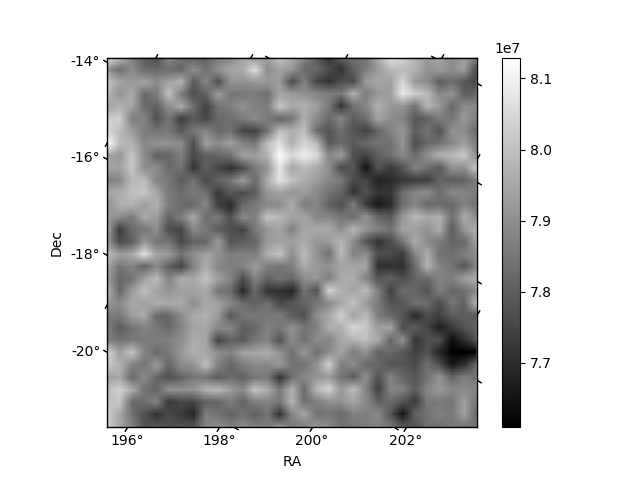 |
| Module-wise count rates for Quadrant C Data is divided into 100 sec bins |
 |
 |
| Module-wise count rates for Quadrant D Data is divided into 100 sec bins |
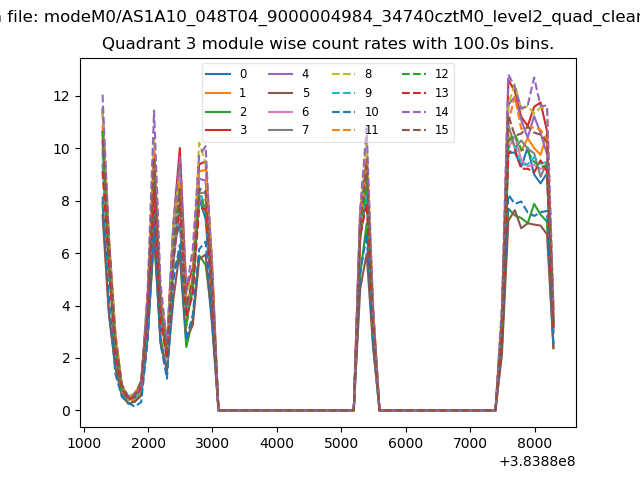 |
 |
| Parameter | Plot |
|---|---|
| CZT HV Monitor |  |
| D_VDD | 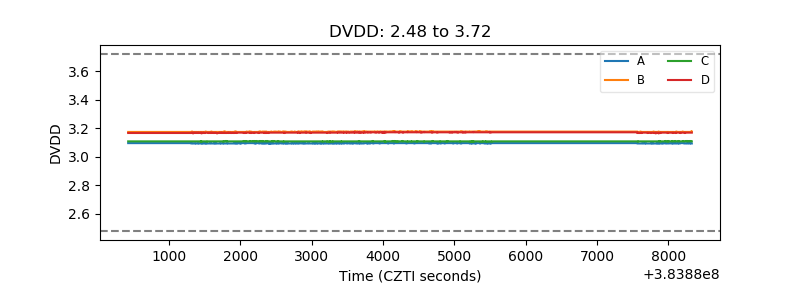 |
| Temperature 1 | 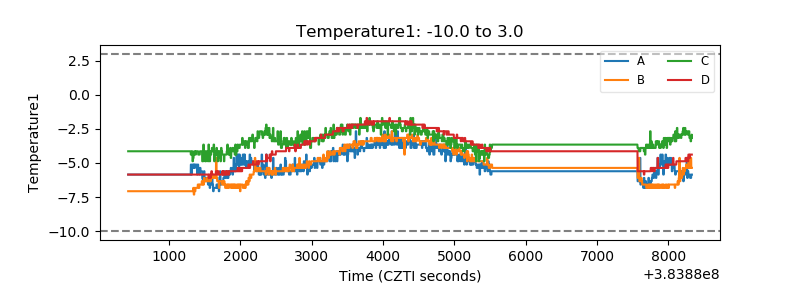 |
| Veto HV Monitor | 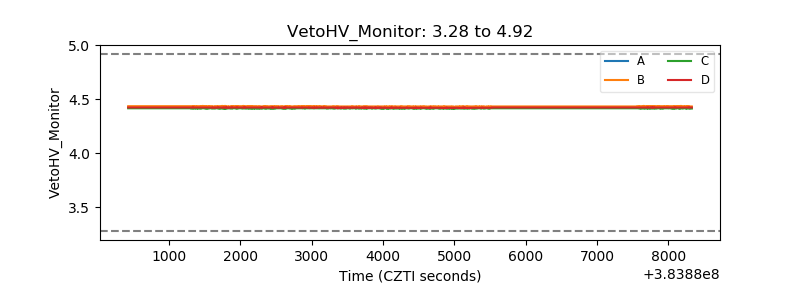 |
| Veto LLD | 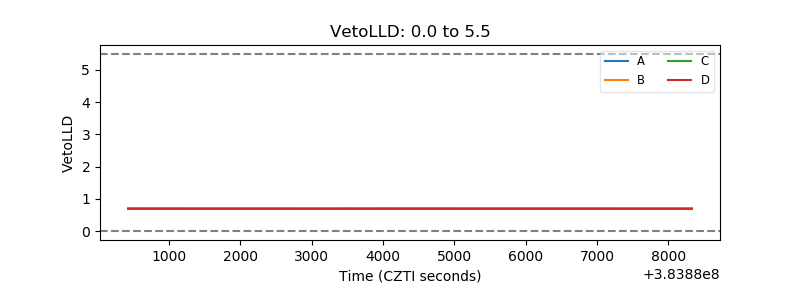 |
| Alpha Counter | 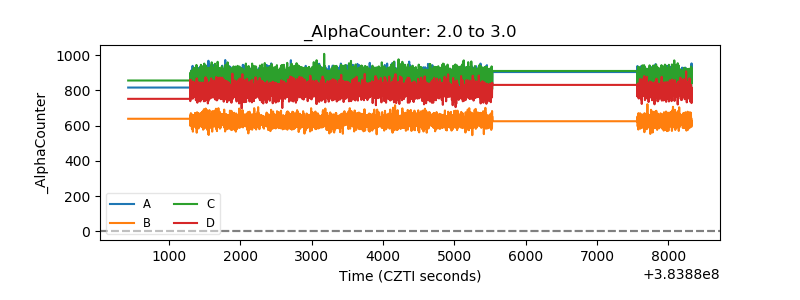 |
| _CPM_Rate | 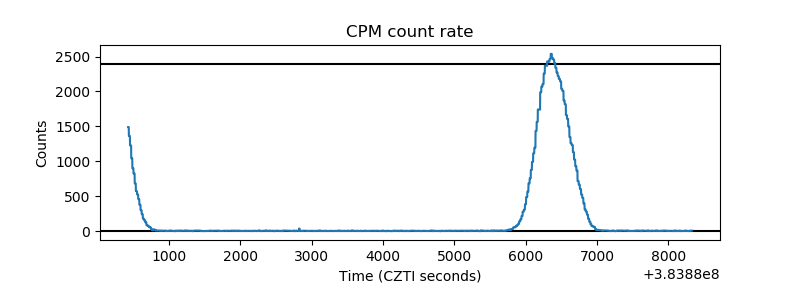 |
| CZT Counter | 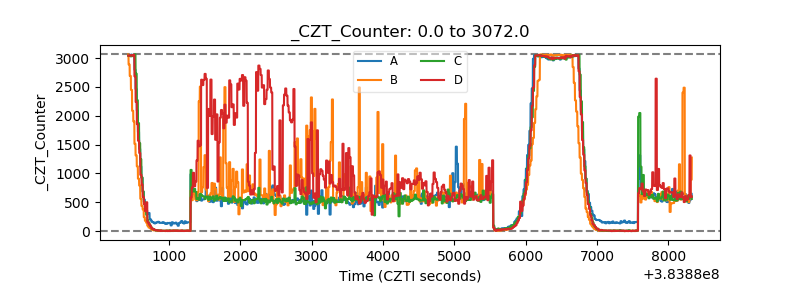 |
| +2.5 Volts monitor | 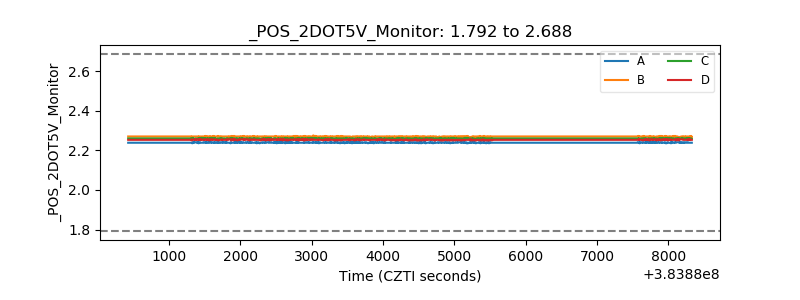 |
| +5 Volts monitor | 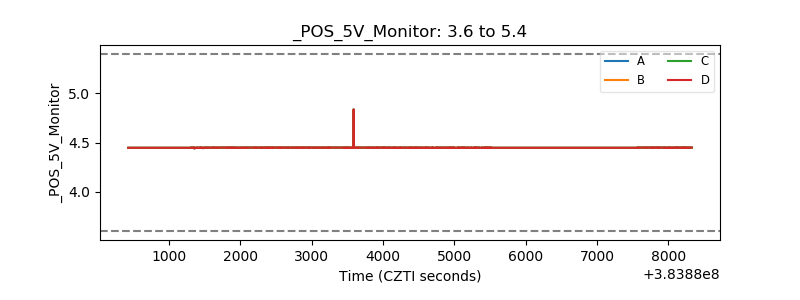 |
| _ROLL_ROT | 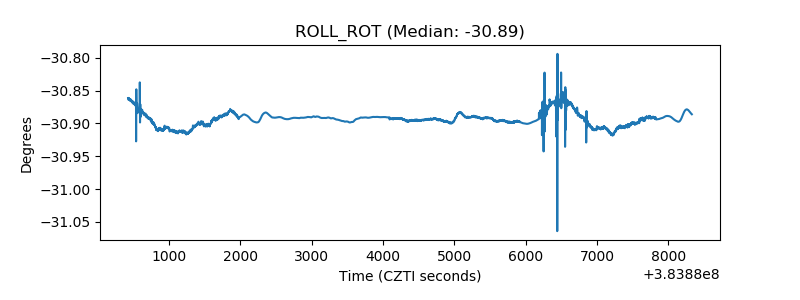 |
| _Roll_DEC | 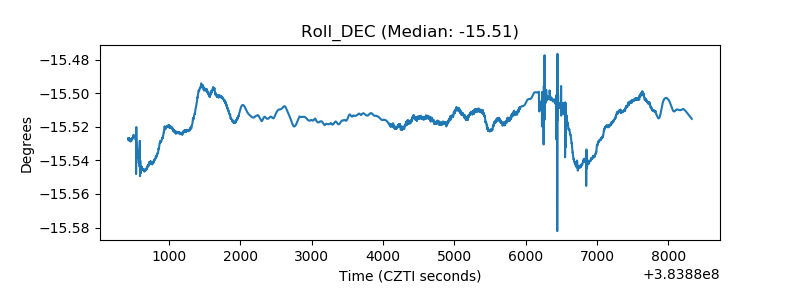 |
| _Roll_RA | 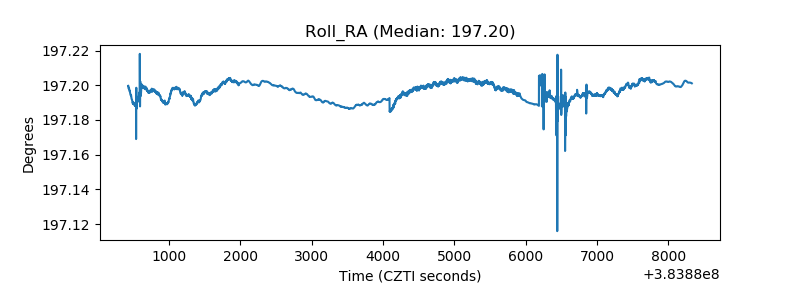 |
| Veto Counter | 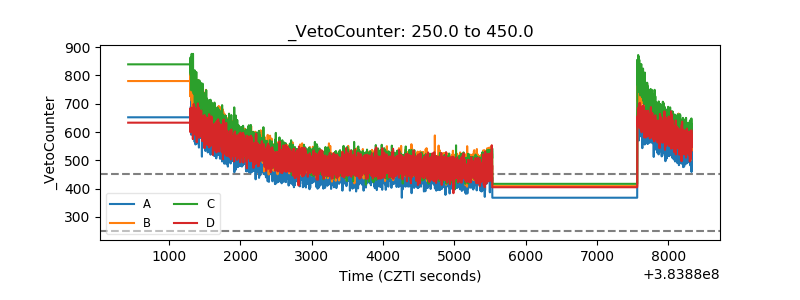 |