| Param | Original file | Final file |
|---|---|---|
| Filename | modeM0/AS1C07_001T01_9000004982_34736cztM0_level2.evt | modeM0/AS1C07_001T01_9000004982_34736cztM0_level2_quad_clean.evt |
| Size (bytes) | 673,473,600 | 121,910,400 |
| Size | 642.3 MB | 116.3 MB |
| Events in quadrant A | 3,994,542 | 799,544 |
| Events in quadrant B | 3,726,078 | 805,819 |
| Events in quadrant C | 3,988,722 | 805,480 |
| Events in quadrant D | 8,156,670 | 736,121 |
| Mode M0 | |||
|---|---|---|---|
| Quadrant | BADHDUFLAG | Total packets | Discarded packets |
| A | 0 | 17256 | 2 |
| B | 0 | 16330 | 2 |
| C | 0 | 16654 | 2 |
| D | 0 | 29839 | 2 |
| Mode SS | |||
|---|---|---|---|
| Quadrant | BADHDUFLAG | Total packets | Discarded packets |
| A | 0 | 158 | 0 |
| B | 0 | 158 | 0 |
| C | 0 | 158 | 0 |
| D | 0 | 158 | 0 |
| Mode M9 | |||
|---|---|---|---|
| Quadrant | BADHDUFLAG | Total packets | Discarded packets |
| A | 0 | 14 | 0 |
| B | 0 | 14 | 0 |
| C | 0 | 14 | 0 |
| D | 0 | 15 | 0 |
| Quadrant | Total seconds | Saturated seconds | Saturation percentage |
|---|---|---|---|
| A | 7843 | 11 | 0.140252% |
| B | 7843 | 39 | 0.497259% |
| C | 7843 | 73 | 0.930766% |
| D | 7843 | 678 | 8.644651% |
Noise dominated data is calculated using 1-second bins in cleaned event files. If a bin has >2000 counts, and if more than 50% of those come from <1% of pixels, then it is considered to be noise-dominated and hence unusable.
| Quadrant | # 1 sec bins | Bins with >0 counts | Bins with >2000 counts | High rate bins dominated by noise | Noise dominated (total time) | Noise dominated (detector-on time) | Marked lightcurve |
|---|---|---|---|---|---|---|---|
| A | 9185 | 7844 | 2 | 2 | 0.02% | 0.03% | 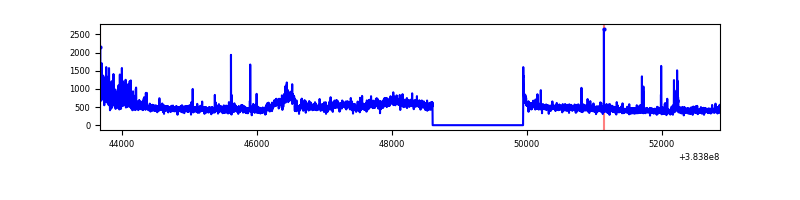 |
| B | 9185 | 7844 | 19 | 19 | 0.21% | 0.24% | 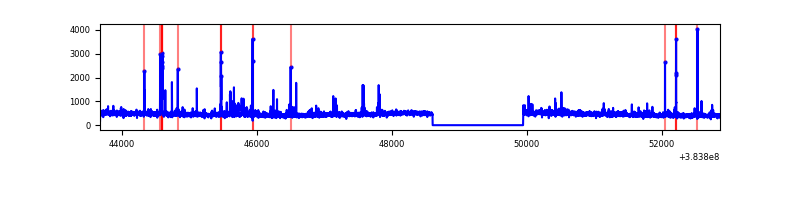 |
| C | 9185 | 7844 | 50 | 50 | 0.54% | 0.64% | 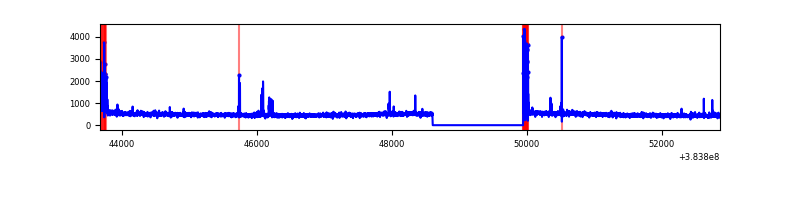 |
| D | 9185 | 7844 | 672 | 672 | 7.32% | 8.57% | 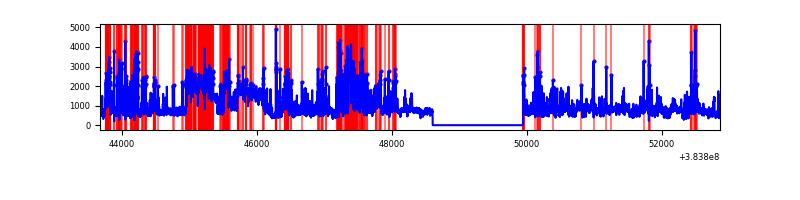 |
Top three noisy pixels from each quadrant. If the there are fewer than three noisy pixels in the level2.evt file, extra rows are filled as -1
| Pixel properties | Quadrant properties | ||||||
|---|---|---|---|---|---|---|---|
| Quadrant | DetID | PixID | Counts | Sigma | Mean | Median | Sigma |
| A | 15 | 174 | 248200 | 1405.23 | 878 | 860 | 176.0 |
| A | 15 | 169 | 241741 | 1368.54 | 878 | 860 | 176.0 |
| A | 10 | 83 | 57324 | 320.79 | 878 | 860 | 176.0 |
| B | 5 | 172 | 67656 | 398.69 | 875 | 853 | 167.6 |
| B | 4 | 232 | 65305 | 384.66 | 875 | 853 | 167.6 |
| B | 15 | 85 | 61366 | 361.15 | 875 | 853 | 167.6 |
| C | 15 | 214 | 328649 | 1638.43 | 859 | 865 | 200.1 |
| C | 0 | 10 | 212538 | 1058.05 | 859 | 865 | 200.1 |
| C | 15 | 208 | 49044 | 240.82 | 859 | 865 | 200.1 |
| D | 8 | 195 | 1786525 | 8716.31 | 834 | 813 | 204.9 |
| D | 1 | 20 | 1154200 | 5629.84 | 834 | 813 | 204.9 |
| D | 2 | 250 | 575644 | 2805.83 | 834 | 813 | 204.9 |
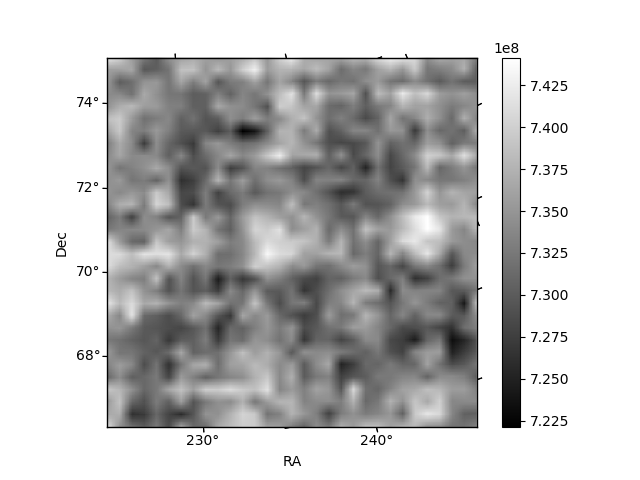
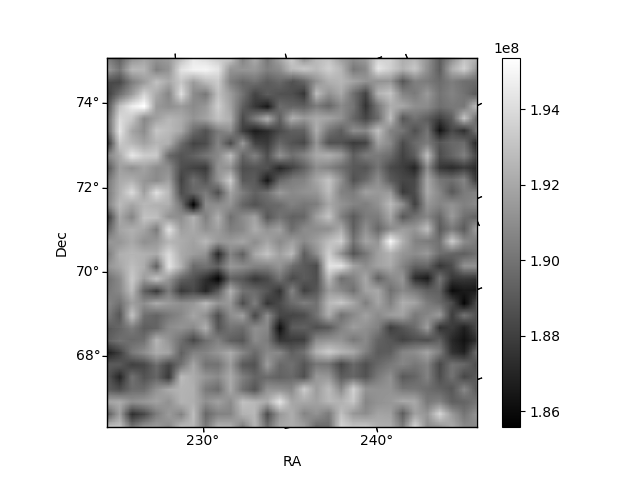
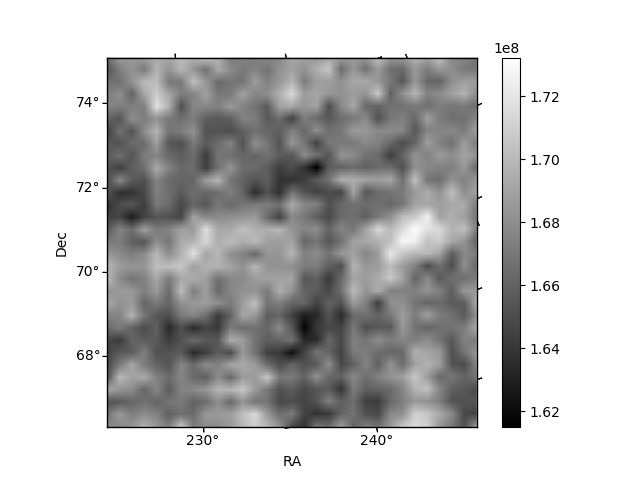
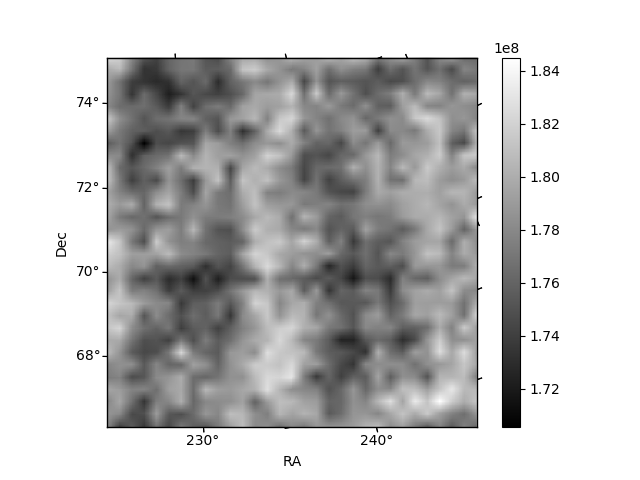
Histogram calculated using DETX and DETY for each event in the final _common_clean file
| Quadrant A | 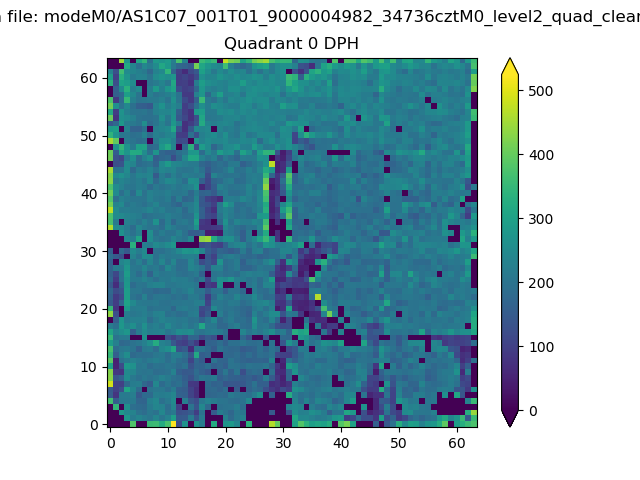 |
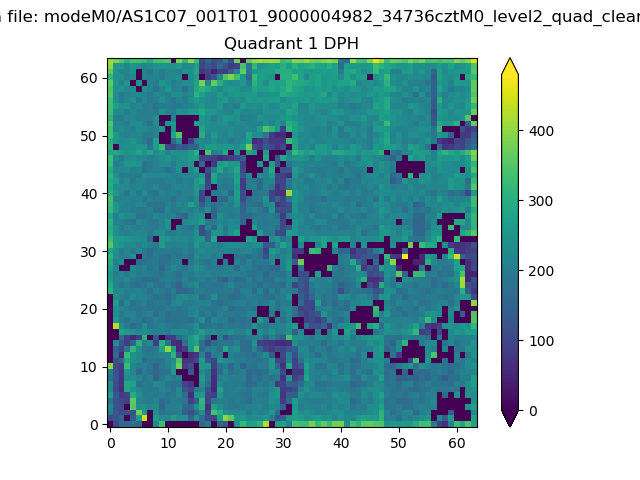 |
Quadrant B |
|---|---|---|---|
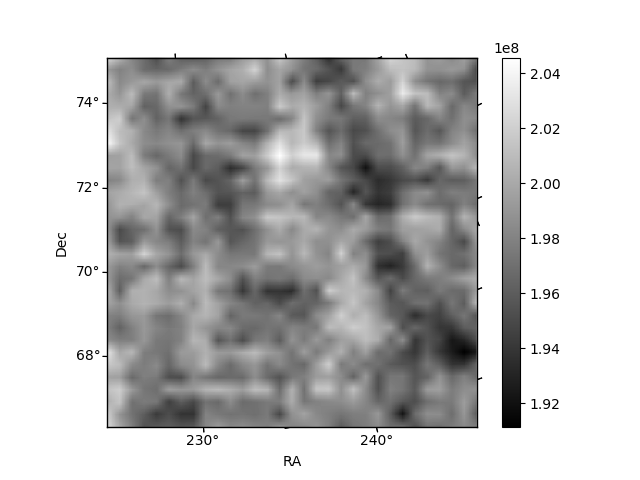
| Quadrant D | 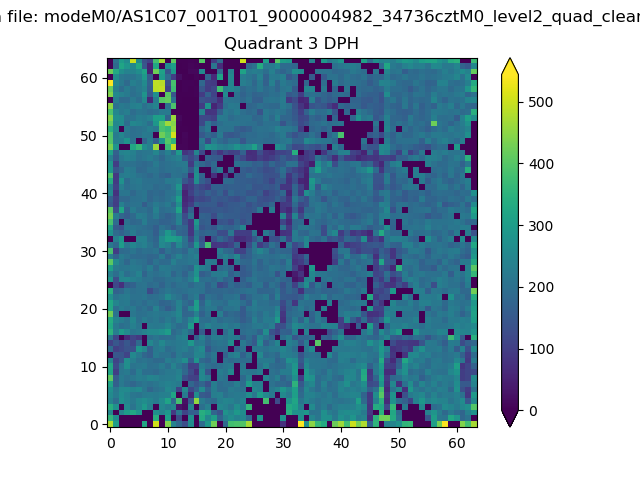 |
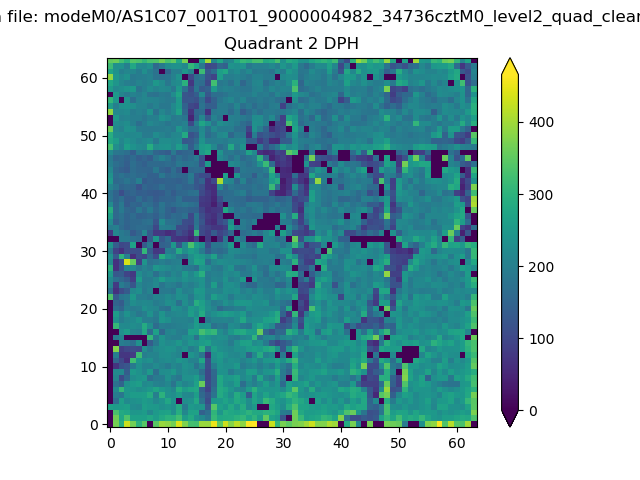 |
Quadrant C |
| Plot type | Count rate plots | Images |
|---|---|---|
| Comparison with Poisson distribution Blue bars denote a histogram of data divided into 1 sec bins. Red curve is a Poisson curve with rate = median count rate of data. |
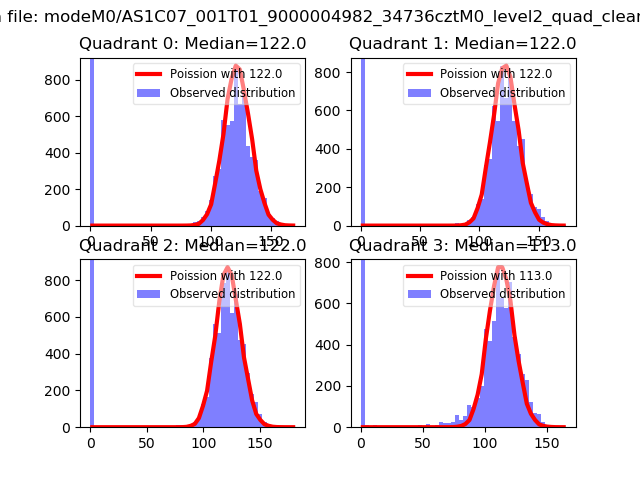 |
 |
| Quadrant-wise count rates Data is divided into 100 sec bins |
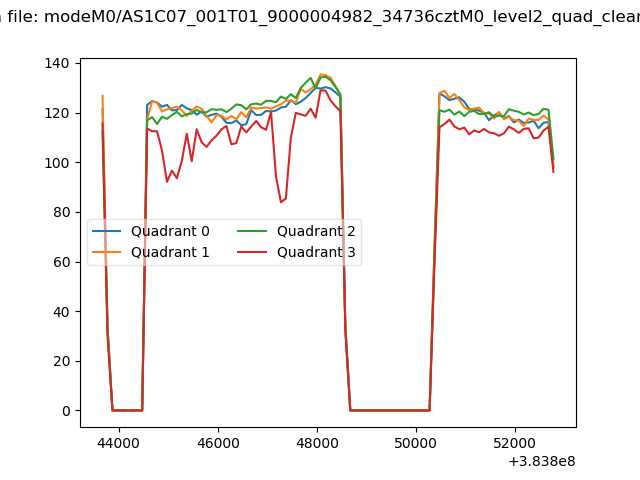 |
|
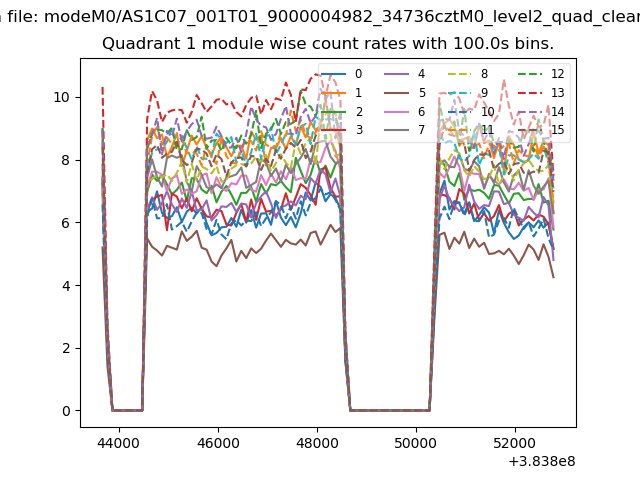
| Module-wise count rates for Quadrant A Data is divided into 100 sec bins |
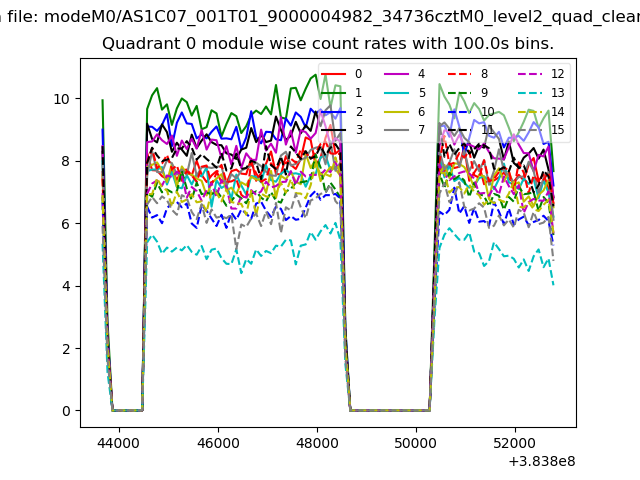 |
 |
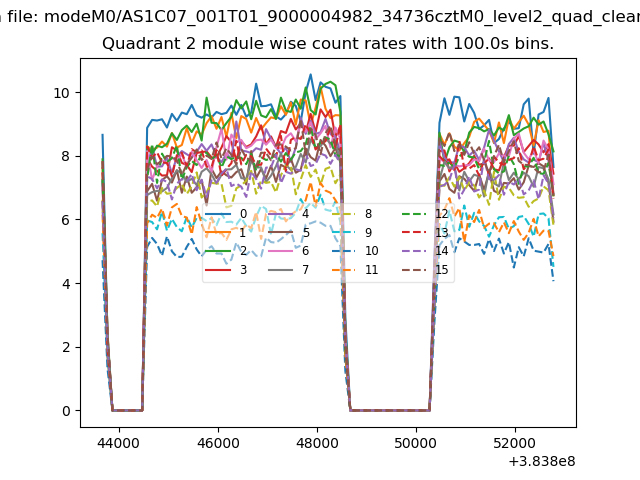
| Module-wise count rates for Quadrant B Data is divided into 100 sec bins |
 |
 |
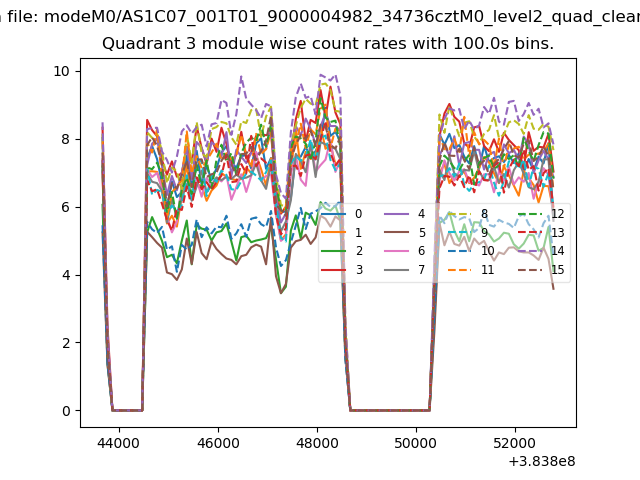
| Module-wise count rates for Quadrant C Data is divided into 100 sec bins |
 |
 |
| Module-wise count rates for Quadrant D Data is divided into 100 sec bins |
 |
 |
| Parameter | Plot |
|---|---|
| CZT HV Monitor | 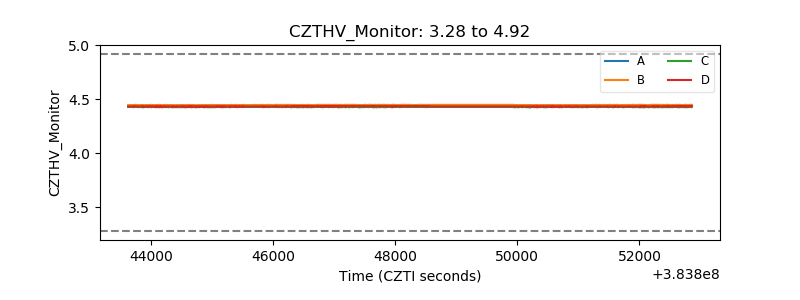 |
| D_VDD | 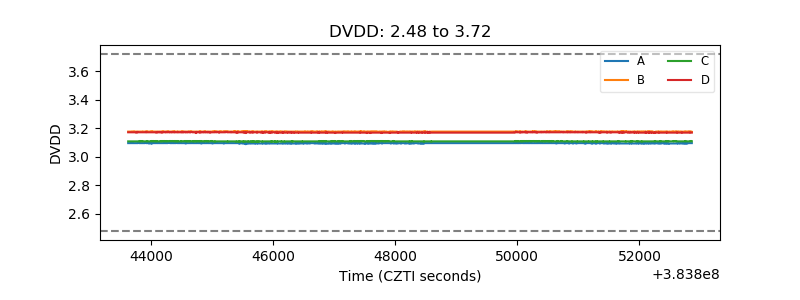 |
| Temperature 1 | 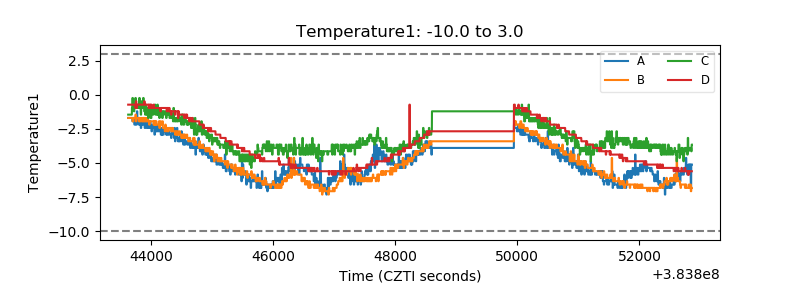 |
| Veto HV Monitor | 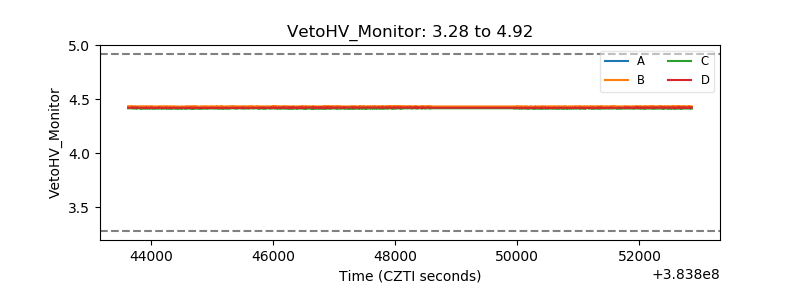 |
| Veto LLD | 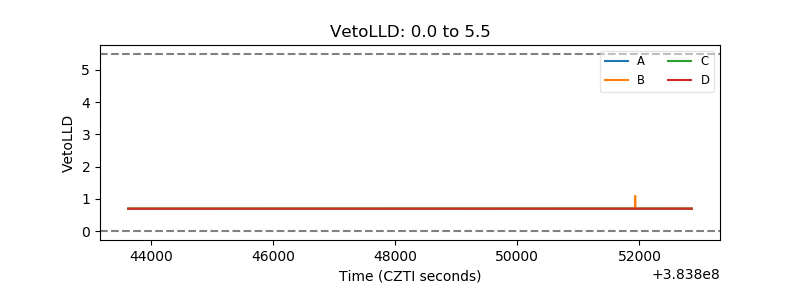 |
| Alpha Counter | 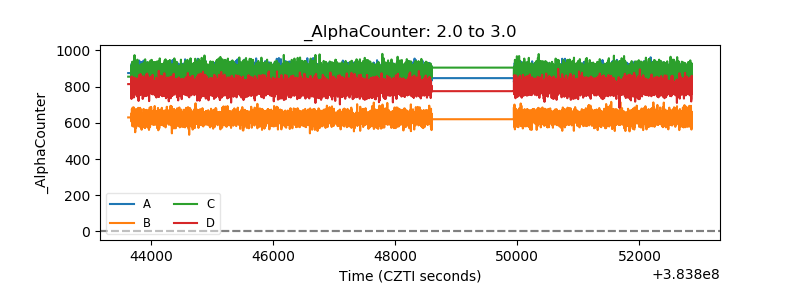 |
| _CPM_Rate | 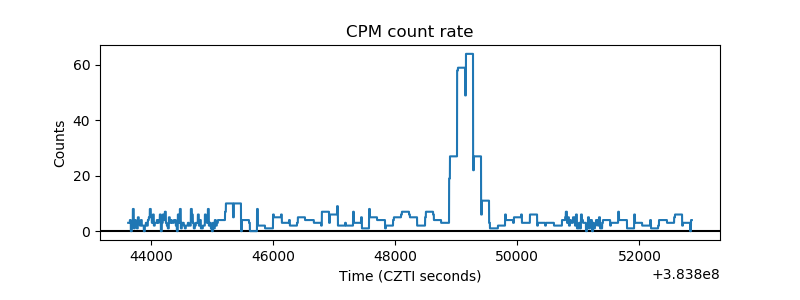 |
| CZT Counter | 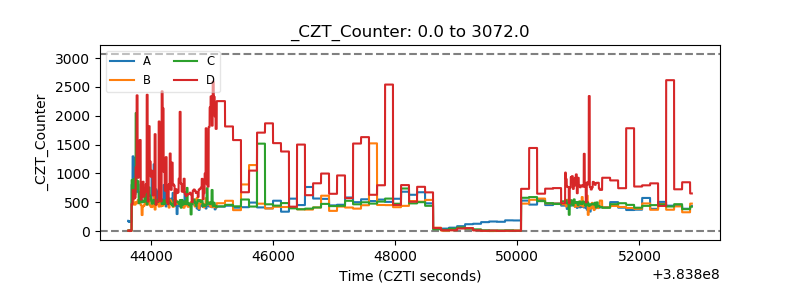 |
| +2.5 Volts monitor | 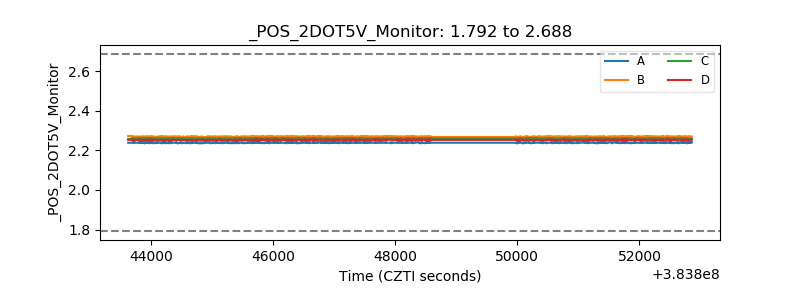 |
| +5 Volts monitor | 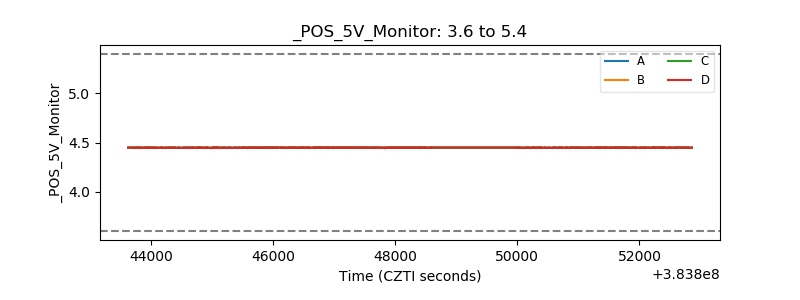 |
| _ROLL_ROT | 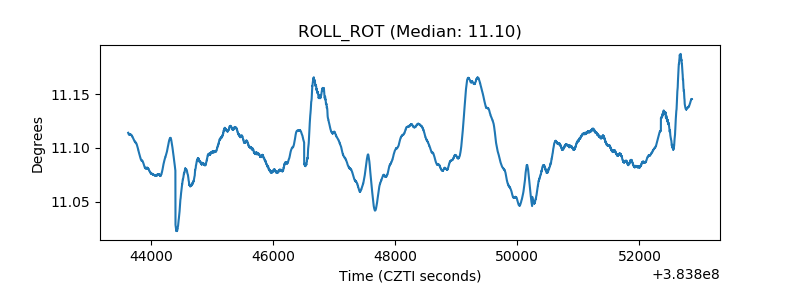 |
| _Roll_DEC | 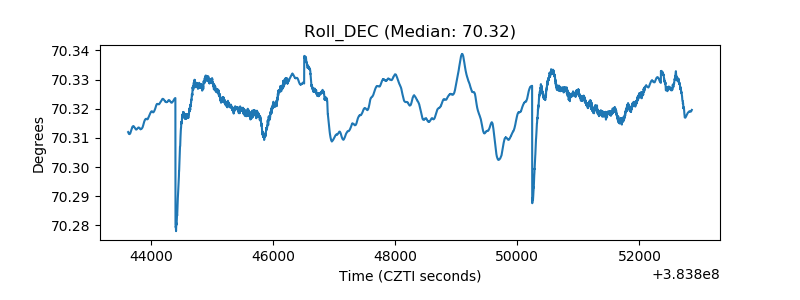 |
| _Roll_RA | 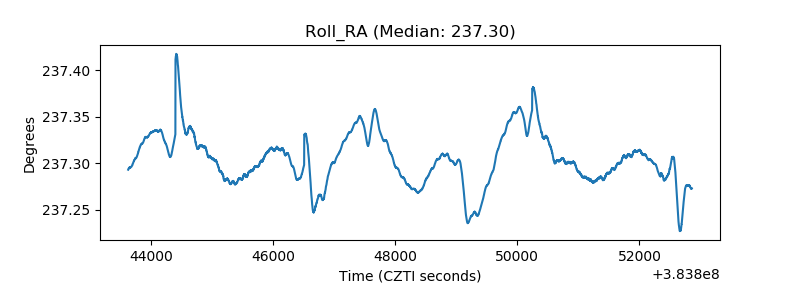 |
| Veto Counter | 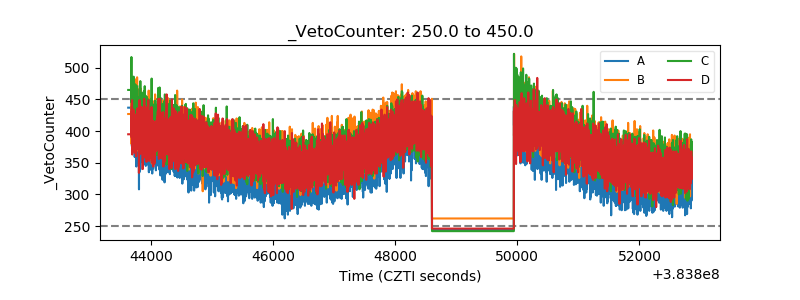 |