| Param | Original file | Final file |
|---|---|---|
| Filename | modeM0/AS1C07_001T01_9000004982_34731cztM0_level2.evt | modeM0/AS1C07_001T01_9000004982_34731cztM0_level2_quad_clean.evt |
| Size (bytes) | 544,222,080 | 89,801,280 |
| Size | 519.0 MB | 85.6 MB |
| Events in quadrant A | 3,284,824 | 589,062 |
| Events in quadrant B | 3,320,850 | 587,928 |
| Events in quadrant C | 2,945,872 | 586,834 |
| Events in quadrant D | 6,529,514 | 541,753 |
| Mode M0 | |||
|---|---|---|---|
| Quadrant | BADHDUFLAG | Total packets | Discarded packets |
| A | 0 | 13469 | 3 |
| B | 0 | 13757 | 2 |
| C | 0 | 12253 | 2 |
| D | 0 | 23579 | 2 |
| Mode SS | |||
|---|---|---|---|
| Quadrant | BADHDUFLAG | Total packets | Discarded packets |
| A | 0 | 120 | 0 |
| B | 0 | 120 | 0 |
| C | 0 | 120 | 0 |
| D | 0 | 120 | 0 |
| Mode M9 | |||
|---|---|---|---|
| Quadrant | BADHDUFLAG | Total packets | Discarded packets |
| A | 0 | 14 | 0 |
| B | 0 | 14 | 0 |
| C | 0 | 14 | 0 |
| D | 0 | 15 | 0 |
| Quadrant | Total seconds | Saturated seconds | Saturation percentage |
|---|---|---|---|
| A | 5922 | 13 | 0.219520% |
| B | 5922 | 174 | 2.938197% |
| C | 5922 | 29 | 0.489699% |
| D | 5922 | 447 | 7.548126% |
Noise dominated data is calculated using 1-second bins in cleaned event files. If a bin has >2000 counts, and if more than 50% of those come from <1% of pixels, then it is considered to be noise-dominated and hence unusable.
| Quadrant | # 1 sec bins | Bins with >0 counts | Bins with >2000 counts | High rate bins dominated by noise | Noise dominated (total time) | Noise dominated (detector-on time) | Marked lightcurve |
|---|---|---|---|---|---|---|---|
| A | 7265 | 5923 | 1 | 1 | 0.01% | 0.02% | 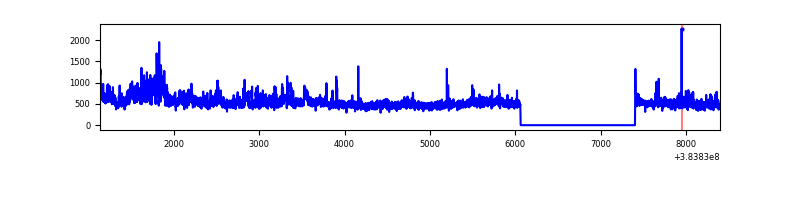 |
| B | 7265 | 5923 | 109 | 109 | 1.50% | 1.84% | 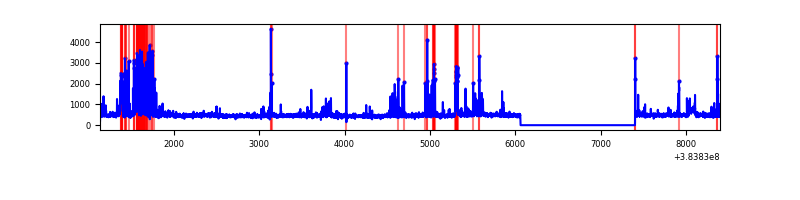 |
| C | 7265 | 5923 | 17 | 17 | 0.23% | 0.29% | 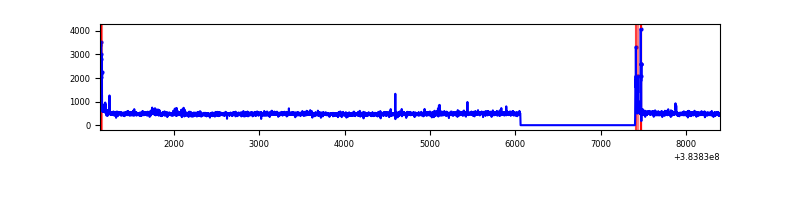 |
| D | 7265 | 5923 | 359 | 359 | 4.94% | 6.06% | 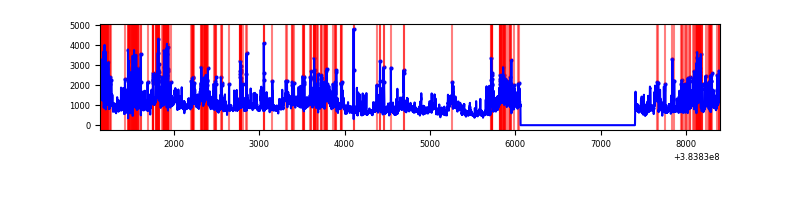 |
Top three noisy pixels from each quadrant. If the there are fewer than three noisy pixels in the level2.evt file, extra rows are filled as -1
| Pixel properties | Quadrant properties | ||||||
|---|---|---|---|---|---|---|---|
| Quadrant | DetID | PixID | Counts | Sigma | Mean | Median | Sigma |
| A | 15 | 169 | 544115 | 4009.27 | 676 | 664 | 135.5 |
| A | 10 | 83 | 51307 | 373.61 | 676 | 664 | 135.5 |
| A | 7 | 48 | 27260 | 196.21 | 676 | 664 | 135.5 |
| B | 5 | 172 | 557244 | 4329.5 | 665 | 647 | 128.6 |
| B | 15 | 32 | 24620 | 186.47 | 665 | 647 | 128.6 |
| B | 15 | 85 | 19999 | 150.53 | 665 | 647 | 128.6 |
| C | 15 | 214 | 253390 | 1659.09 | 656 | 660 | 152.3 |
| C | 0 | 10 | 97658 | 636.76 | 656 | 660 | 152.3 |
| C | 14 | 67 | 16000 | 100.7 | 656 | 660 | 152.3 |
| D | 1 | 20 | 1250094 | 7391.7 | 639 | 625 | 169.0 |
| D | 8 | 195 | 1200385 | 7097.63 | 639 | 625 | 169.0 |
| D | 2 | 249 | 441320 | 2607.1 | 639 | 625 | 169.0 |
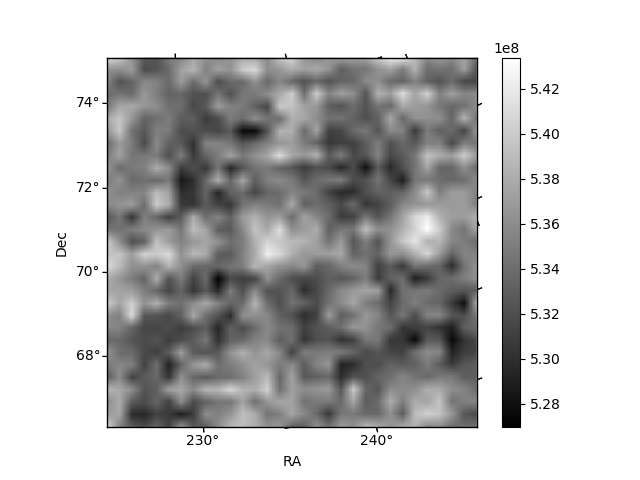
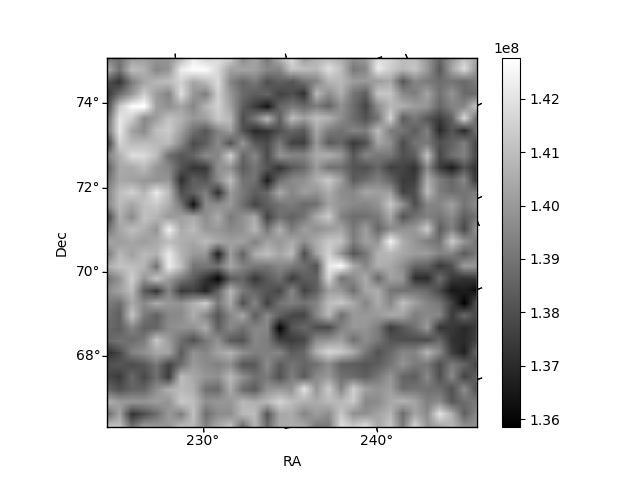
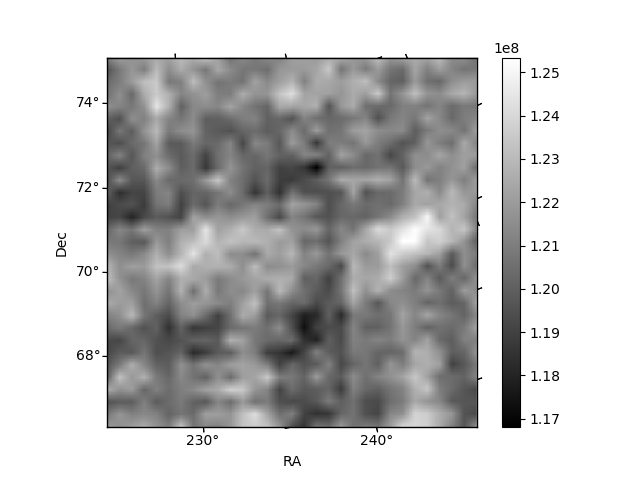
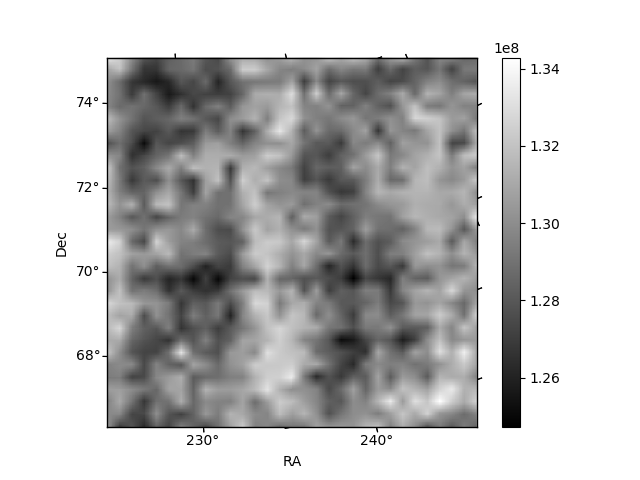
Histogram calculated using DETX and DETY for each event in the final _common_clean file
| Quadrant A | 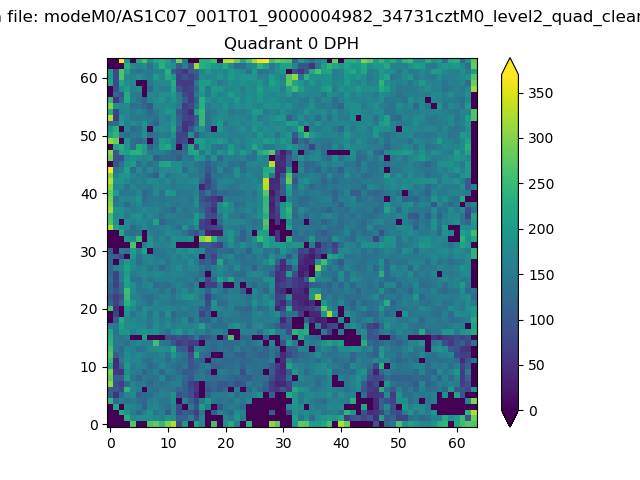 |
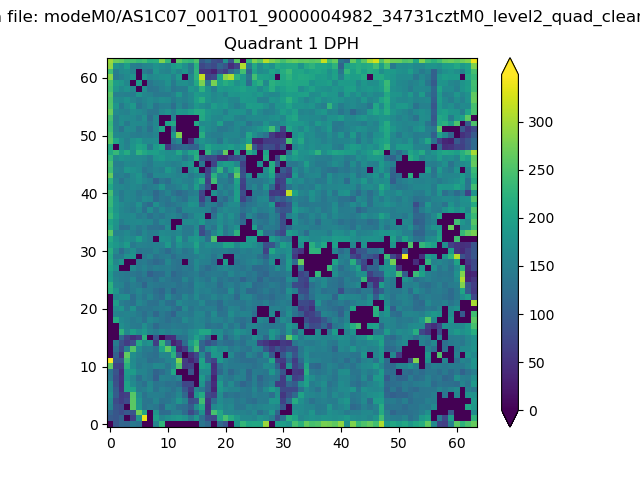 |
Quadrant B |
|---|---|---|---|
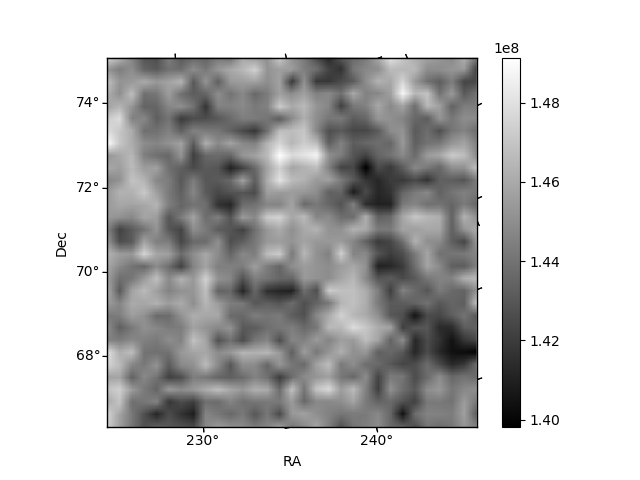
| Quadrant D | 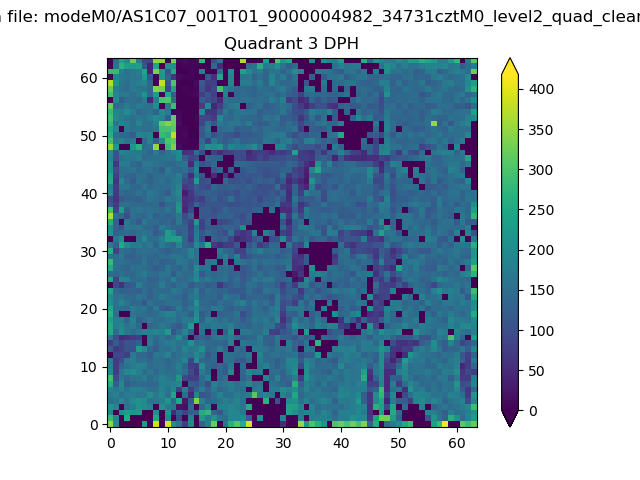 |
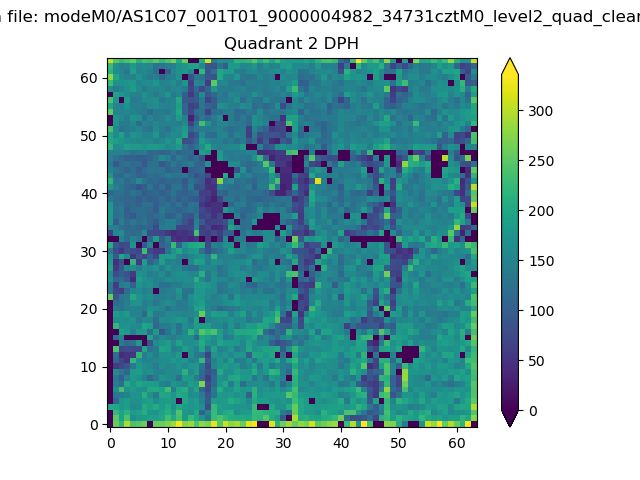 |
Quadrant C |
| Plot type | Count rate plots | Images |
|---|---|---|
| Comparison with Poisson distribution Blue bars denote a histogram of data divided into 1 sec bins. Red curve is a Poisson curve with rate = median count rate of data. |
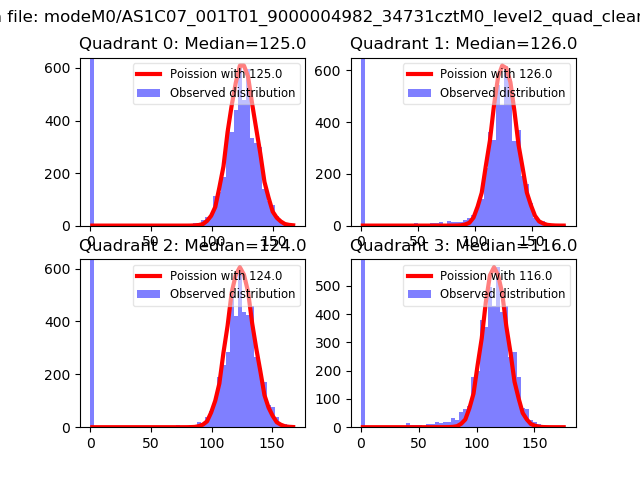 |
 |
| Quadrant-wise count rates Data is divided into 100 sec bins |
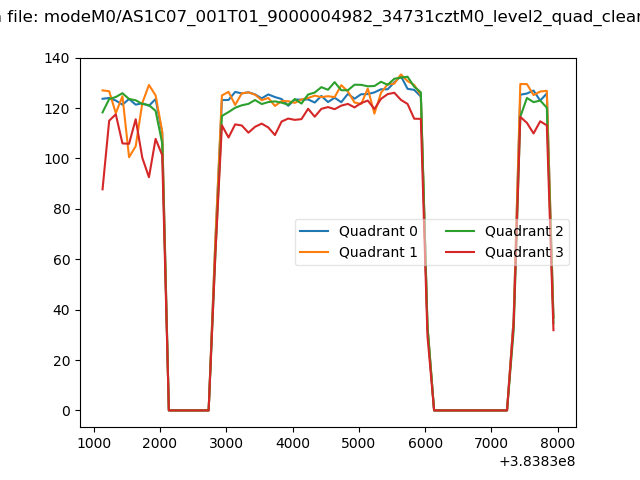 |
|
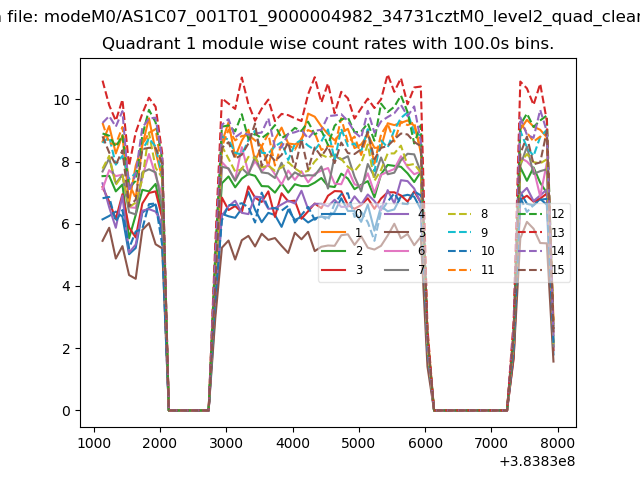
| Module-wise count rates for Quadrant A Data is divided into 100 sec bins |
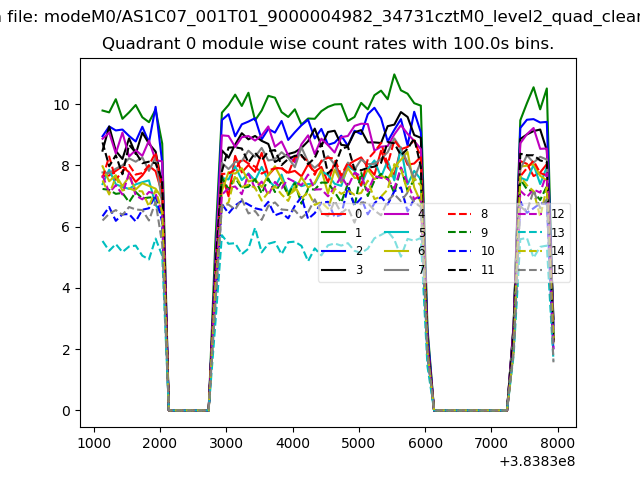 |
 |
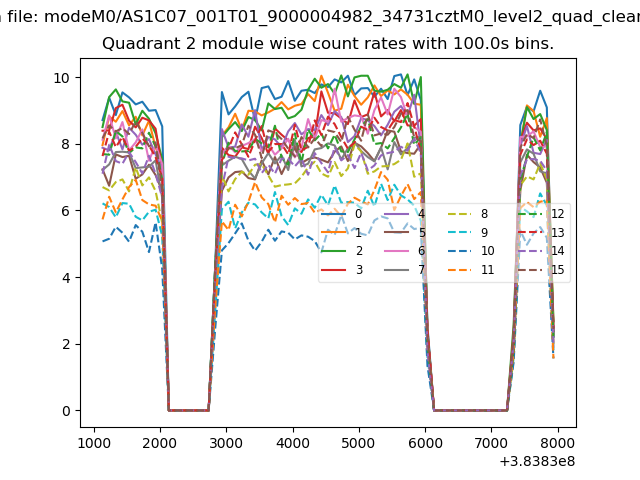
| Module-wise count rates for Quadrant B Data is divided into 100 sec bins |
 |
 |
| Module-wise count rates for Quadrant C Data is divided into 100 sec bins |
 |
 |
| Module-wise count rates for Quadrant D Data is divided into 100 sec bins |
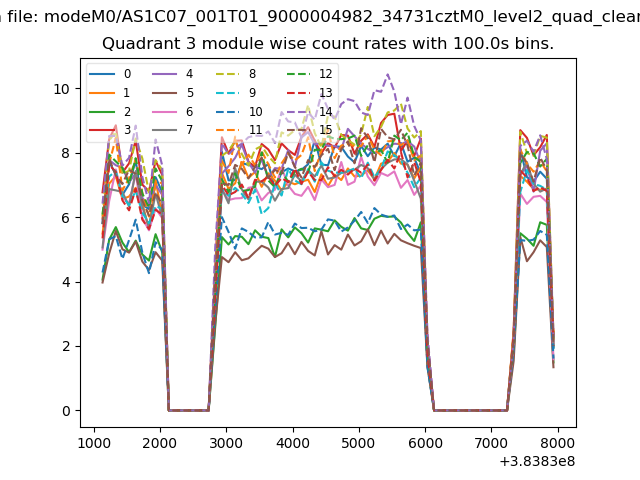 |
 |
| Parameter | Plot |
|---|---|
| CZT HV Monitor | 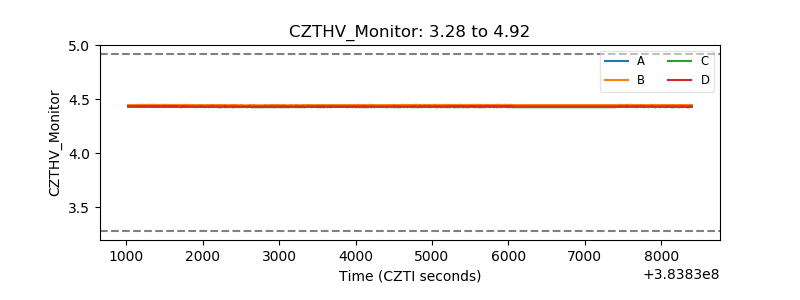 |
| D_VDD | 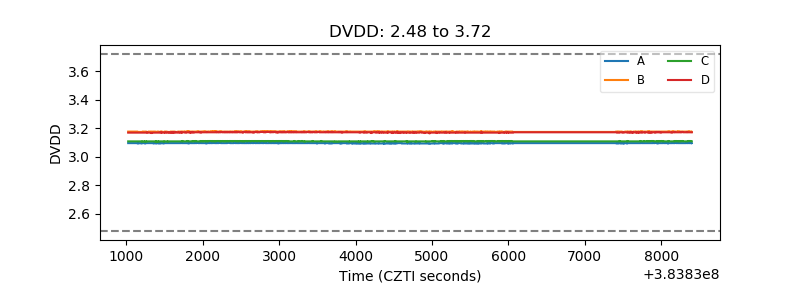 |
| Temperature 1 | 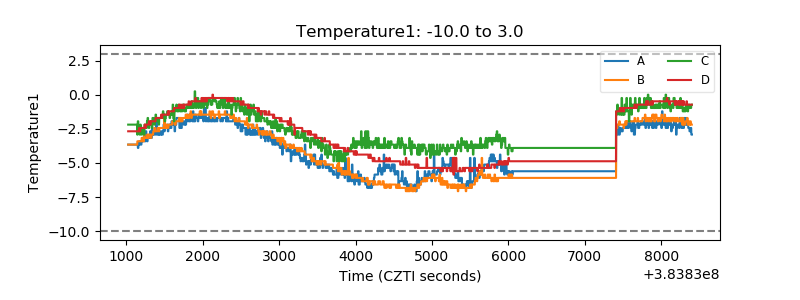 |
| Veto HV Monitor |  |
| Veto LLD | 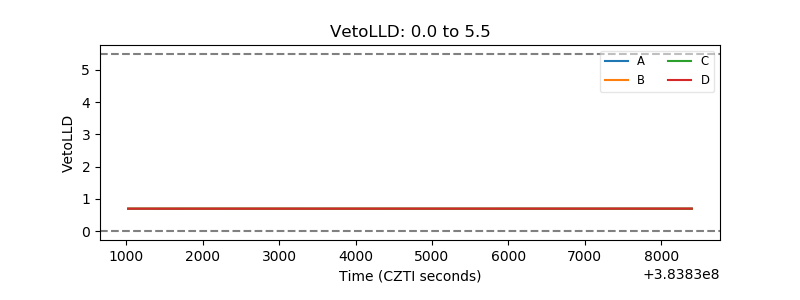 |
| Alpha Counter | 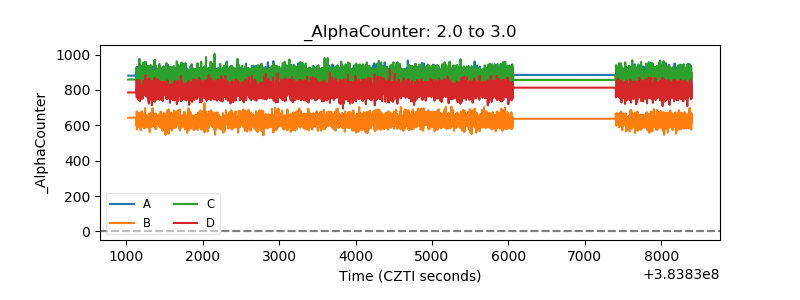 |
| _CPM_Rate | 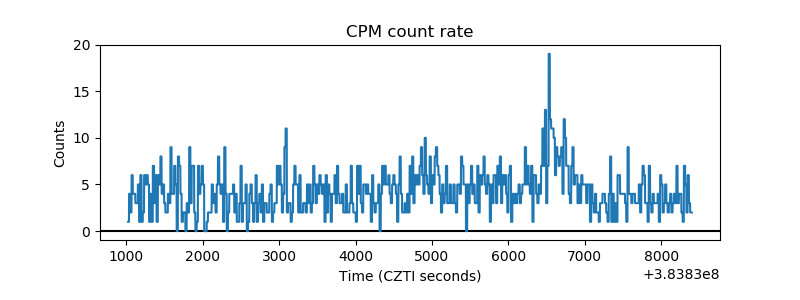 |
| CZT Counter | 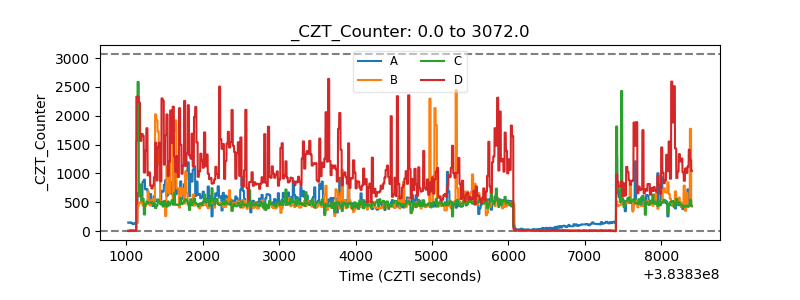 |
| +2.5 Volts monitor | 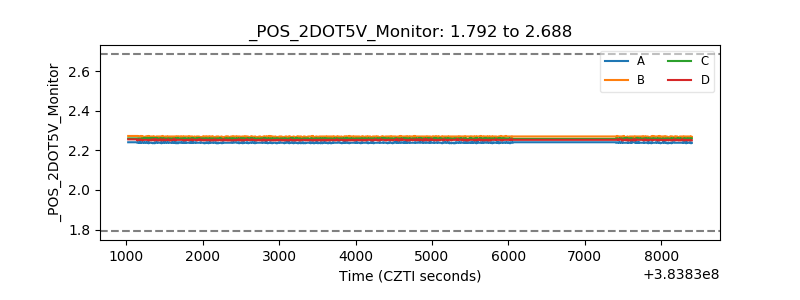 |
| +5 Volts monitor | 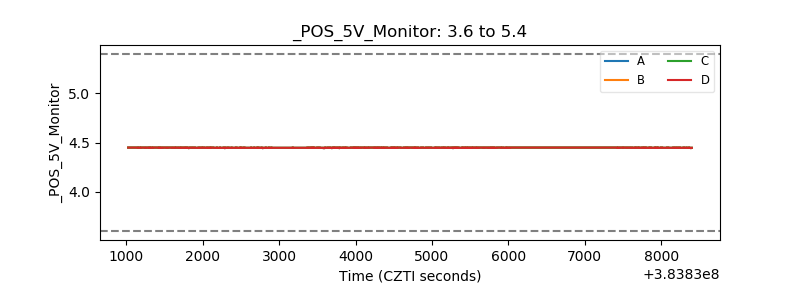 |
| _ROLL_ROT | 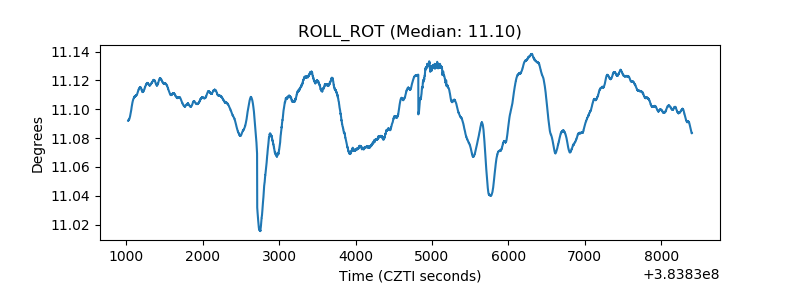 |
| _Roll_DEC | 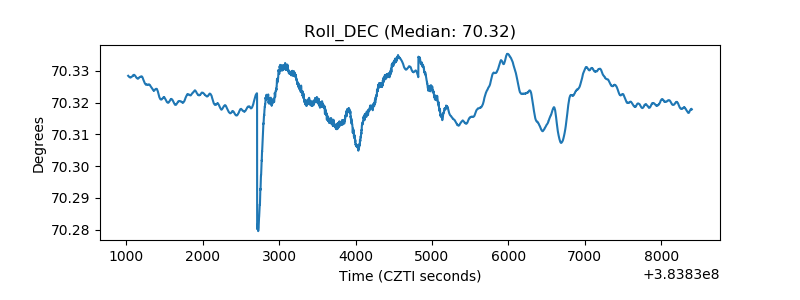 |
| _Roll_RA | 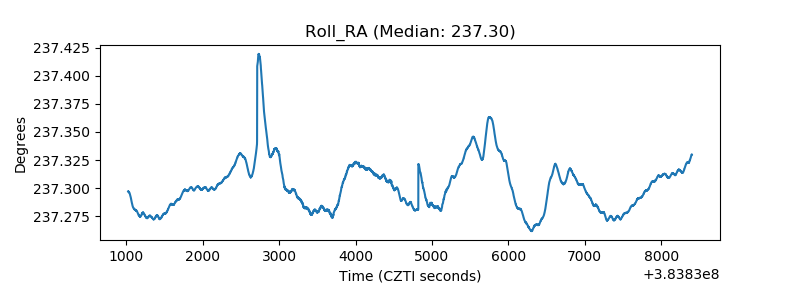 |
| Veto Counter | 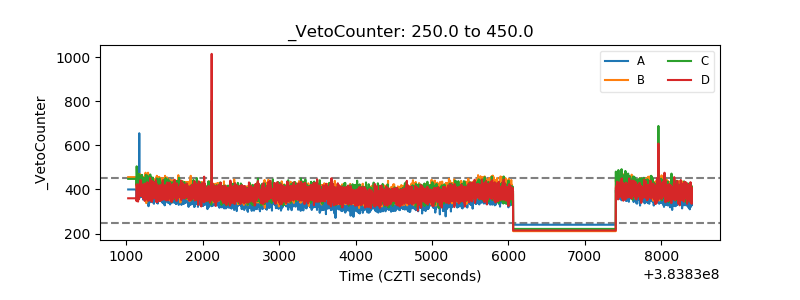 |