| Param | Original file | Final file |
|---|---|---|
| Filename | modeM0/AS1C07_001T01_9000004982_34730cztM0_level2.evt | modeM0/AS1C07_001T01_9000004982_34730cztM0_level2_quad_clean.evt |
| Size (bytes) | 584,078,400 | 88,211,520 |
| Size | 557.0 MB | 84.1 MB |
| Events in quadrant A | 3,695,849 | 596,683 |
| Events in quadrant B | 3,245,767 | 602,540 |
| Events in quadrant C | 2,766,125 | 602,344 |
| Events in quadrant D | 7,605,493 | 480,889 |
| Mode M0 | |||
|---|---|---|---|
| Quadrant | BADHDUFLAG | Total packets | Discarded packets |
| A | 0 | 14806 | 3 |
| B | 0 | 13259 | 2 |
| C | 0 | 11491 | 2 |
| D | 0 | 26484 | 2 |
| Mode SS | |||
|---|---|---|---|
| Quadrant | BADHDUFLAG | Total packets | Discarded packets |
| A | 0 | 112 | 0 |
| B | 0 | 112 | 0 |
| C | 0 | 112 | 0 |
| D | 0 | 112 | 0 |
| Mode M9 | |||
|---|---|---|---|
| Quadrant | BADHDUFLAG | Total packets | Discarded packets |
| A | 0 | 23 | 0 |
| B | 0 | 23 | 0 |
| C | 0 | 23 | 0 |
| D | 0 | 24 | 0 |
| Quadrant | Total seconds | Saturated seconds | Saturation percentage |
|---|---|---|---|
| A | 5551 | 150 | 2.702216% |
| B | 5551 | 175 | 3.152585% |
| C | 5551 | 24 | 0.432355% |
| D | 5551 | 1360 | 24.500090% |
Noise dominated data is calculated using 1-second bins in cleaned event files. If a bin has >2000 counts, and if more than 50% of those come from <1% of pixels, then it is considered to be noise-dominated and hence unusable.
| Quadrant | # 1 sec bins | Bins with >0 counts | Bins with >2000 counts | High rate bins dominated by noise | Noise dominated (total time) | Noise dominated (detector-on time) | Marked lightcurve |
|---|---|---|---|---|---|---|---|
| A | 7074 | 5552 | 96 | 96 | 1.36% | 1.73% | 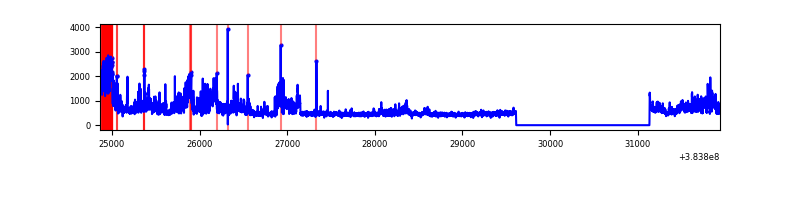 |
| B | 7074 | 5552 | 107 | 107 | 1.51% | 1.93% | 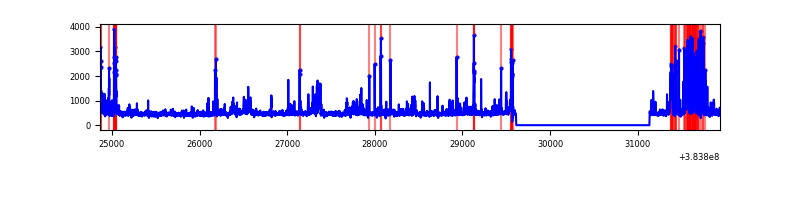 |
| C | 7074 | 5552 | 19 | 19 | 0.27% | 0.34% | 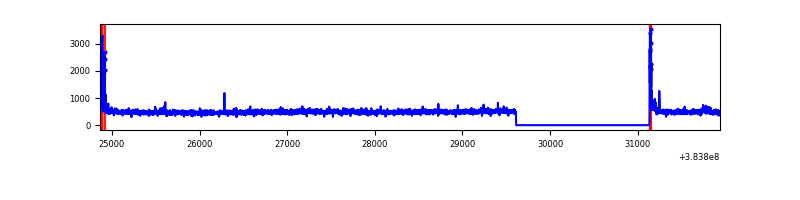 |
| D | 7074 | 5552 | 1131 | 1131 | 15.99% | 20.37% | 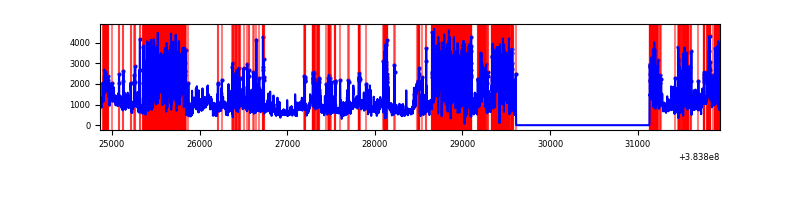 |
Top three noisy pixels from each quadrant. If the there are fewer than three noisy pixels in the level2.evt file, extra rows are filled as -1
| Pixel properties | Quadrant properties | ||||||
|---|---|---|---|---|---|---|---|
| Quadrant | DetID | PixID | Counts | Sigma | Mean | Median | Sigma |
| A | 15 | 169 | 1162940 | 9204.89 | 628 | 614 | 126.3 |
| A | 10 | 83 | 49113 | 384.08 | 628 | 614 | 126.3 |
| A | 9 | 143 | 32349 | 251.32 | 628 | 614 | 126.3 |
| B | 5 | 172 | 550382 | 4613.05 | 623 | 607 | 119.2 |
| B | 4 | 171 | 89163 | 743.05 | 623 | 607 | 119.2 |
| B | 4 | 232 | 47780 | 395.82 | 623 | 607 | 119.2 |
| C | 15 | 214 | 239805 | 1680.73 | 614 | 617 | 142.3 |
| C | 0 | 10 | 96634 | 674.7 | 614 | 617 | 142.3 |
| C | 14 | 67 | 20592 | 140.36 | 614 | 617 | 142.3 |
| D | 2 | 249 | 2721668 | 20444.2 | 544 | 528 | 133.1 |
| D | 8 | 195 | 1691437 | 12703.97 | 544 | 528 | 133.1 |
| D | 10 | 118 | 360024 | 2700.93 | 544 | 528 | 133.1 |
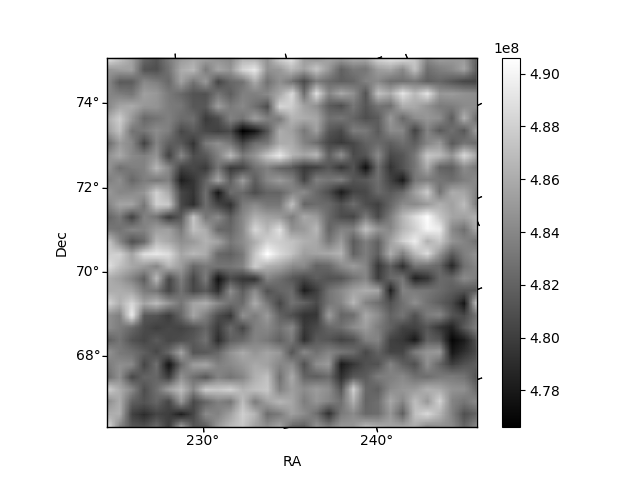
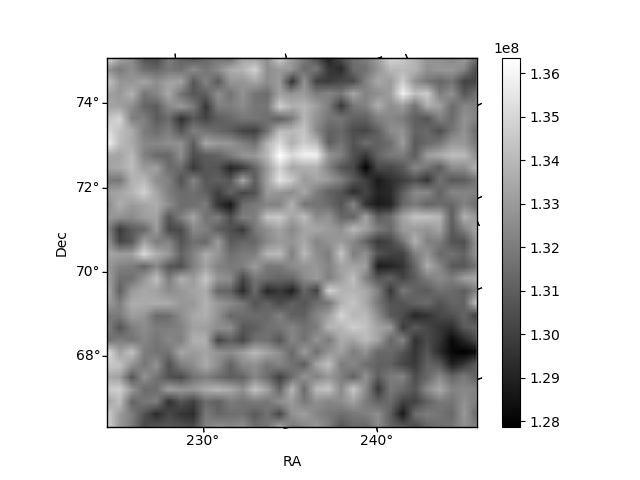
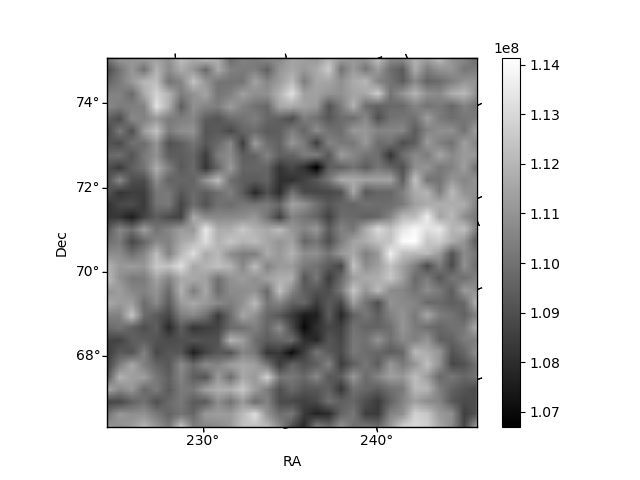
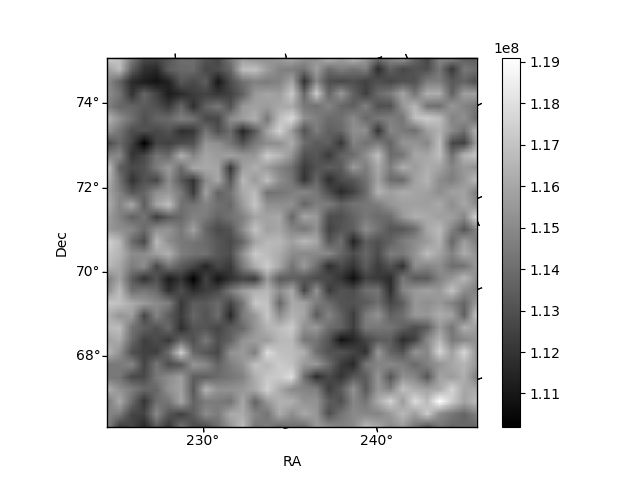
Histogram calculated using DETX and DETY for each event in the final _common_clean file
| Quadrant A | 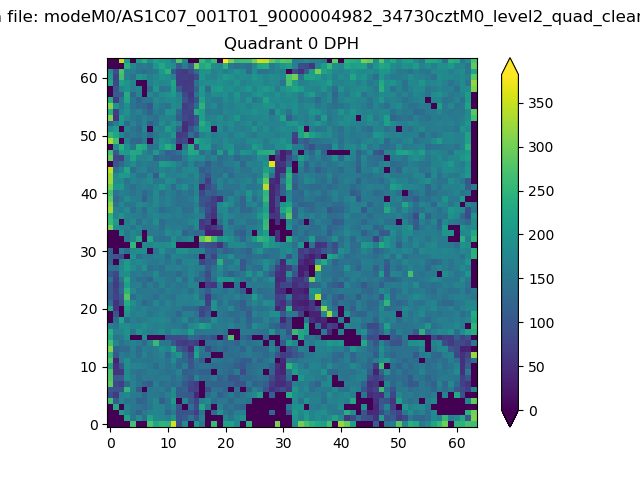 |
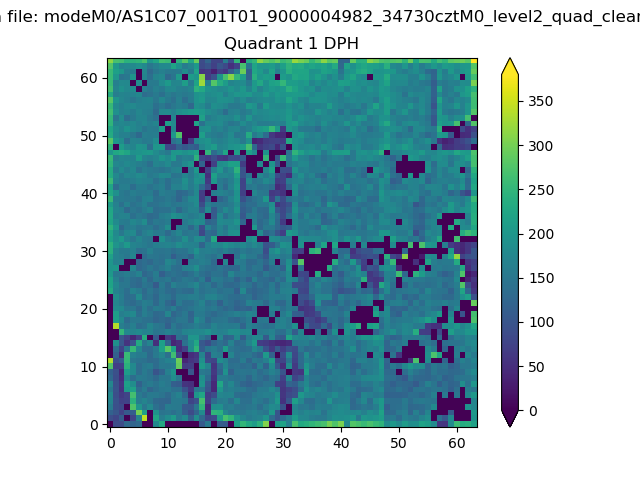 |
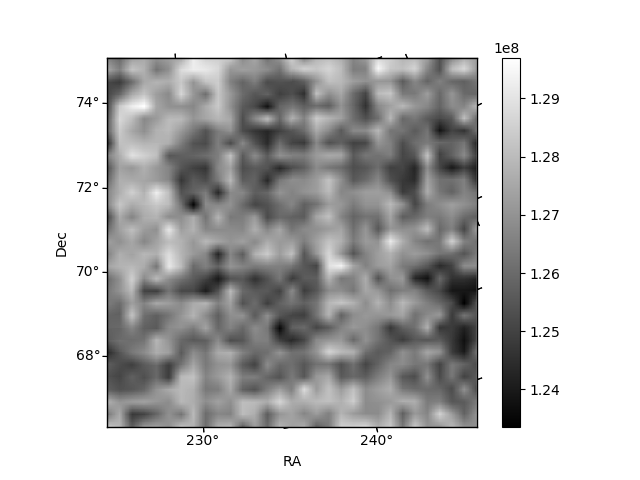
Quadrant B |
|---|---|---|---|
| Quadrant D | 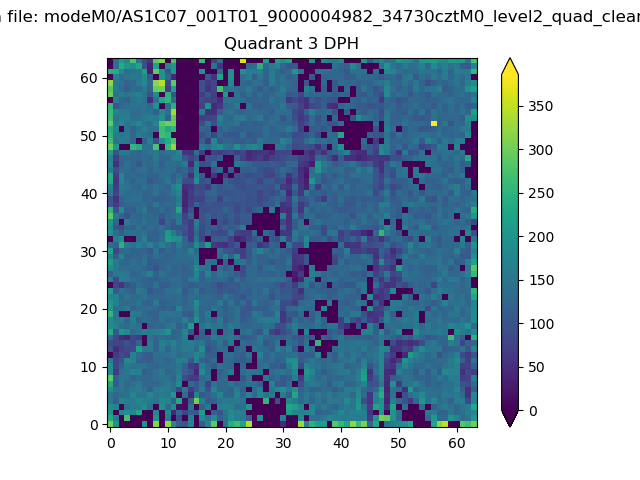 |
 |
Quadrant C |
| Plot type | Count rate plots | Images |
|---|---|---|
| Comparison with Poisson distribution Blue bars denote a histogram of data divided into 1 sec bins. Red curve is a Poisson curve with rate = median count rate of data. |
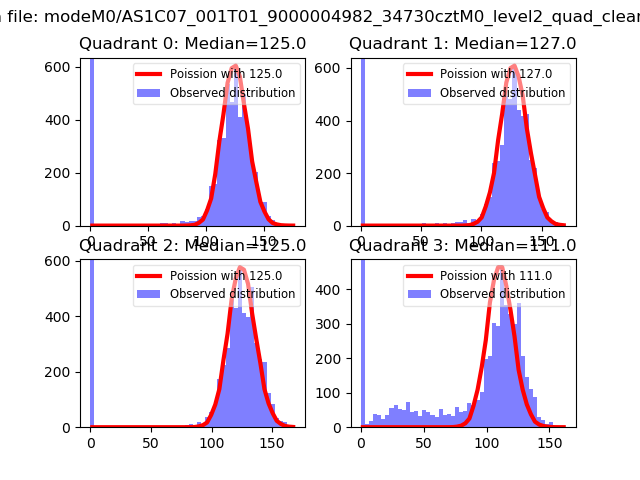 |
 |
| Quadrant-wise count rates Data is divided into 100 sec bins |
 |
|
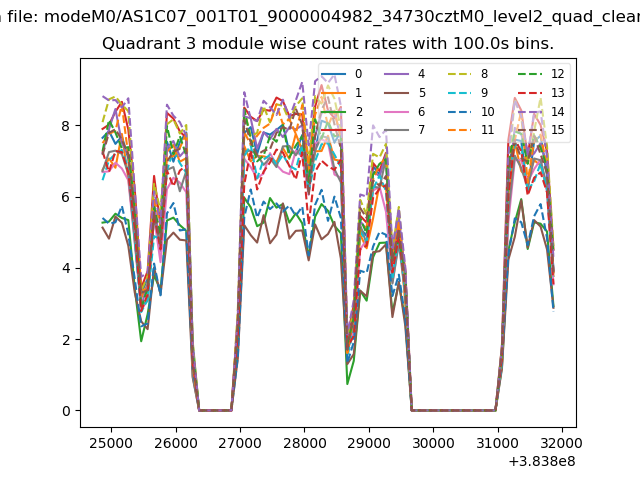
| Module-wise count rates for Quadrant A Data is divided into 100 sec bins |
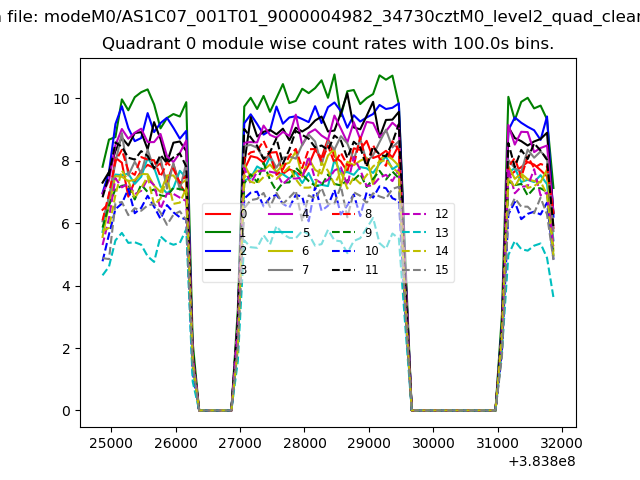 |
 |
| Module-wise count rates for Quadrant B Data is divided into 100 sec bins |
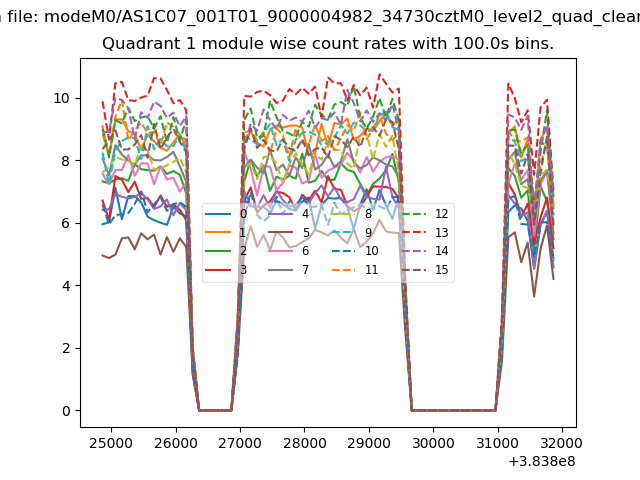 |
 |
| Module-wise count rates for Quadrant C Data is divided into 100 sec bins |
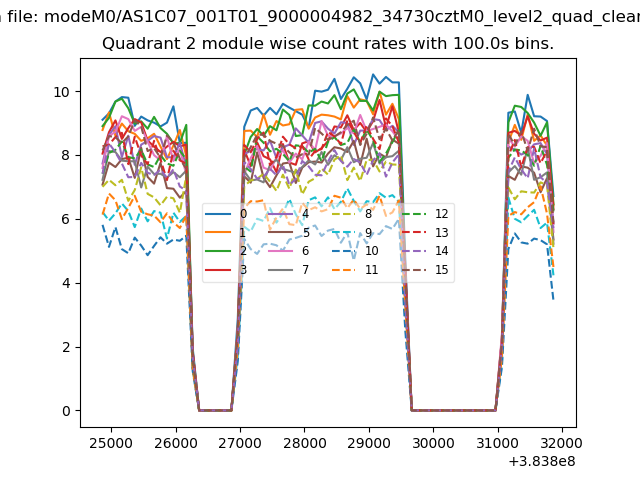 |
 |
| Module-wise count rates for Quadrant D Data is divided into 100 sec bins |
 |
 |
| Parameter | Plot |
|---|---|
| CZT HV Monitor | 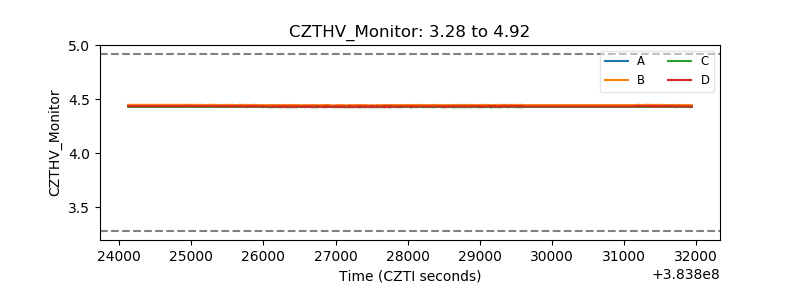 |
| D_VDD | 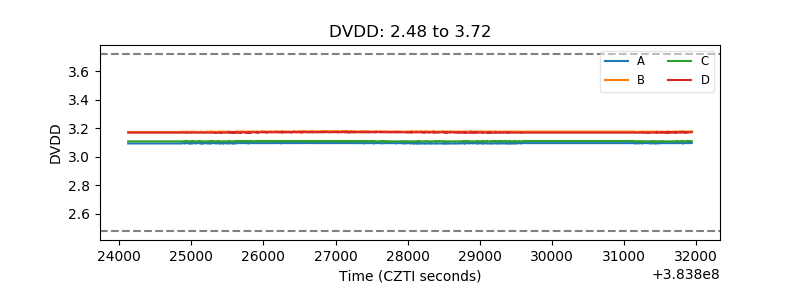 |
| Temperature 1 | 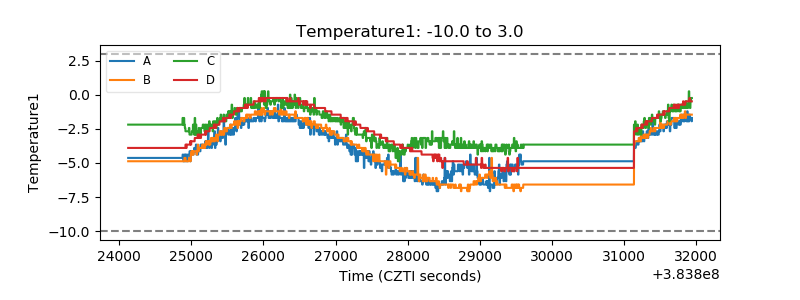 |
| Veto HV Monitor | 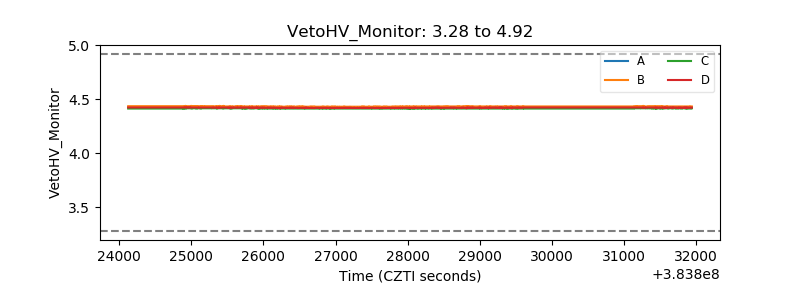 |
| Veto LLD | 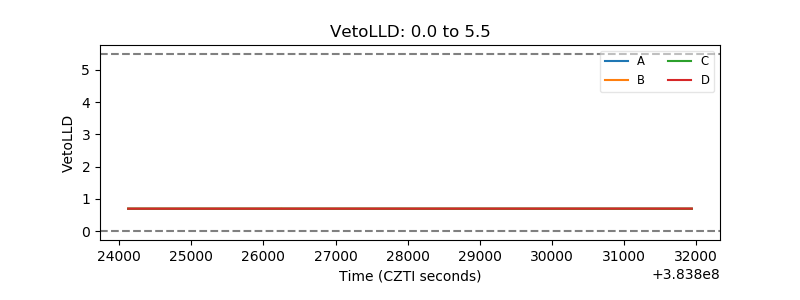 |
| Alpha Counter | 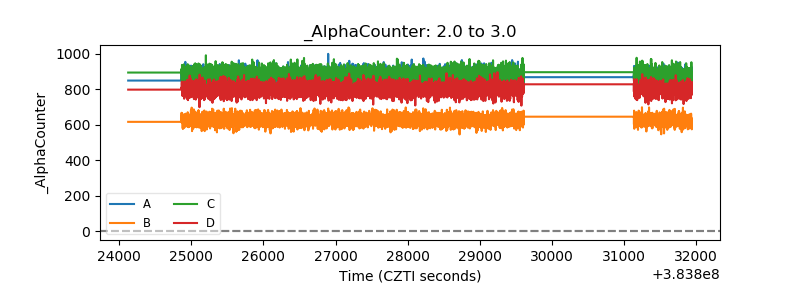 |
| _CPM_Rate | 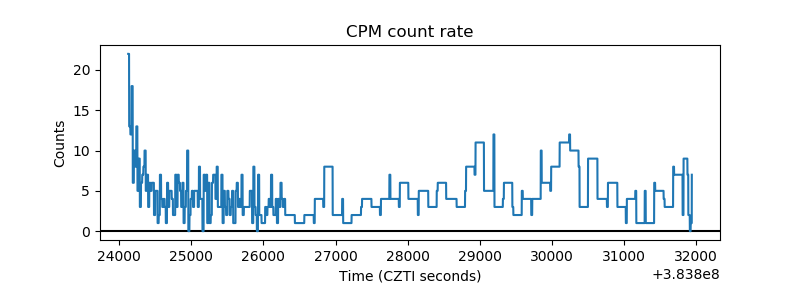 |
| CZT Counter | 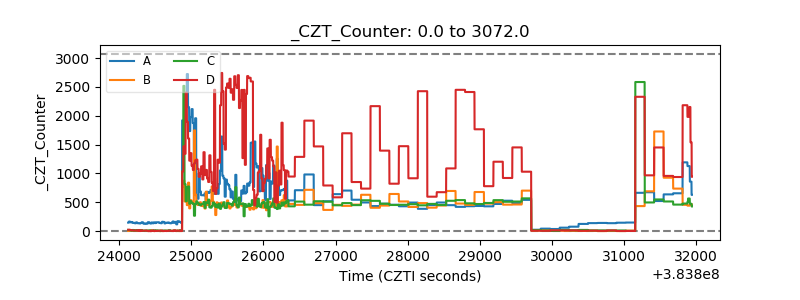 |
| +2.5 Volts monitor | 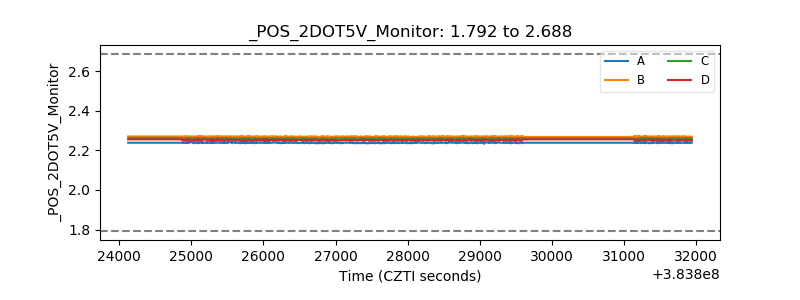 |
| +5 Volts monitor |  |
| _ROLL_ROT | 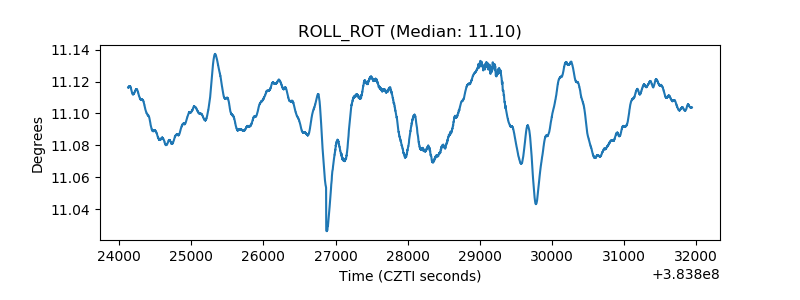 |
| _Roll_DEC | 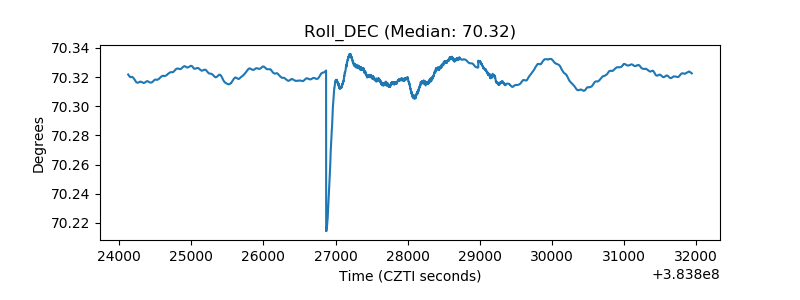 |
| _Roll_RA | 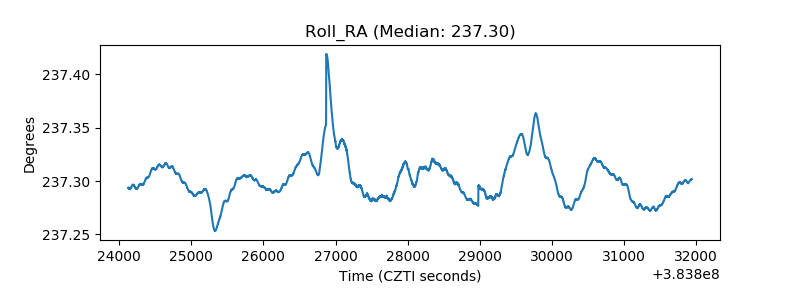 |
| Veto Counter | 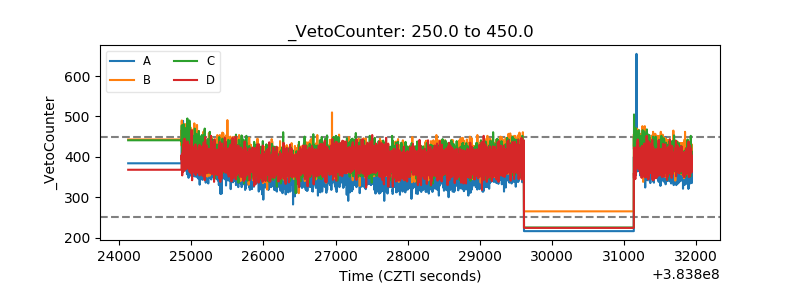 |