| Param | Original file | Final file |
|---|---|---|
| Filename | modeM0/AS1C07_001T01_9000004982_34729cztM0_level2.evt | modeM0/AS1C07_001T01_9000004982_34729cztM0_level2_quad_clean.evt |
| Size (bytes) | 602,164,800 | 84,424,320 |
| Size | 574.3 MB | 80.5 MB |
| Events in quadrant A | 7,098,430 | 532,296 |
| Events in quadrant B | 2,749,917 | 576,946 |
| Events in quadrant C | 2,893,917 | 569,906 |
| Events in quadrant D | 5,143,512 | 513,091 |
| Mode M0 | |||
|---|---|---|---|
| Quadrant | BADHDUFLAG | Total packets | Discarded packets |
| A | 0 | 24718 | 2 |
| B | 0 | 11558 | 1 |
| C | 0 | 11658 | 1 |
| D | 0 | 18897 | 1 |
| Mode SS | |||
|---|---|---|---|
| Quadrant | BADHDUFLAG | Total packets | Discarded packets |
| A | 0 | 104 | 0 |
| B | 0 | 104 | 0 |
| C | 0 | 104 | 0 |
| D | 0 | 104 | 0 |
| Mode M9 | |||
|---|---|---|---|
| Quadrant | BADHDUFLAG | Total packets | Discarded packets |
| A | 0 | 20 | 0 |
| B | 0 | 20 | 0 |
| C | 0 | 20 | 0 |
| D | 0 | 21 | 0 |
| Quadrant | Total seconds | Saturated seconds | Saturation percentage |
|---|---|---|---|
| A | 5200 | 1172 | 22.538462% |
| B | 5200 | 117 | 2.250000% |
| C | 5200 | 39 | 0.750000% |
| D | 5200 | 450 | 8.653846% |
Noise dominated data is calculated using 1-second bins in cleaned event files. If a bin has >2000 counts, and if more than 50% of those come from <1% of pixels, then it is considered to be noise-dominated and hence unusable.
| Quadrant | # 1 sec bins | Bins with >0 counts | Bins with >2000 counts | High rate bins dominated by noise | Noise dominated (total time) | Noise dominated (detector-on time) | Marked lightcurve |
|---|---|---|---|---|---|---|---|
| A | 7083 | 5201 | 933 | 933 | 13.17% | 17.94% | 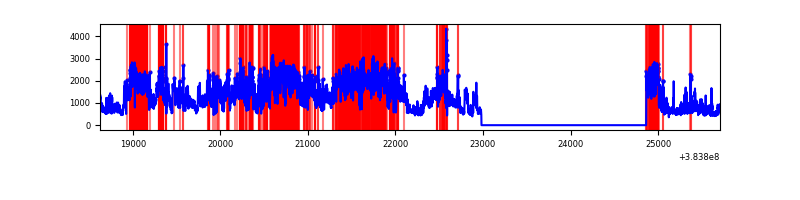 |
| B | 7083 | 5201 | 84 | 84 | 1.19% | 1.62% | 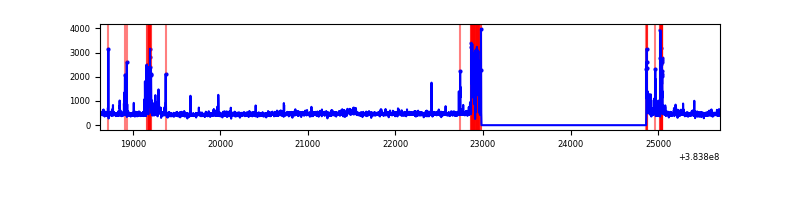 |
| C | 7083 | 5201 | 40 | 40 | 0.56% | 0.77% | 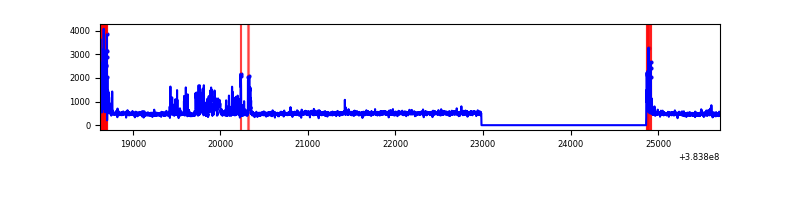 |
| D | 7083 | 5201 | 396 | 396 | 5.59% | 7.61% | 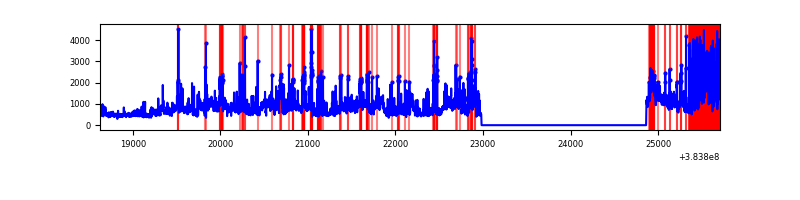 |
Top three noisy pixels from each quadrant. If the there are fewer than three noisy pixels in the level2.evt file, extra rows are filled as -1
| Pixel properties | Quadrant properties | ||||||
|---|---|---|---|---|---|---|---|
| Quadrant | DetID | PixID | Counts | Sigma | Mean | Median | Sigma |
| A | 15 | 169 | 4777642 | 42407.66 | 568 | 557 | 112.6 |
| A | 9 | 143 | 61673 | 542.55 | 568 | 557 | 112.6 |
| A | 10 | 83 | 46807 | 410.58 | 568 | 557 | 112.6 |
| B | 5 | 172 | 364093 | 3226.29 | 589 | 573 | 112.7 |
| B | 0 | 190 | 24195 | 209.65 | 589 | 573 | 112.7 |
| B | 4 | 232 | 13835 | 117.7 | 589 | 573 | 112.7 |
| C | 0 | 207 | 232083 | 1737.37 | 577 | 580 | 133.2 |
| C | 15 | 214 | 224198 | 1678.19 | 577 | 580 | 133.2 |
| C | 0 | 10 | 163626 | 1223.61 | 577 | 580 | 133.2 |
| D | 8 | 195 | 1426076 | 10406.94 | 560 | 544 | 137.0 |
| D | 2 | 249 | 691402 | 5043.53 | 560 | 544 | 137.0 |
| D | 10 | 118 | 333695 | 2432.13 | 560 | 544 | 137.0 |
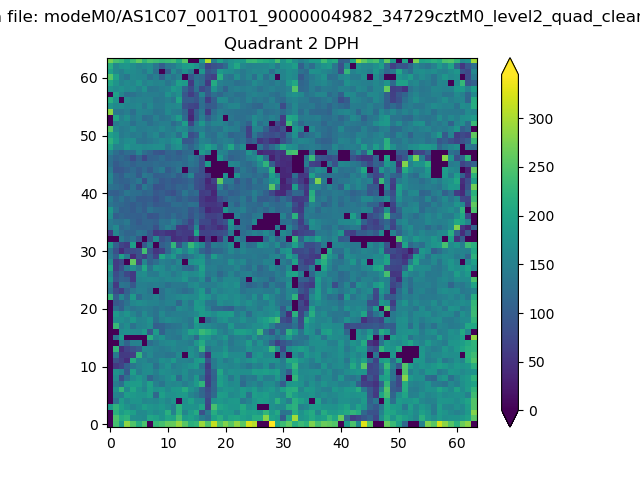
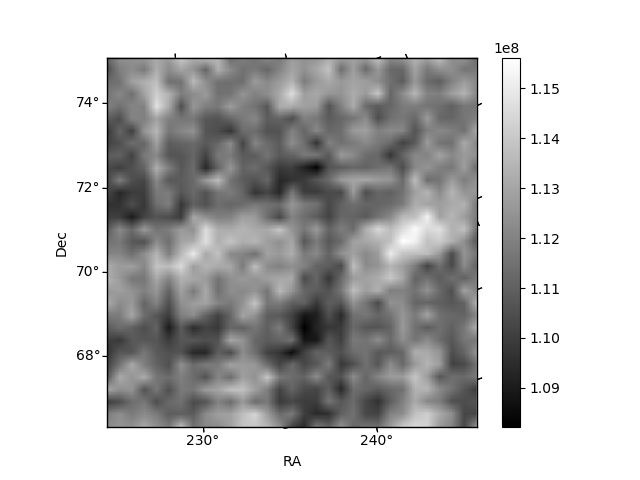
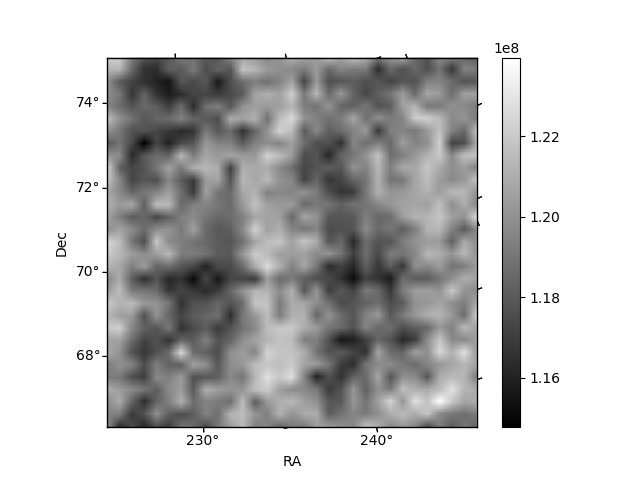
Histogram calculated using DETX and DETY for each event in the final _common_clean file
| Quadrant A | 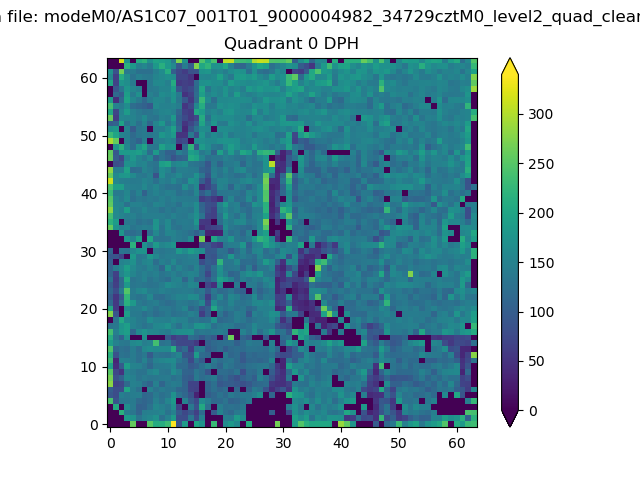 |
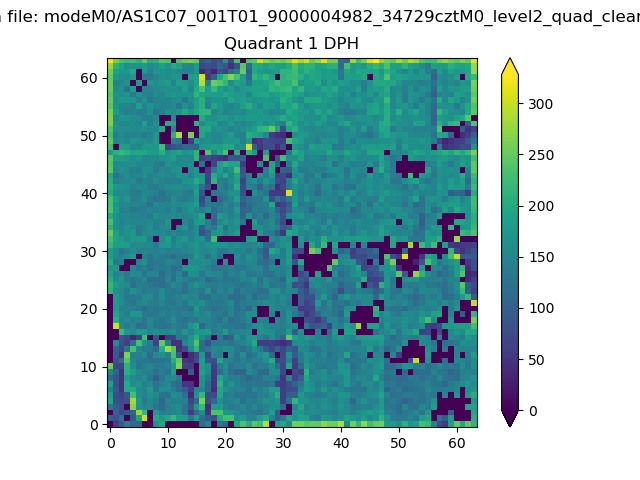 |
Quadrant B |
|---|---|---|---|
| Quadrant D | 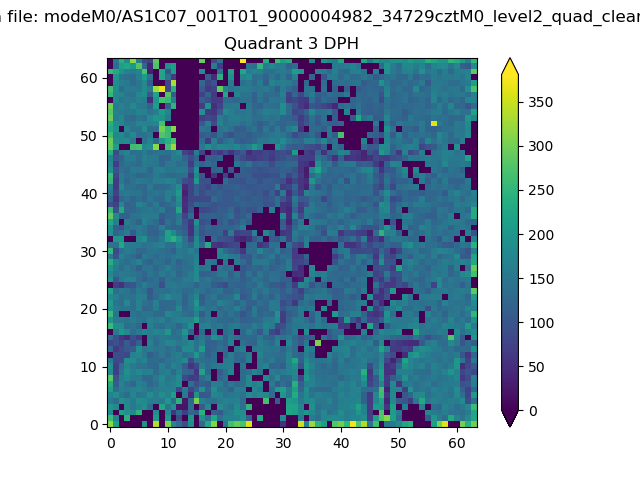 |
 |
Quadrant C |
| Plot type | Count rate plots | Images |
|---|---|---|
| Comparison with Poisson distribution Blue bars denote a histogram of data divided into 1 sec bins. Red curve is a Poisson curve with rate = median count rate of data. |
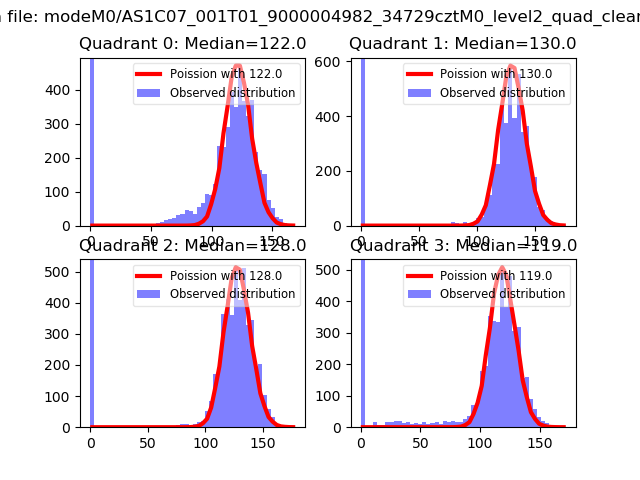 |
 |
| Quadrant-wise count rates Data is divided into 100 sec bins |
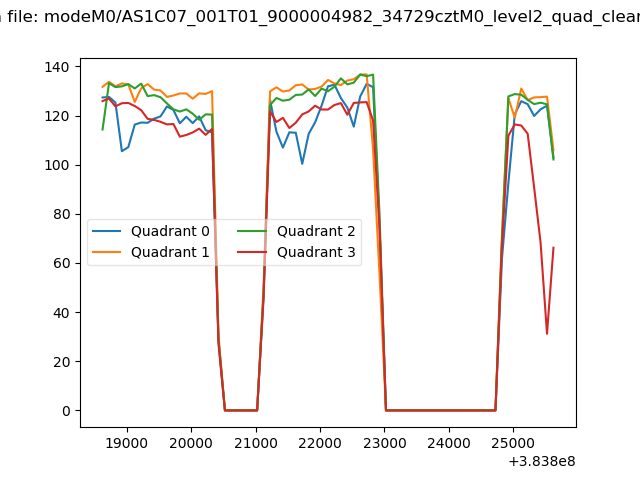 |
|
| Module-wise count rates for Quadrant A Data is divided into 100 sec bins |
 |
 |
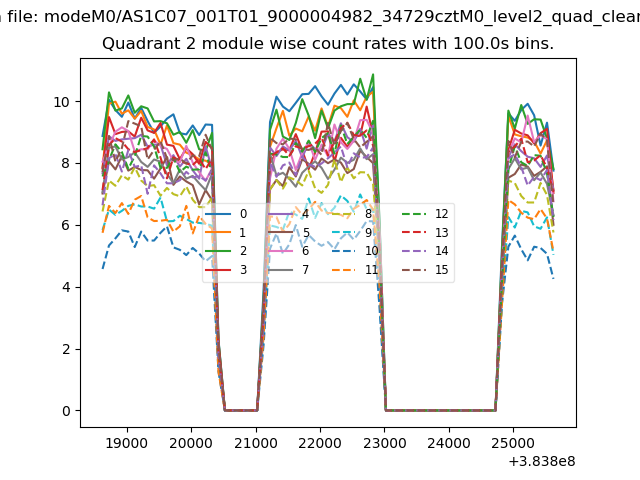
| Module-wise count rates for Quadrant B Data is divided into 100 sec bins |
 |
 |
| Module-wise count rates for Quadrant C Data is divided into 100 sec bins |
 |
 |
| Module-wise count rates for Quadrant D Data is divided into 100 sec bins |
 |
 |
| Parameter | Plot |
|---|---|
| CZT HV Monitor | 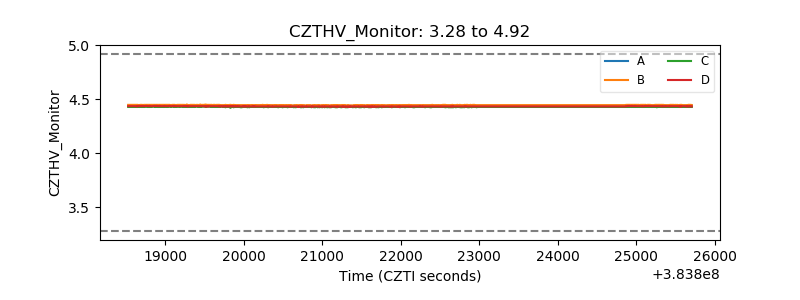 |
| D_VDD | 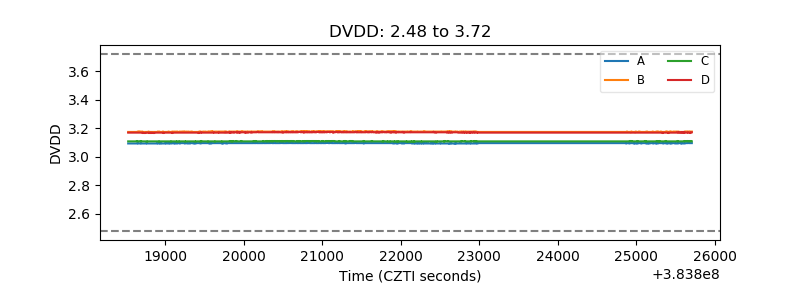 |
| Temperature 1 | 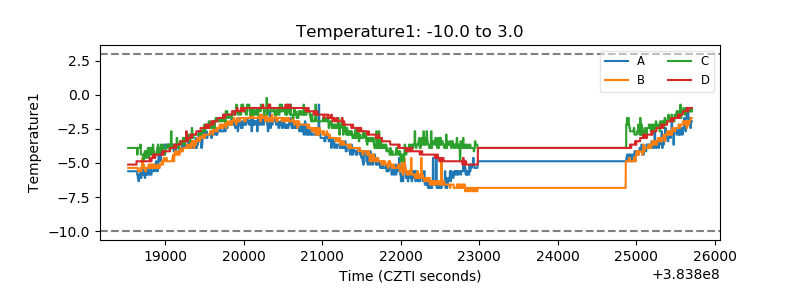 |
| Veto HV Monitor | 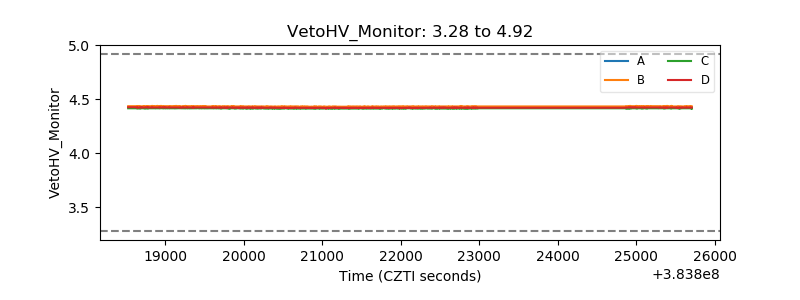 |
| Veto LLD | 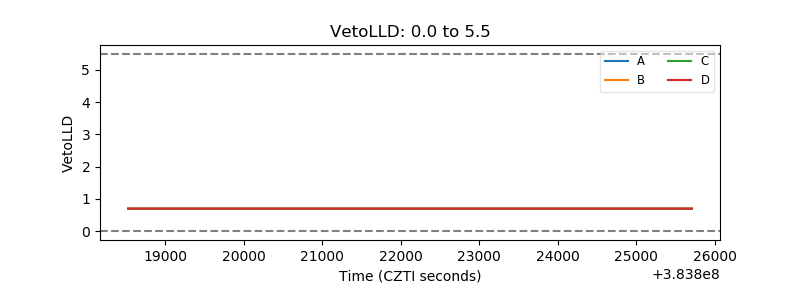 |
| Alpha Counter | 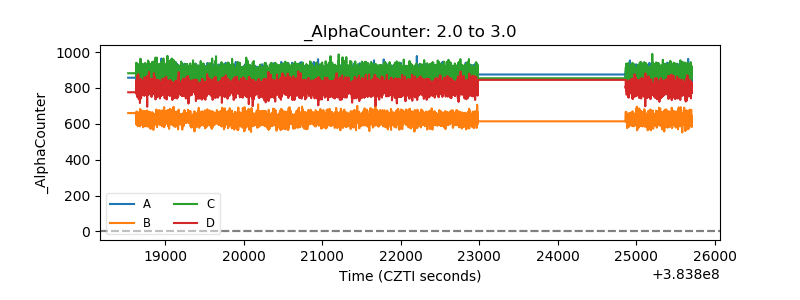 |
| _CPM_Rate | 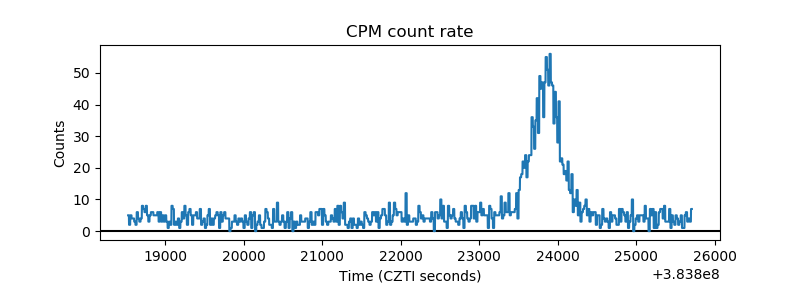 |
| CZT Counter | 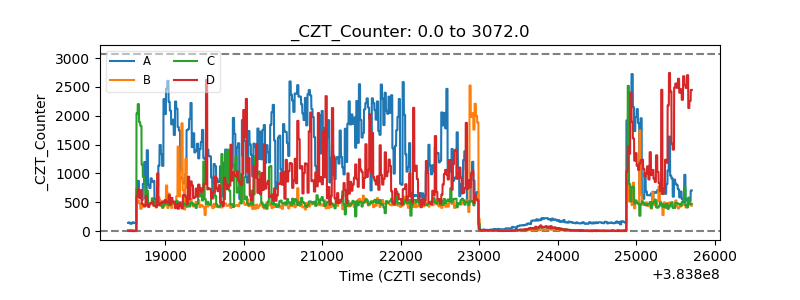 |
| +2.5 Volts monitor | 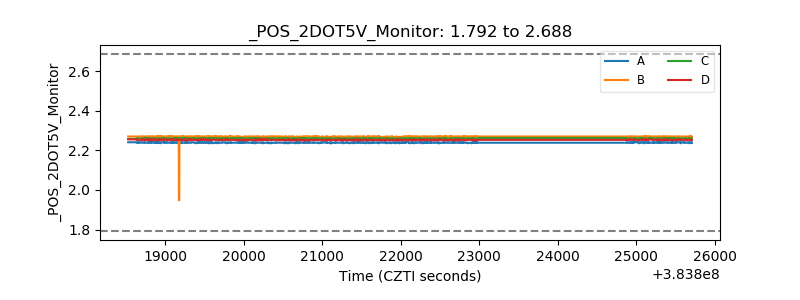 |
| +5 Volts monitor | 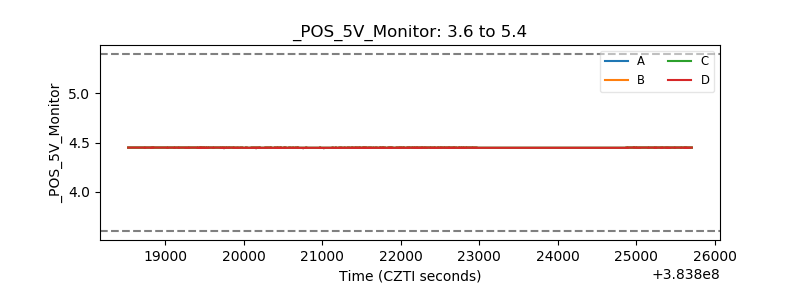 |
| _ROLL_ROT | 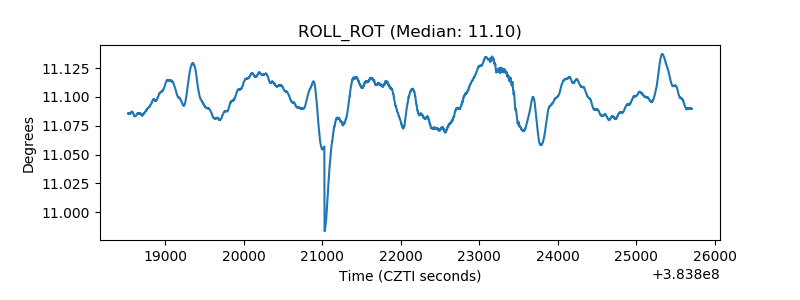 |
| _Roll_DEC | 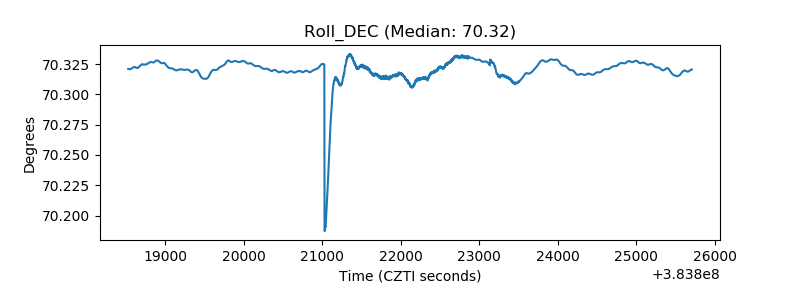 |
| _Roll_RA | 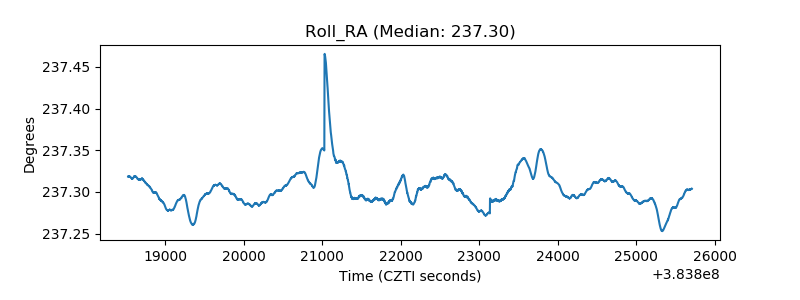 |
| Veto Counter | 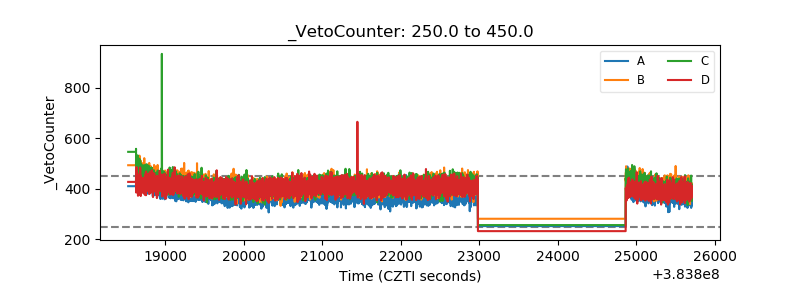 |