| Param | Original file | Final file |
|---|---|---|
| Filename | modeM0/AS1C07_001T01_9000004982_34728cztM0_level2.evt | modeM0/AS1C07_001T01_9000004982_34728cztM0_level2_quad_clean.evt |
| Size (bytes) | 1,160,461,440 | 222,094,080 |
| Size | 1.1 GB | 211.8 MB |
| Events in quadrant A | 8,450,404 | 1,481,016 |
| Events in quadrant B | 6,773,591 | 1,525,899 |
| Events in quadrant C | 6,695,355 | 1,485,931 |
| Events in quadrant D | 12,354,266 | 1,341,164 |
| Mode M0 | |||
|---|---|---|---|
| Quadrant | BADHDUFLAG | Total packets | Discarded packets |
| A | 0 | 33110 | 3 |
| B | 0 | 28007 | 2 |
| C | 0 | 27210 | 2 |
| D | 0 | 45784 | 2 |
| Mode SS | |||
|---|---|---|---|
| Quadrant | BADHDUFLAG | Total packets | Discarded packets |
| A | 0 | 262 | 0 |
| B | 0 | 262 | 0 |
| C | 0 | 262 | 0 |
| D | 0 | 262 | 0 |
| Mode M9 | |||
|---|---|---|---|
| Quadrant | BADHDUFLAG | Total packets | Discarded packets |
| A | 0 | 65 | 0 |
| B | 0 | 65 | 0 |
| C | 0 | 65 | 0 |
| D | 0 | 65 | 0 |
| Quadrant | Total seconds | Saturated seconds | Saturation percentage |
|---|---|---|---|
| A | 12929 | 449 | 3.472813% |
| B | 12929 | 107 | 0.827597% |
| C | 12929 | 66 | 0.510480% |
| D | 12929 | 998 | 7.719081% |
Noise dominated data is calculated using 1-second bins in cleaned event files. If a bin has >2000 counts, and if more than 50% of those come from <1% of pixels, then it is considered to be noise-dominated and hence unusable.
| Quadrant | # 1 sec bins | Bins with >0 counts | Bins with >2000 counts | High rate bins dominated by noise | Noise dominated (total time) | Noise dominated (detector-on time) | Marked lightcurve |
|---|---|---|---|---|---|---|---|
| A | 19300 | 12932 | 358 | 358 | 1.85% | 2.77% | 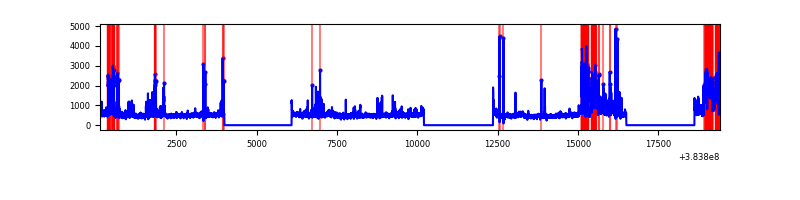 |
| B | 19300 | 12932 | 60 | 60 | 0.31% | 0.46% | 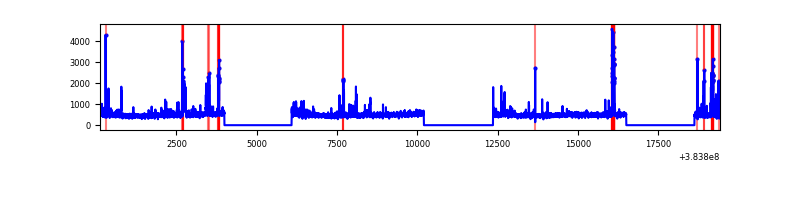 |
| C | 19300 | 12932 | 51 | 51 | 0.26% | 0.39% | 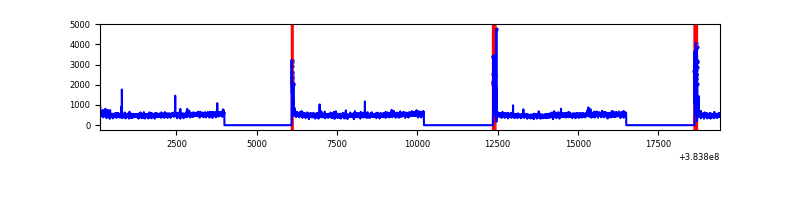 |
| D | 19300 | 12932 | 865 | 865 | 4.48% | 6.69% | 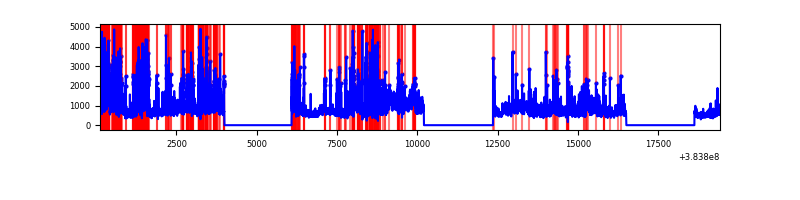 |
Top three noisy pixels from each quadrant. If the there are fewer than three noisy pixels in the level2.evt file, extra rows are filled as -1
| Pixel properties | Quadrant properties | ||||||
|---|---|---|---|---|---|---|---|
| Quadrant | DetID | PixID | Counts | Sigma | Mean | Median | Sigma |
| A | 15 | 169 | 2188331 | 7218.97 | 1542 | 1515 | 302.9 |
| A | 7 | 48 | 118051 | 384.7 | 1542 | 1515 | 302.9 |
| A | 10 | 83 | 85991 | 278.86 | 1542 | 1515 | 302.9 |
| B | 5 | 172 | 504155 | 1775.2 | 1536 | 1499 | 283.2 |
| B | 5 | 255 | 71969 | 248.88 | 1536 | 1499 | 283.2 |
| B | 0 | 155 | 36958 | 125.23 | 1536 | 1499 | 283.2 |
| C | 15 | 214 | 547445 | 1631.67 | 1484 | 1494 | 334.6 |
| C | 0 | 10 | 244739 | 726.98 | 1484 | 1494 | 334.6 |
| C | 14 | 67 | 78328 | 229.63 | 1484 | 1494 | 334.6 |
| D | 8 | 195 | 2157364 | 6258.56 | 1446 | 1410 | 344.5 |
| D | 2 | 250 | 1637680 | 4749.96 | 1446 | 1410 | 344.5 |
| D | 14 | 52 | 591839 | 1713.97 | 1446 | 1410 | 344.5 |
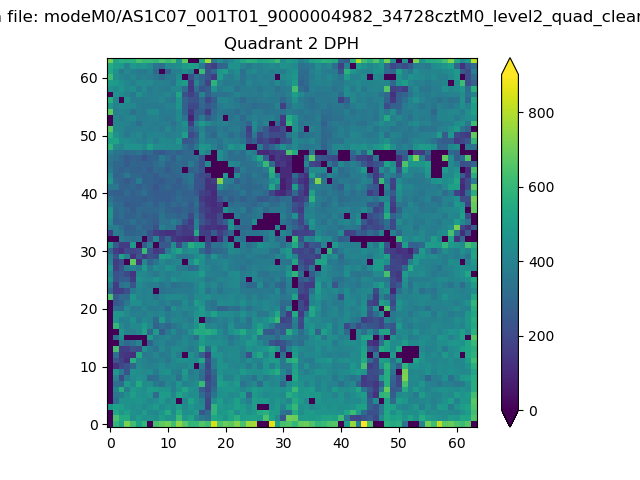
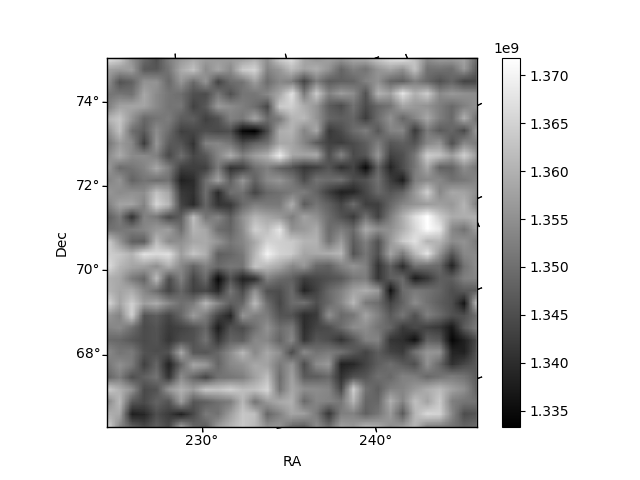
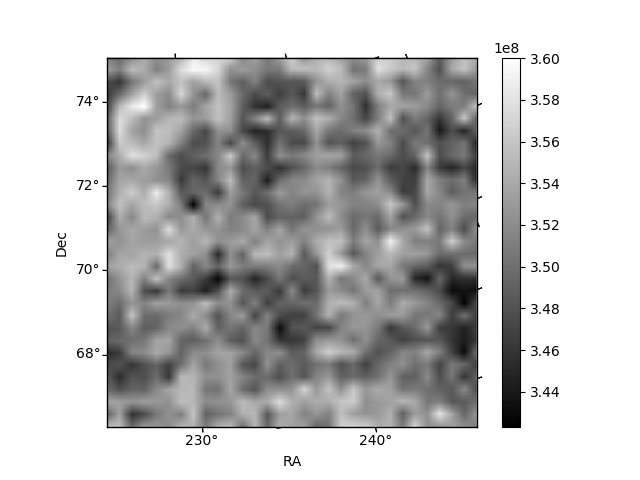
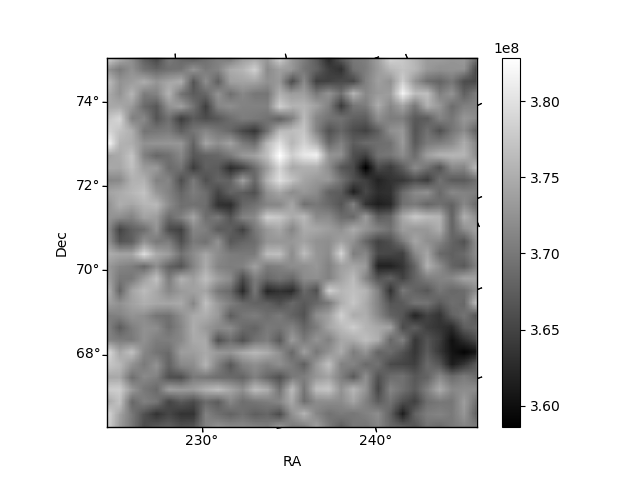
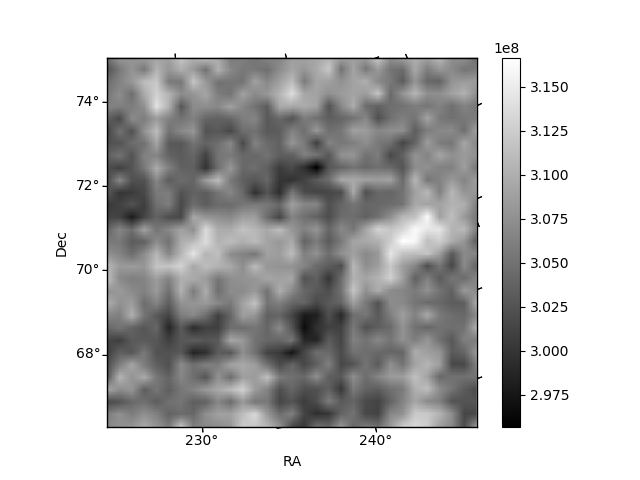
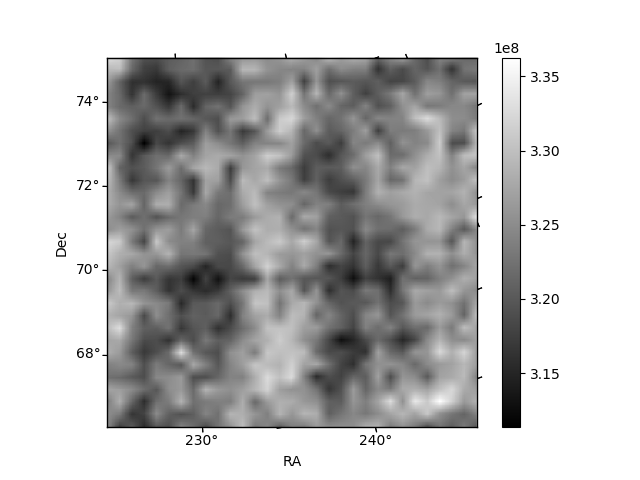
Histogram calculated using DETX and DETY for each event in the final _common_clean file
| Quadrant A | 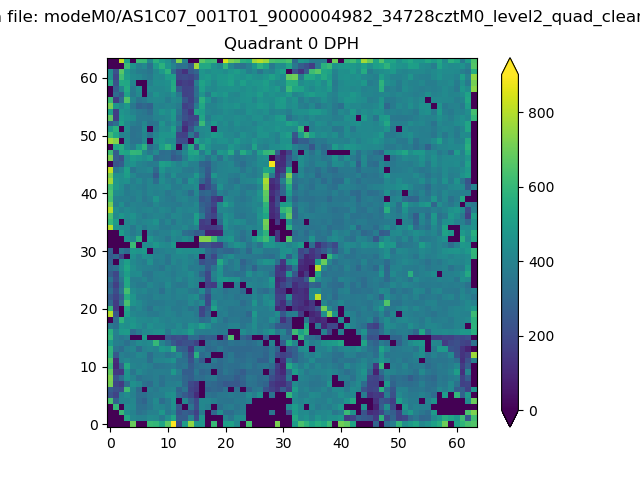 |
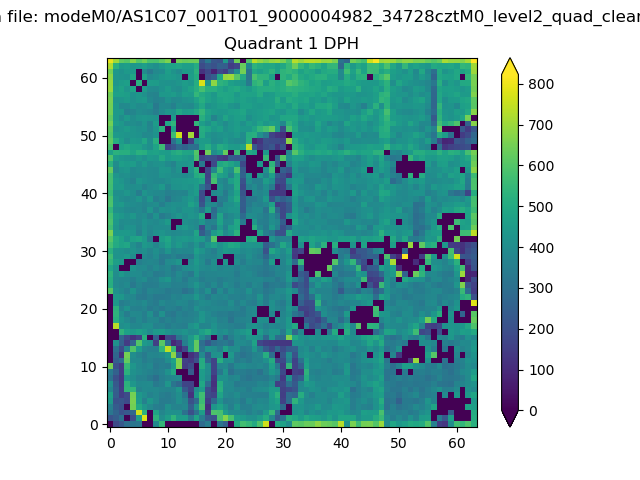 |
Quadrant B |
|---|---|---|---|
| Quadrant D | 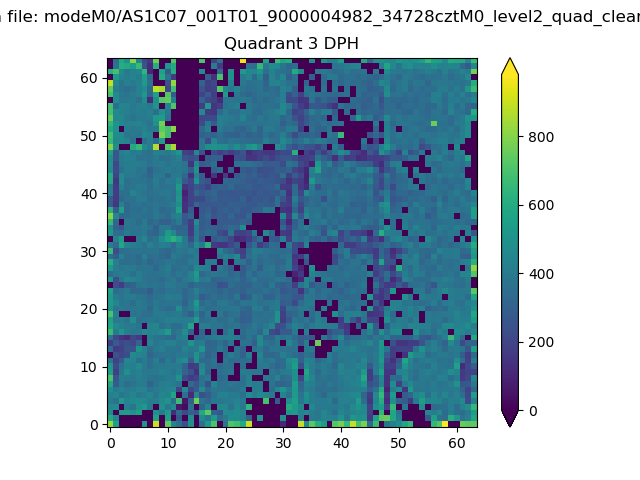 |
 |
Quadrant C |
| Plot type | Count rate plots | Images |
|---|---|---|
| Comparison with Poisson distribution Blue bars denote a histogram of data divided into 1 sec bins. Red curve is a Poisson curve with rate = median count rate of data. |
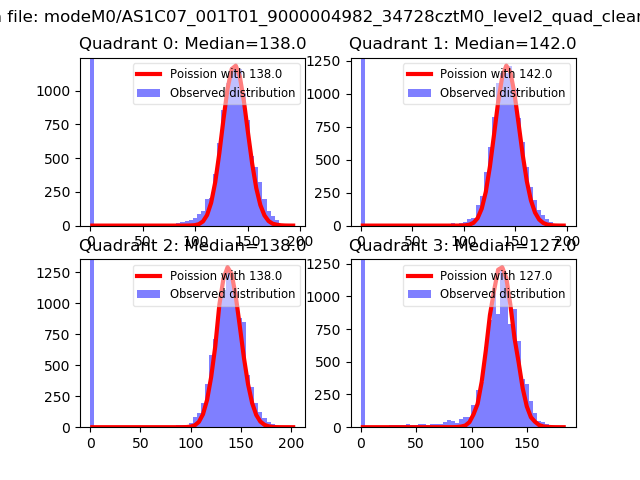 |
 |
| Quadrant-wise count rates Data is divided into 100 sec bins |
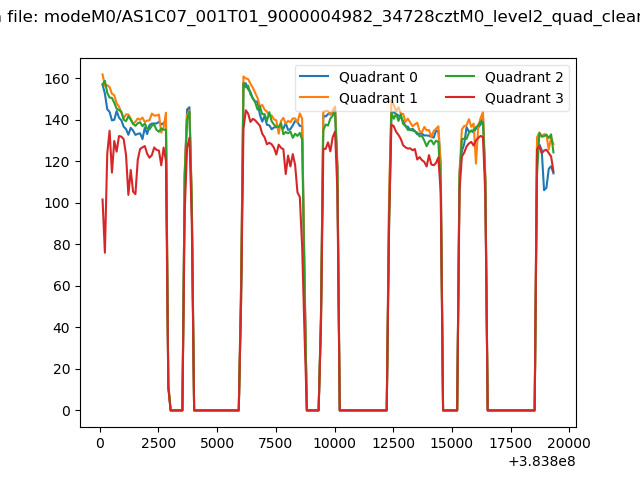 |
|
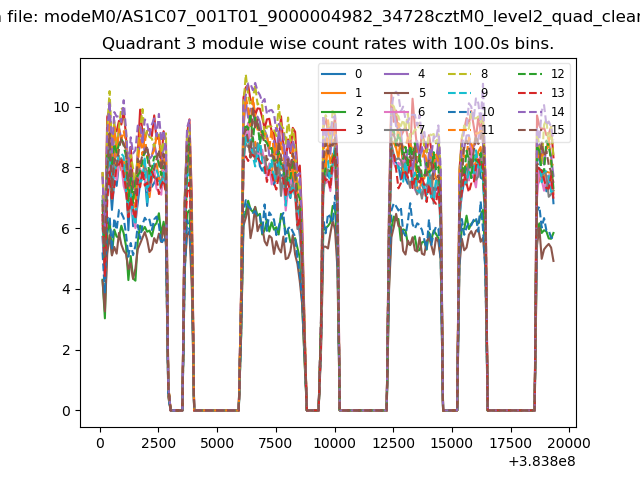
| Module-wise count rates for Quadrant A Data is divided into 100 sec bins |
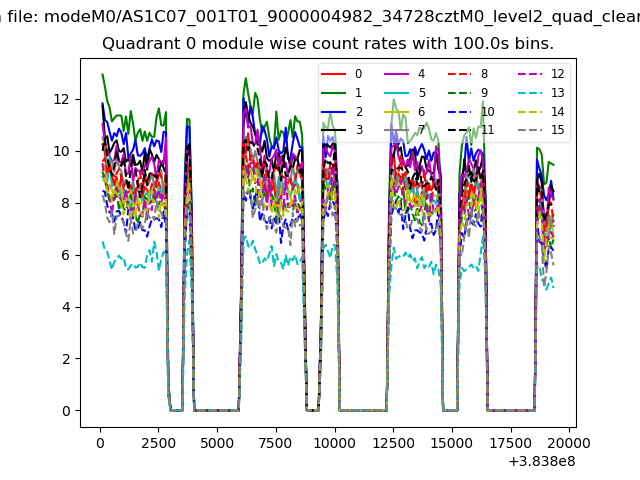 |
 |
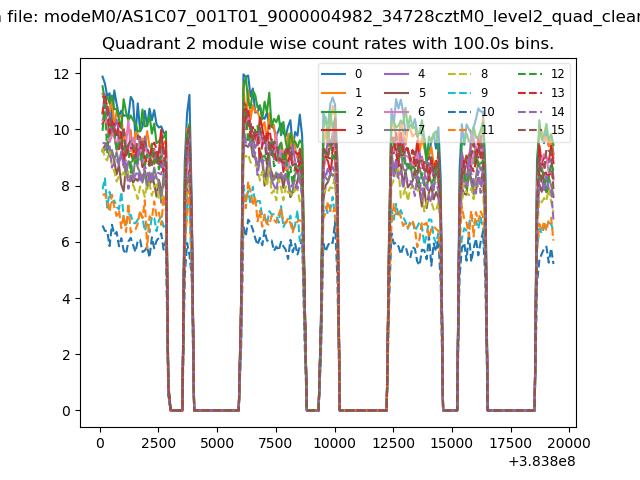
| Module-wise count rates for Quadrant B Data is divided into 100 sec bins |
 |
 |
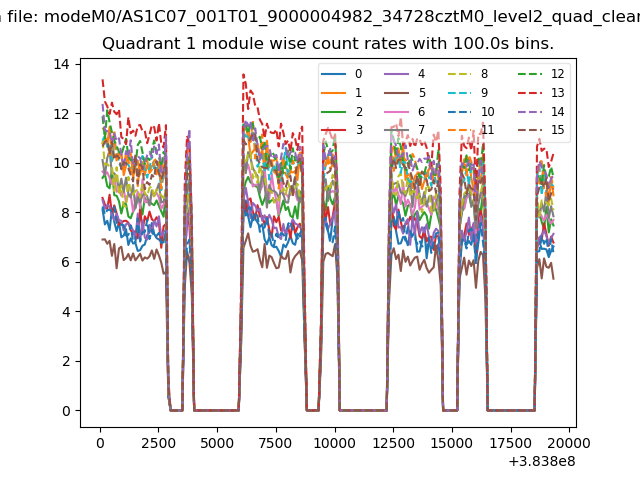
| Module-wise count rates for Quadrant C Data is divided into 100 sec bins |
 |
 |
| Module-wise count rates for Quadrant D Data is divided into 100 sec bins |
 |
 |
| Parameter | Plot |
|---|---|
| CZT HV Monitor |  |
| D_VDD | 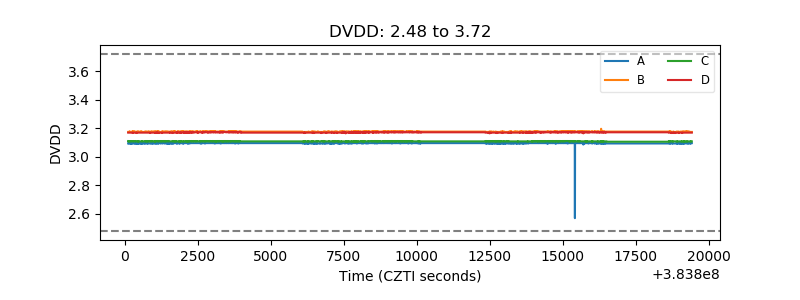 |
| Temperature 1 | 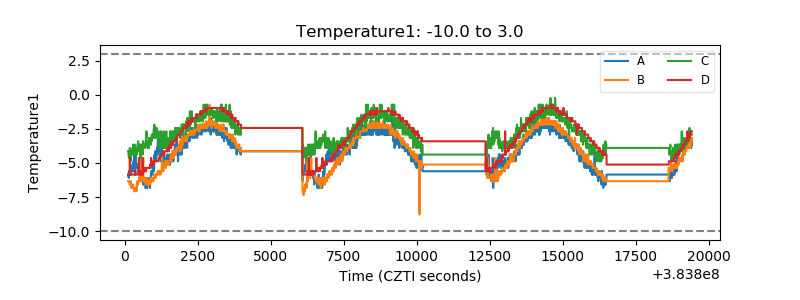 |
| Veto HV Monitor | 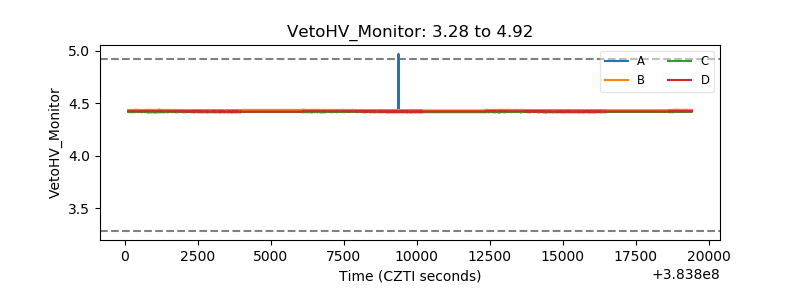 |
| Veto LLD | 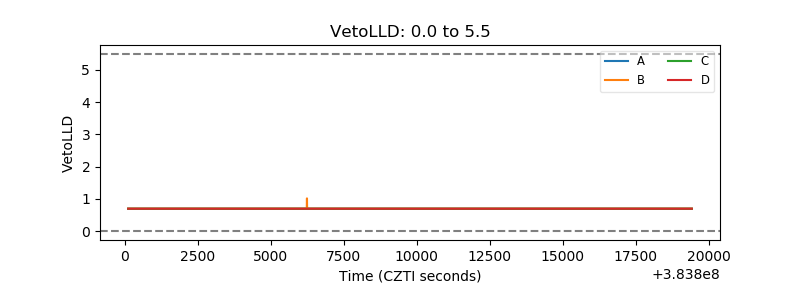 |
| Alpha Counter | 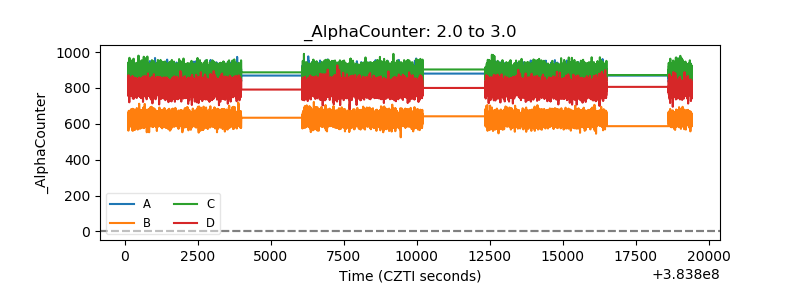 |
| _CPM_Rate | 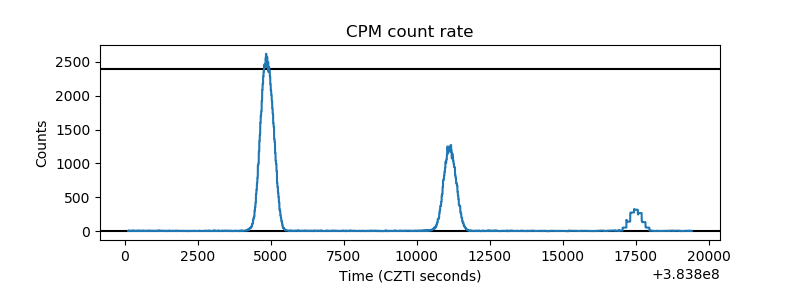 |
| CZT Counter | 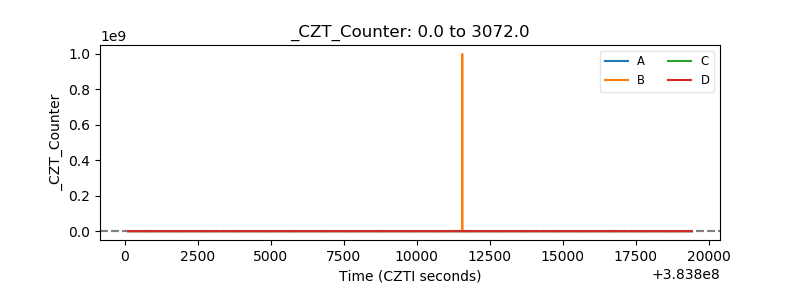 |
| +2.5 Volts monitor | 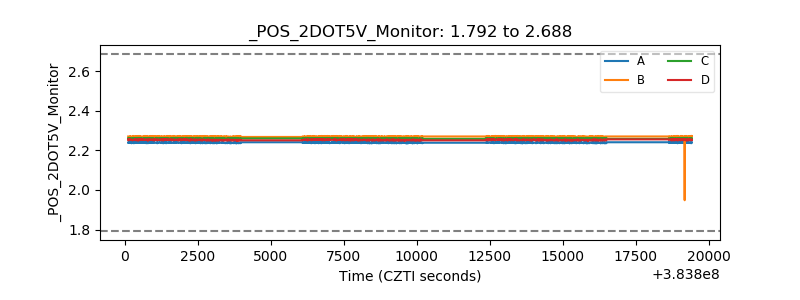 |
| +5 Volts monitor | 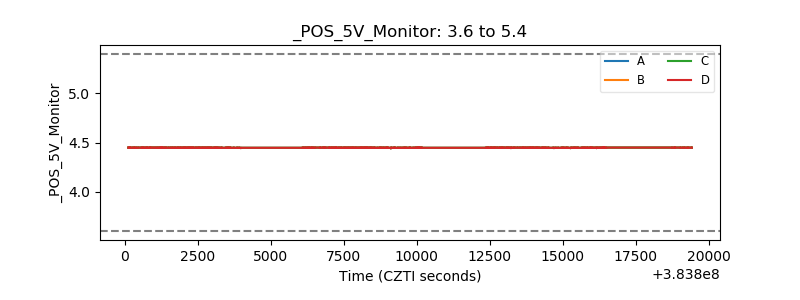 |
| _ROLL_ROT | 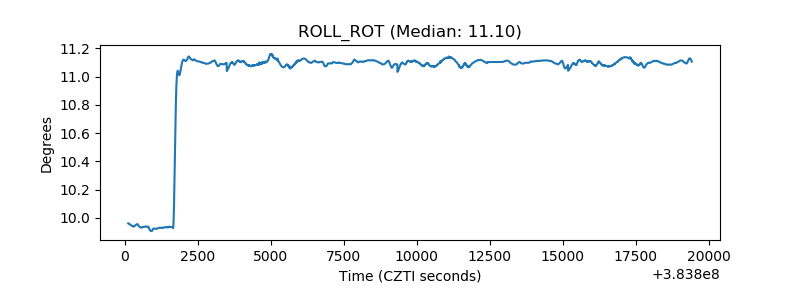 |
| _Roll_DEC | 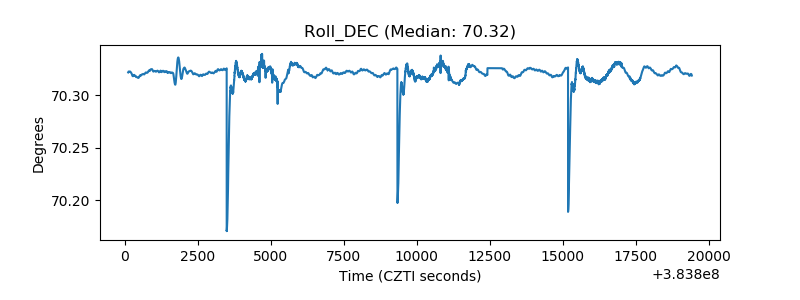 |
| _Roll_RA | 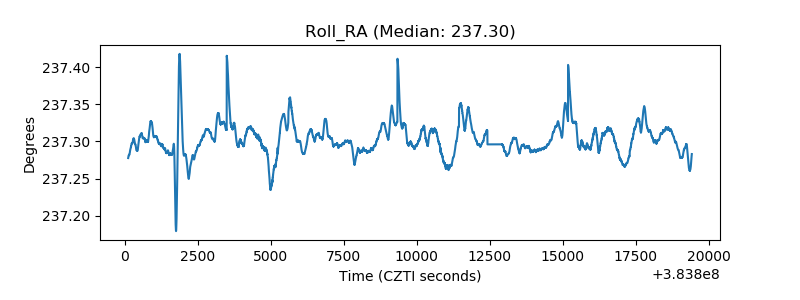 |
| Veto Counter | 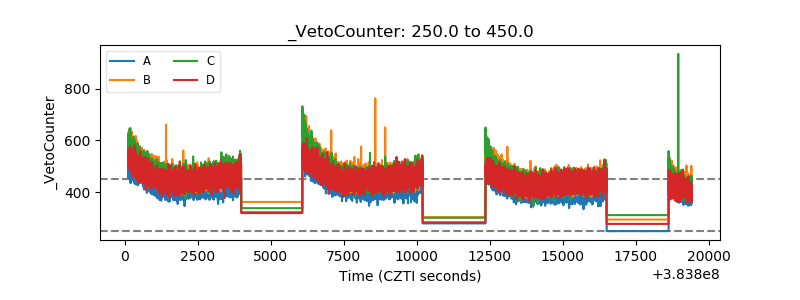 |