| Param | Original file | Final file |
|---|---|---|
| Filename | modeM0/AS1C07_001T01_9000004982_34726cztM0_level2.evt | modeM0/AS1C07_001T01_9000004982_34726cztM0_level2_quad_clean.evt |
| Size (bytes) | 423,504,000 | 86,304,960 |
| Size | 403.9 MB | 82.3 MB |
| Events in quadrant A | 2,795,608 | 587,220 |
| Events in quadrant B | 2,405,015 | 602,725 |
| Events in quadrant C | 2,465,383 | 595,594 |
| Events in quadrant D | 4,848,292 | 505,931 |
| Mode M0 | |||
|---|---|---|---|
| Quadrant | BADHDUFLAG | Total packets | Discarded packets |
| A | 0 | 12044 | 938 |
| B | 0 | 11340 | 1371 |
| C | 0 | 10830 | 886 |
| D | 0 | 20396 | 2787 |
| Mode SS | |||
|---|---|---|---|
| Quadrant | BADHDUFLAG | Total packets | Discarded packets |
| A | 0 | 104 | 4 |
| B | 0 | 103 | 9 |
| C | 0 | 104 | 4 |
| D | 0 | 104 | 12 |
| Mode M9 | |||
|---|---|---|---|
| Quadrant | BADHDUFLAG | Total packets | Discarded packets |
| A | 0 | 28 | 0 |
| B | 0 | 28 | 0 |
| C | 0 | 28 | 0 |
| D | 0 | 29 | 0 |
| Quadrant | Total seconds | Saturated seconds | Saturation percentage |
|---|---|---|---|
| A | 4617 | 69 | 1.494477% |
| B | 4572 | 27 | 0.590551% |
| C | 4639 | 31 | 0.668247% |
| D | 4453 | 612 | 13.743544% |
Noise dominated data is calculated using 1-second bins in cleaned event files. If a bin has >2000 counts, and if more than 50% of those come from <1% of pixels, then it is considered to be noise-dominated and hence unusable.
| Quadrant | # 1 sec bins | Bins with >0 counts | Bins with >2000 counts | High rate bins dominated by noise | Noise dominated (total time) | Noise dominated (detector-on time) | Marked lightcurve |
|---|---|---|---|---|---|---|---|
| A | 7163 | 4830 | 52 | 52 | 0.73% | 1.08% | 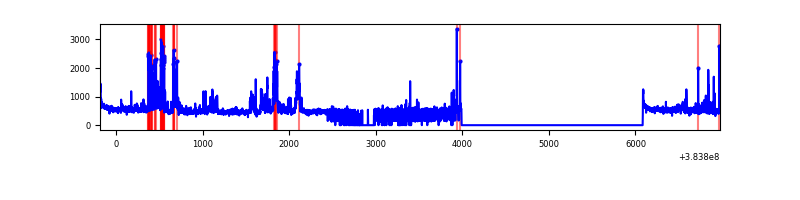 |
| B | 7163 | 4788 | 10 | 10 | 0.14% | 0.21% | 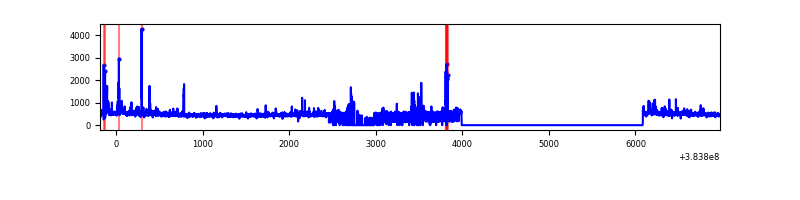 |
| C | 7163 | 4820 | 21 | 21 | 0.29% | 0.44% | 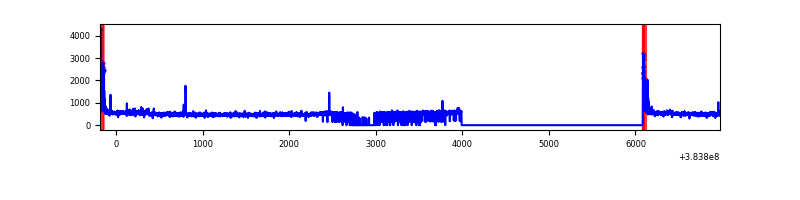 |
| D | 7163 | 4696 | 565 | 565 | 7.89% | 12.03% | 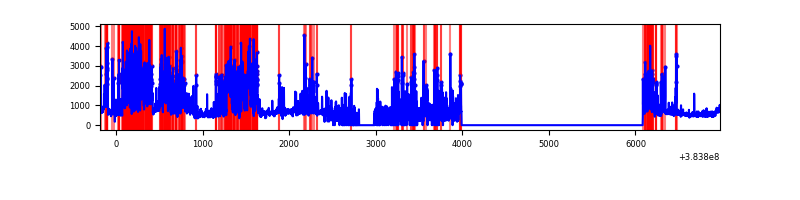 |
Top three noisy pixels from each quadrant. If the there are fewer than three noisy pixels in the level2.evt file, extra rows are filled as -1
| Pixel properties | Quadrant properties | ||||||
|---|---|---|---|---|---|---|---|
| Quadrant | DetID | PixID | Counts | Sigma | Mean | Median | Sigma |
| A | 15 | 169 | 511664 | 4606.85 | 558 | 549 | 110.9 |
| A | 10 | 83 | 46686 | 415.85 | 558 | 549 | 110.9 |
| A | 7 | 48 | 40058 | 356.11 | 558 | 549 | 110.9 |
| B | 5 | 172 | 105528 | 1020.93 | 552 | 540 | 102.8 |
| B | 5 | 255 | 48070 | 462.19 | 552 | 540 | 102.8 |
| B | 0 | 155 | 27006 | 257.36 | 552 | 540 | 102.8 |
| C | 15 | 214 | 201204 | 1634.25 | 539 | 544 | 122.8 |
| C | 0 | 10 | 110071 | 892.03 | 539 | 544 | 122.8 |
| C | 14 | 67 | 32413 | 259.55 | 539 | 544 | 122.8 |
| D | 2 | 250 | 1521709 | 13018.77 | 487 | 474 | 116.8 |
| D | 8 | 195 | 539125 | 4609.79 | 487 | 474 | 116.8 |
| D | 2 | 249 | 299949 | 2562.92 | 487 | 474 | 116.8 |
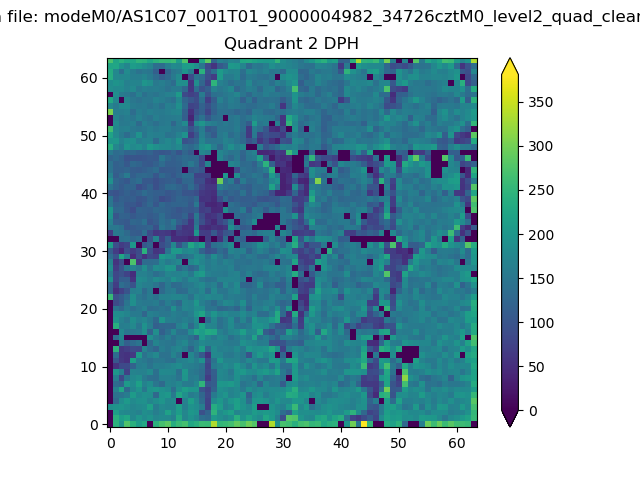
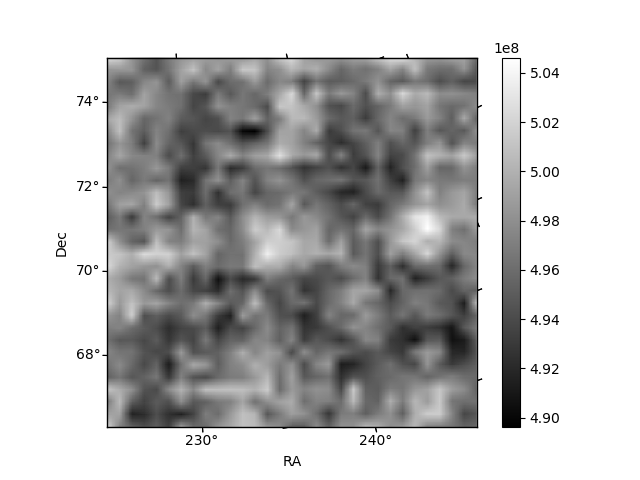
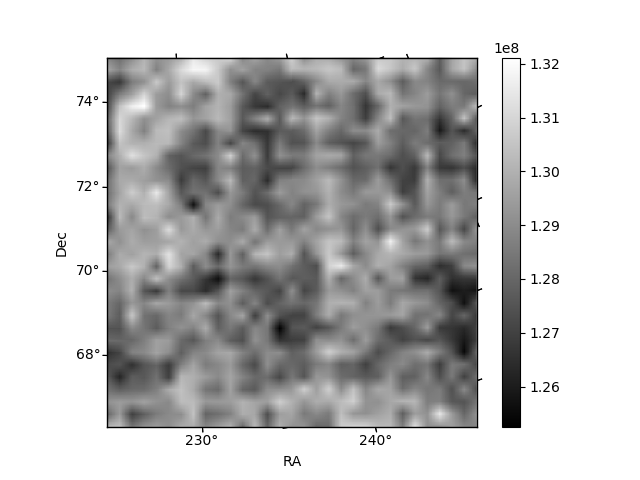
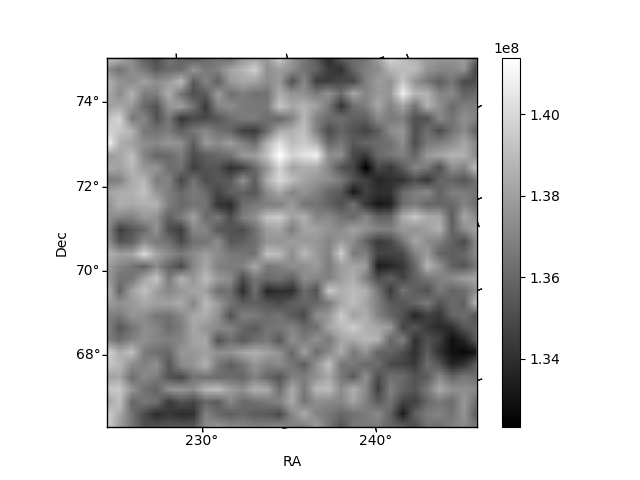
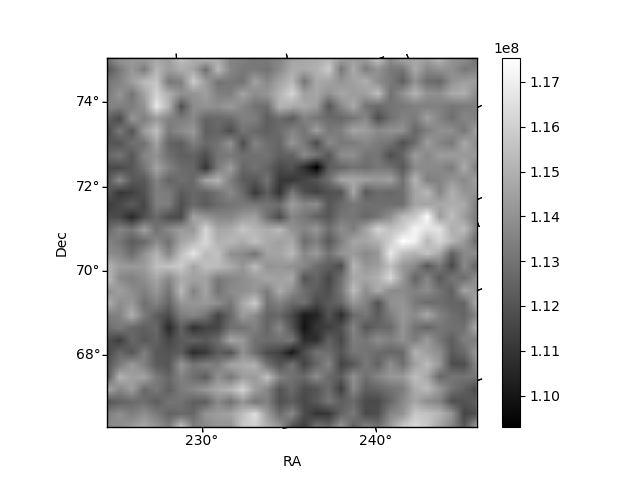
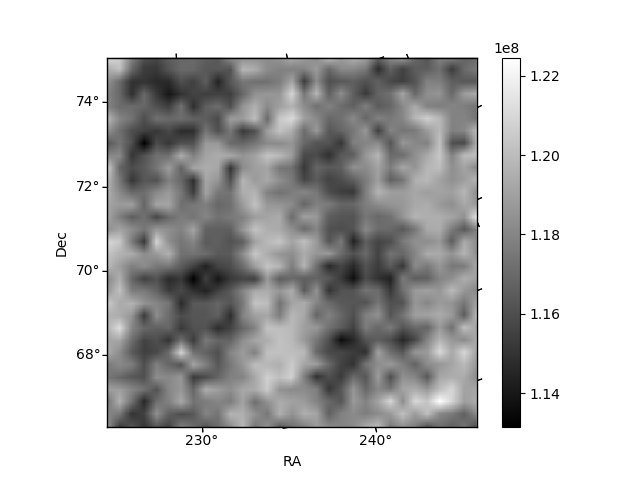
Histogram calculated using DETX and DETY for each event in the final _common_clean file
| Quadrant A | 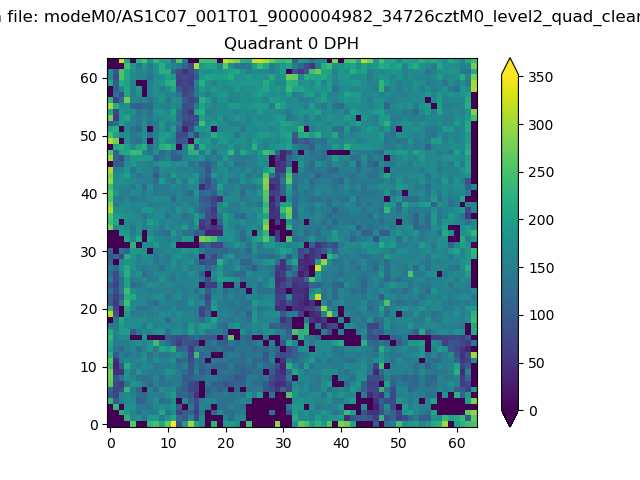 |
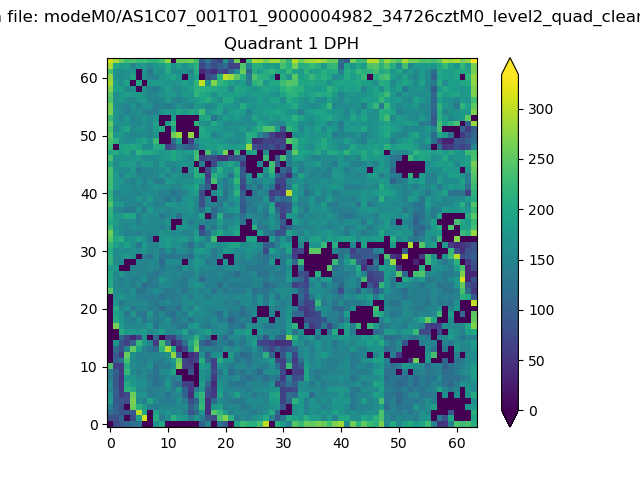 |
Quadrant B |
|---|---|---|---|
| Quadrant D | 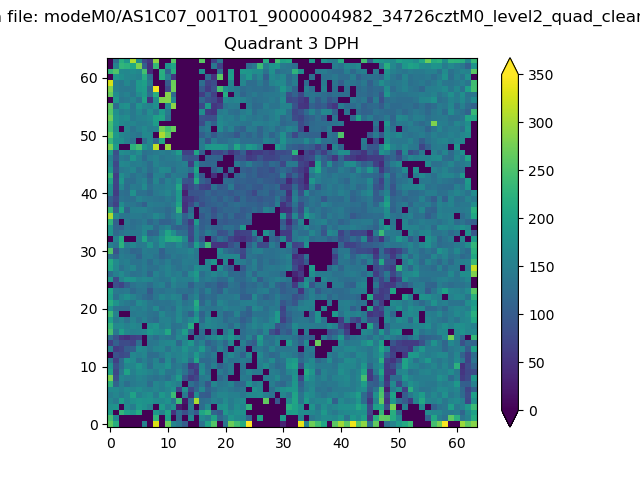 |
 |
Quadrant C |
| Plot type | Count rate plots | Images |
|---|---|---|
| Comparison with Poisson distribution Blue bars denote a histogram of data divided into 1 sec bins. Red curve is a Poisson curve with rate = median count rate of data. |
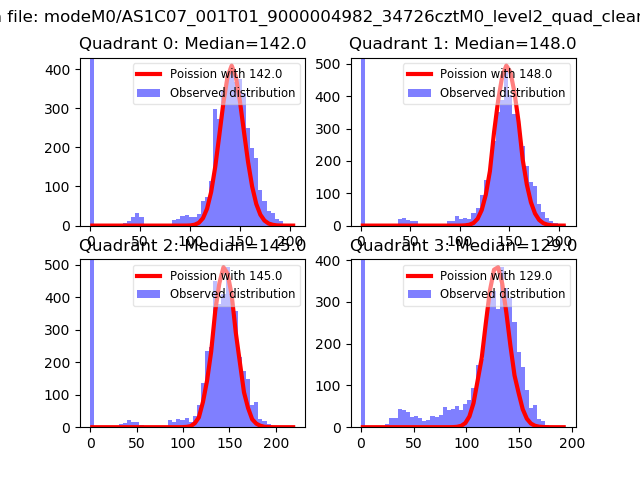 |
 |
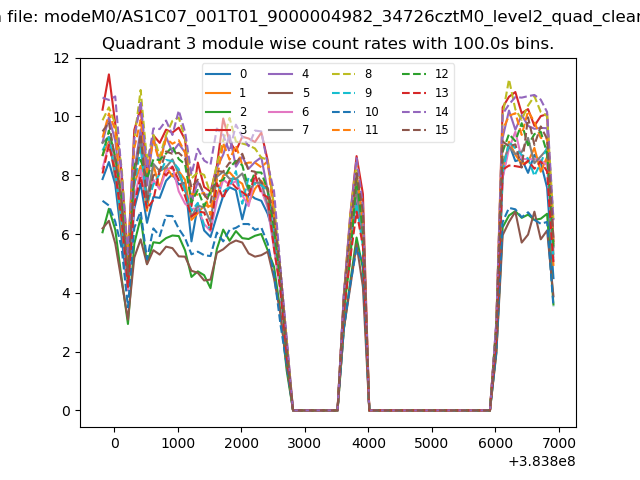
| Quadrant-wise count rates Data is divided into 100 sec bins |
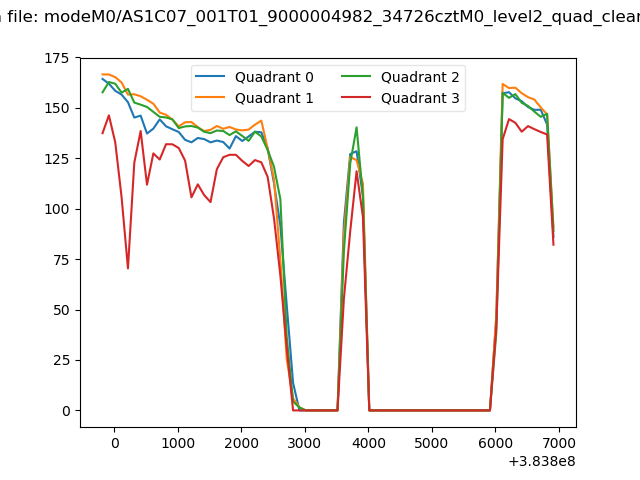 |
|
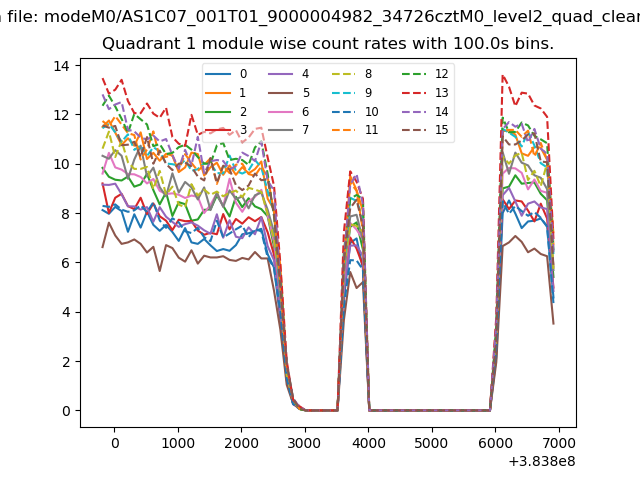
| Module-wise count rates for Quadrant A Data is divided into 100 sec bins |
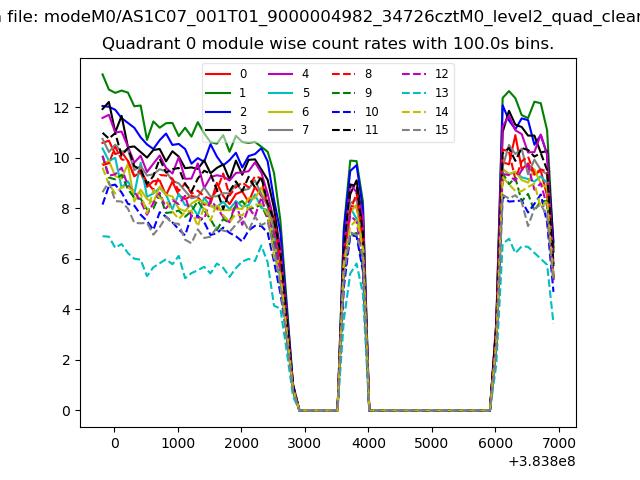 |
 |
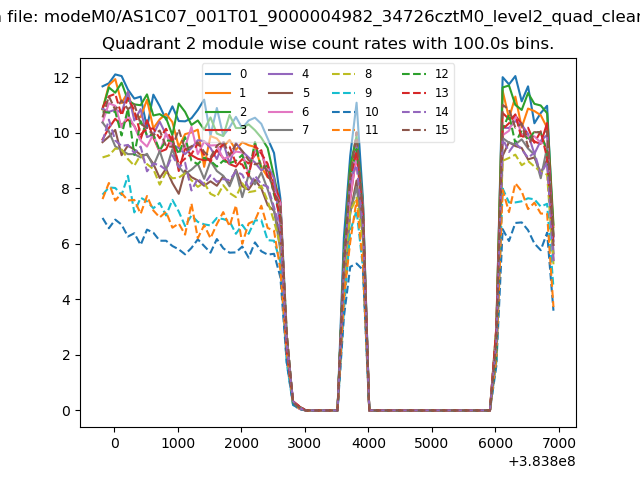
| Module-wise count rates for Quadrant B Data is divided into 100 sec bins |
 |
 |
| Module-wise count rates for Quadrant C Data is divided into 100 sec bins |
 |
 |
| Module-wise count rates for Quadrant D Data is divided into 100 sec bins |
 |
 |
| Parameter | Plot |
|---|---|
| CZT HV Monitor | 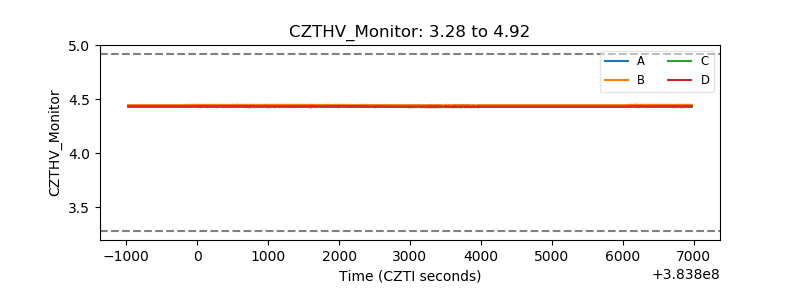 |
| D_VDD | 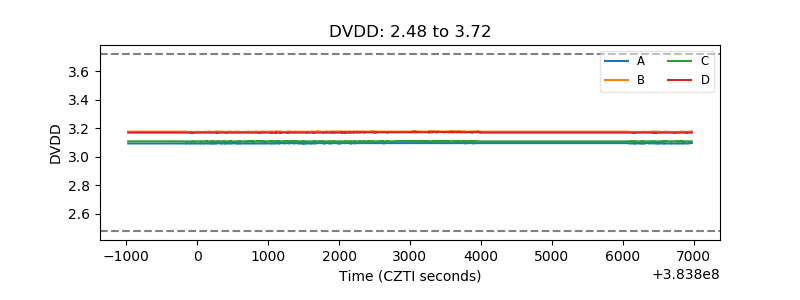 |
| Temperature 1 | 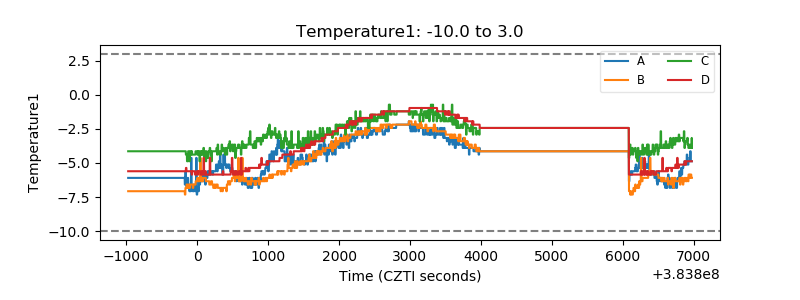 |
| Veto HV Monitor |  |
| Veto LLD | 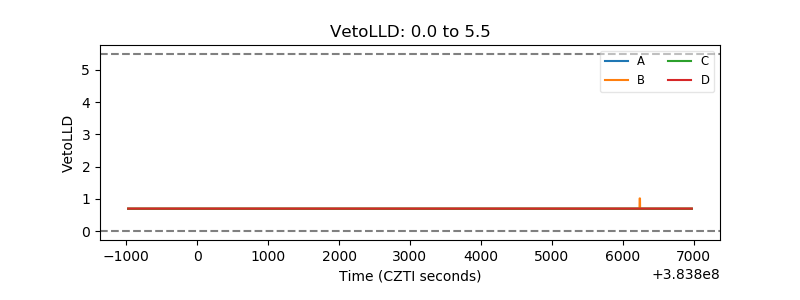 |
| Alpha Counter | 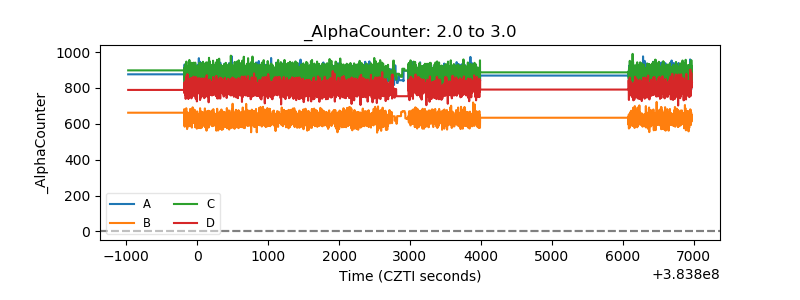 |
| _CPM_Rate | 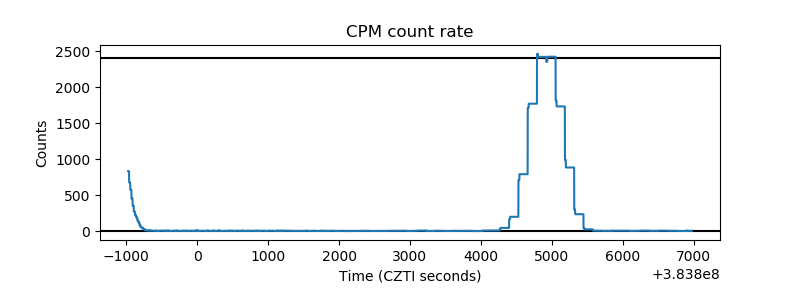 |
| CZT Counter | 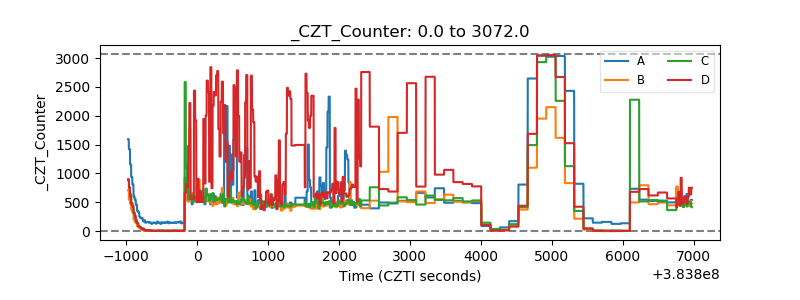 |
| +2.5 Volts monitor | 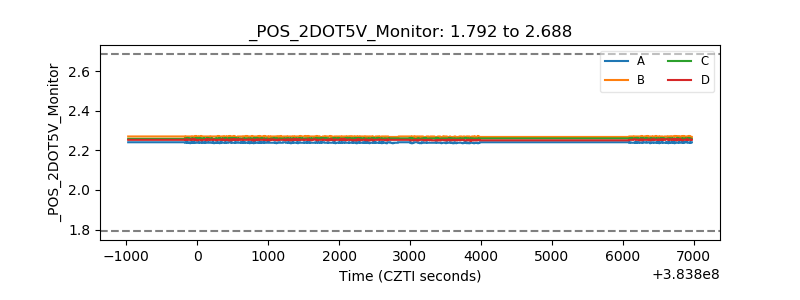 |
| +5 Volts monitor |  |
| _ROLL_ROT | 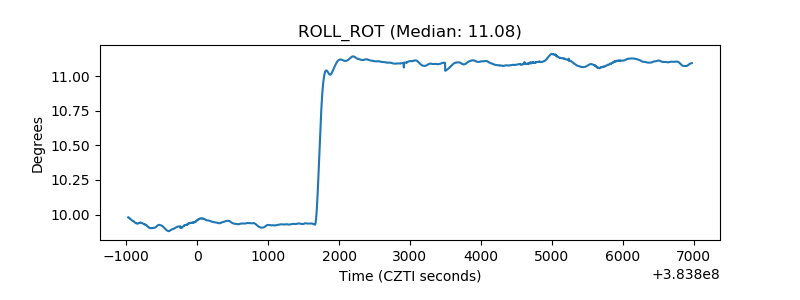 |
| _Roll_DEC | 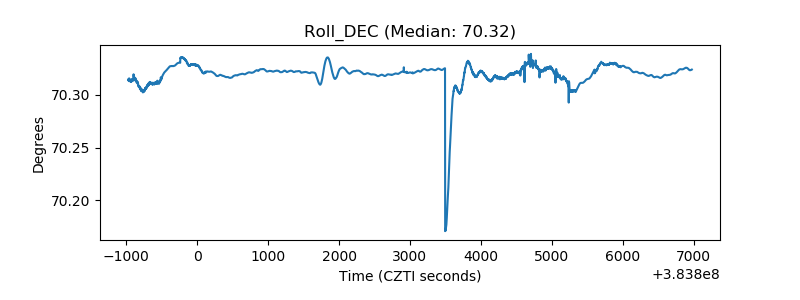 |
| _Roll_RA |  |
| Veto Counter | 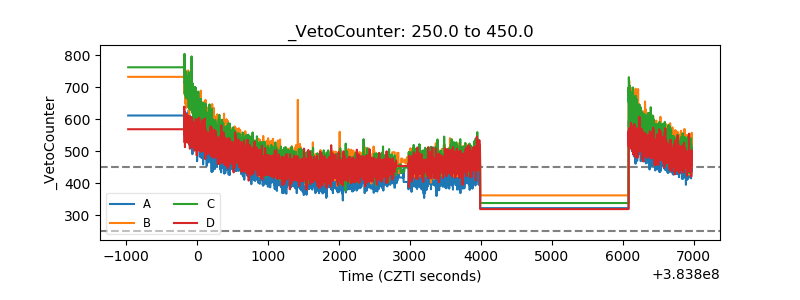 |