| Param | Original file | Final file |
|---|---|---|
| Filename | modeM0/AS1C07_001T01_9000004982_34725cztM0_level2.evt | modeM0/AS1C07_001T01_9000004982_34725cztM0_level2_quad_clean.evt |
| Size (bytes) | 540,152,640 | 95,653,440 |
| Size | 515.1 MB | 91.2 MB |
| Events in quadrant A | 3,633,537 | 641,836 |
| Events in quadrant B | 2,782,210 | 670,132 |
| Events in quadrant C | 2,877,015 | 660,219 |
| Events in quadrant D | 6,706,750 | 552,957 |
| Mode M0 | |||
|---|---|---|---|
| Quadrant | BADHDUFLAG | Total packets | Discarded packets |
| A | 0 | 14331 | 3 |
| B | 0 | 11582 | 2 |
| C | 0 | 11615 | 2 |
| D | 0 | 23582 | 2 |
| Mode SS | |||
|---|---|---|---|
| Quadrant | BADHDUFLAG | Total packets | Discarded packets |
| A | 0 | 108 | 0 |
| B | 0 | 108 | 0 |
| C | 0 | 108 | 0 |
| D | 0 | 108 | 0 |
| Mode M9 | |||
|---|---|---|---|
| Quadrant | BADHDUFLAG | Total packets | Discarded packets |
| A | 0 | 24 | 0 |
| B | 0 | 24 | 0 |
| C | 0 | 24 | 0 |
| D | 0 | 25 | 0 |
| Quadrant | Total seconds | Saturated seconds | Saturation percentage |
|---|---|---|---|
| A | 5304 | 89 | 1.677979% |
| B | 5304 | 47 | 0.886124% |
| C | 5304 | 64 | 1.206637% |
| D | 5304 | 1165 | 21.964555% |
Noise dominated data is calculated using 1-second bins in cleaned event files. If a bin has >2000 counts, and if more than 50% of those come from <1% of pixels, then it is considered to be noise-dominated and hence unusable.
| Quadrant | # 1 sec bins | Bins with >0 counts | Bins with >2000 counts | High rate bins dominated by noise | Noise dominated (total time) | Noise dominated (detector-on time) | Marked lightcurve |
|---|---|---|---|---|---|---|---|
| A | 7306 | 5305 | 68 | 68 | 0.93% | 1.28% | 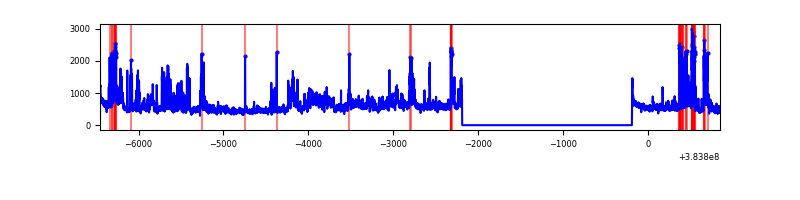 |
| B | 7306 | 5305 | 32 | 32 | 0.44% | 0.60% | 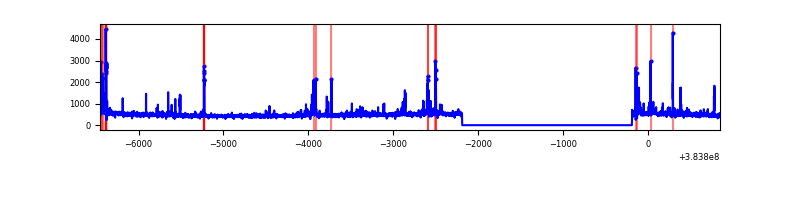 |
| C | 7306 | 5305 | 45 | 45 | 0.62% | 0.85% | 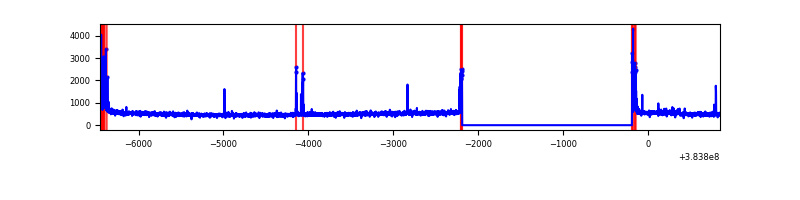 |
| D | 7306 | 5305 | 1068 | 1068 | 14.62% | 20.13% | 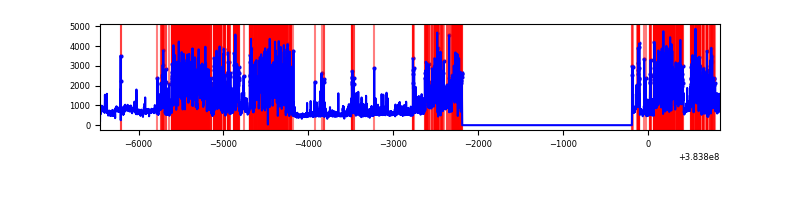 |
Top three noisy pixels from each quadrant. If the there are fewer than three noisy pixels in the level2.evt file, extra rows are filled as -1
| Pixel properties | Quadrant properties | ||||||
|---|---|---|---|---|---|---|---|
| Quadrant | DetID | PixID | Counts | Sigma | Mean | Median | Sigma |
| A | 15 | 169 | 1110087 | 8760.06 | 631 | 621 | 126.7 |
| A | 10 | 83 | 48226 | 375.88 | 631 | 621 | 126.7 |
| A | 9 | 143 | 18921 | 144.49 | 631 | 621 | 126.7 |
| B | 5 | 172 | 194628 | 1649.41 | 632 | 618 | 117.6 |
| B | 5 | 255 | 41139 | 344.5 | 632 | 618 | 117.6 |
| B | 4 | 171 | 21875 | 180.72 | 632 | 618 | 117.6 |
| C | 15 | 214 | 225261 | 1595.64 | 615 | 621 | 140.8 |
| C | 0 | 10 | 162465 | 1149.59 | 615 | 621 | 140.8 |
| C | 0 | 207 | 62851 | 442.03 | 615 | 621 | 140.8 |
| D | 2 | 250 | 2795545 | 19859.41 | 557 | 544 | 140.7 |
| D | 8 | 195 | 618413 | 4390.16 | 557 | 544 | 140.7 |
| D | 12 | 233 | 395150 | 2803.81 | 557 | 544 | 140.7 |
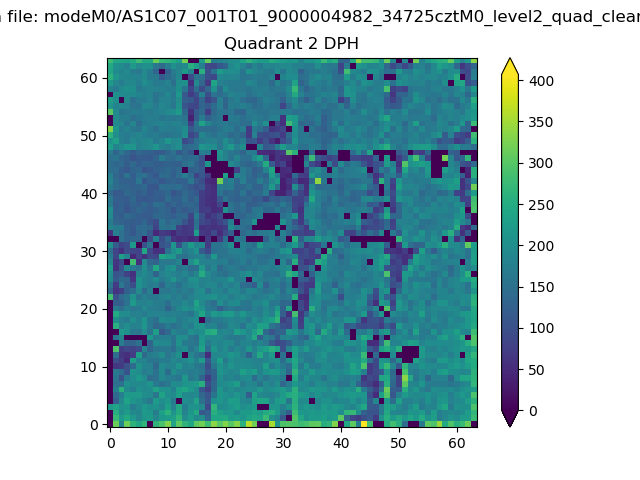
Histogram calculated using DETX and DETY for each event in the final _common_clean file
| Quadrant A | 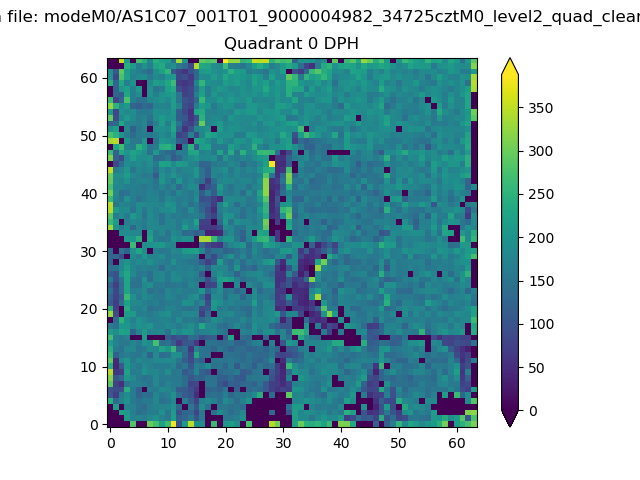 |
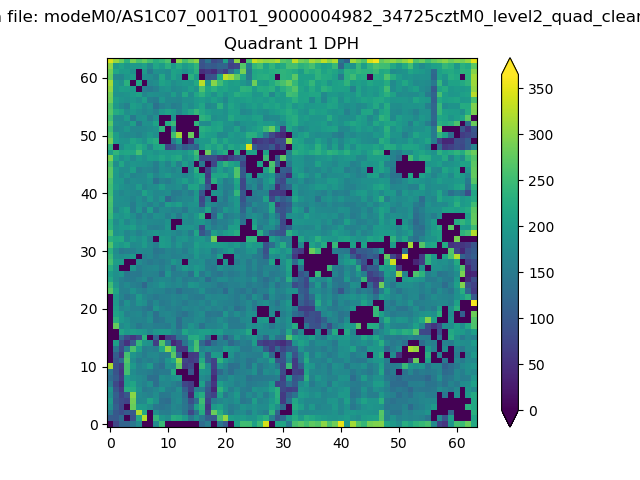 |
Quadrant B |
|---|---|---|---|
| Quadrant D | 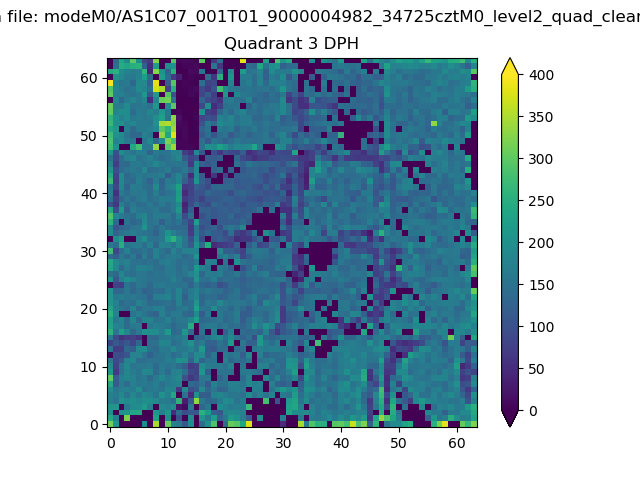 |
 |
Quadrant C |
| Plot type | Count rate plots | Images |
|---|---|---|
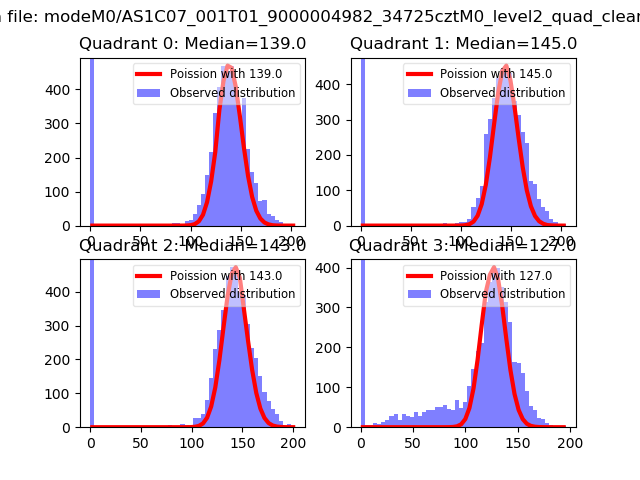
| Comparison with Poisson distribution Blue bars denote a histogram of data divided into 1 sec bins. Red curve is a Poisson curve with rate = median count rate of data. |
 |
 |
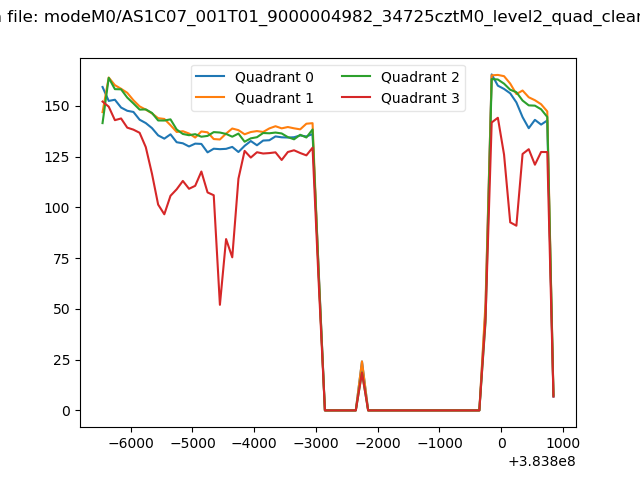
| Quadrant-wise count rates Data is divided into 100 sec bins |
 |
|
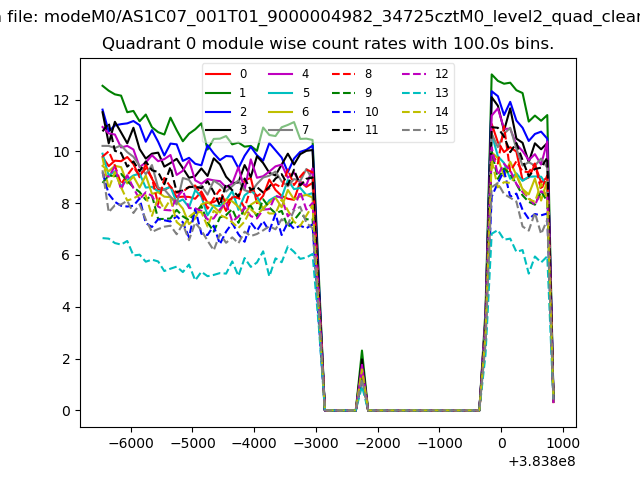
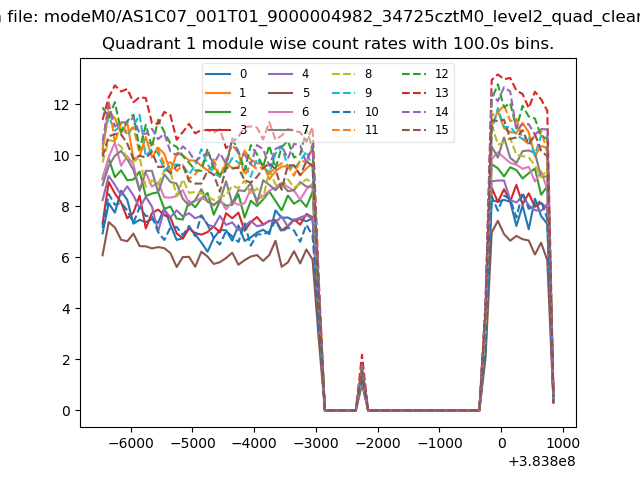
| Module-wise count rates for Quadrant A Data is divided into 100 sec bins |
 |
 |
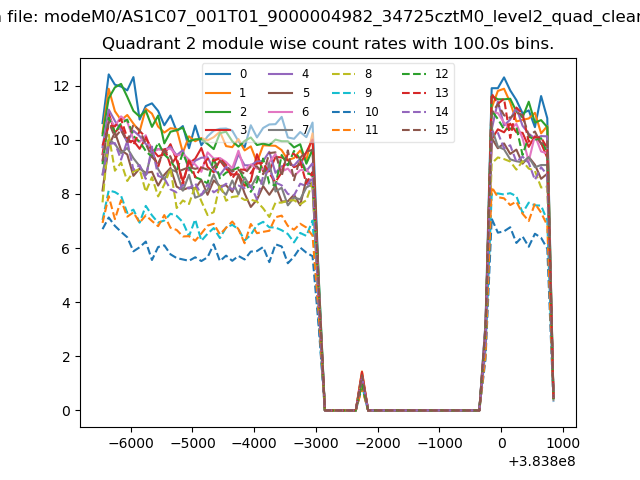
| Module-wise count rates for Quadrant B Data is divided into 100 sec bins |
 |
 |
| Module-wise count rates for Quadrant C Data is divided into 100 sec bins |
 |
 |
| Module-wise count rates for Quadrant D Data is divided into 100 sec bins |
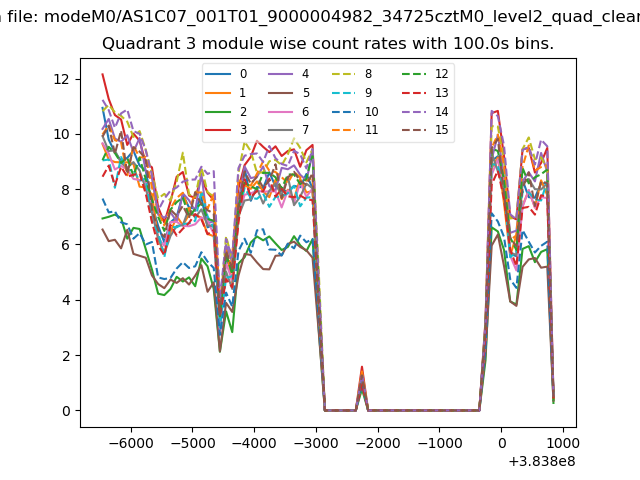 |
 |
| Parameter | Plot |
|---|---|
| CZT HV Monitor | 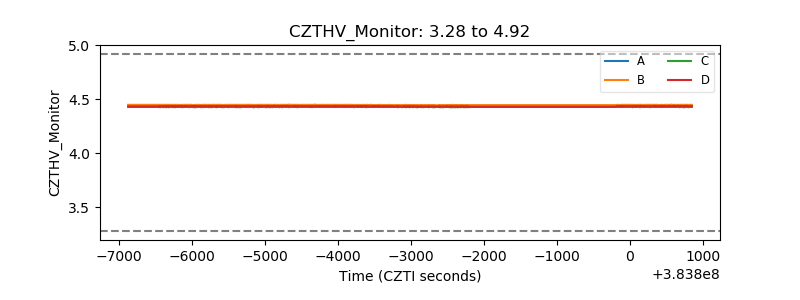 |
| D_VDD | 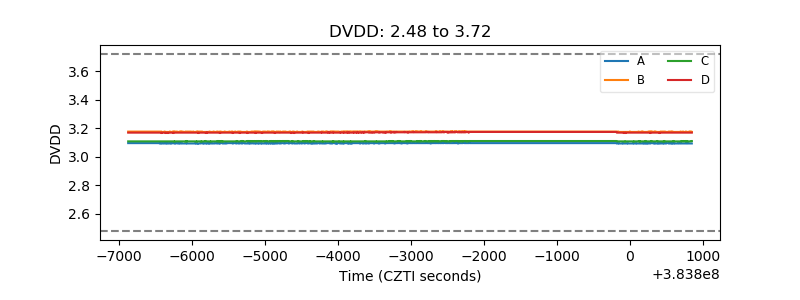 |
| Temperature 1 | 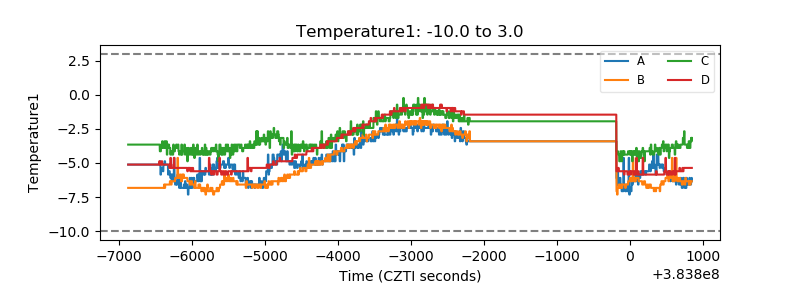 |
| Veto HV Monitor | 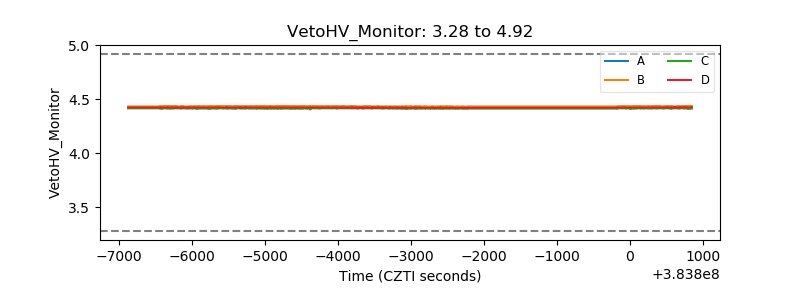 |
| Veto LLD | 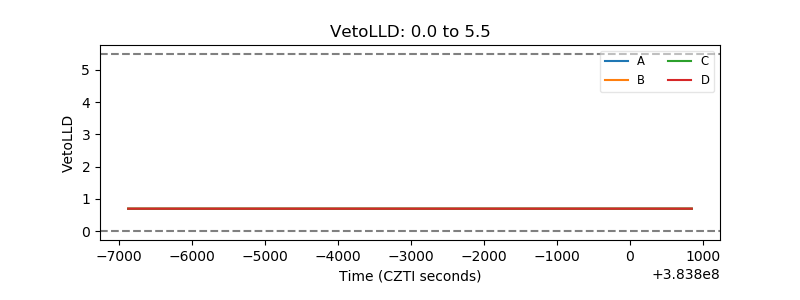 |
| Alpha Counter | 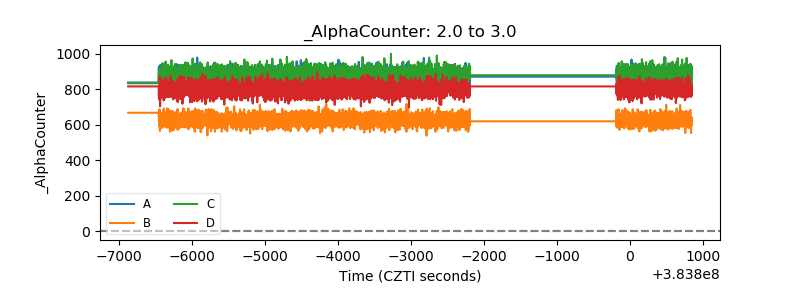 |
| _CPM_Rate | 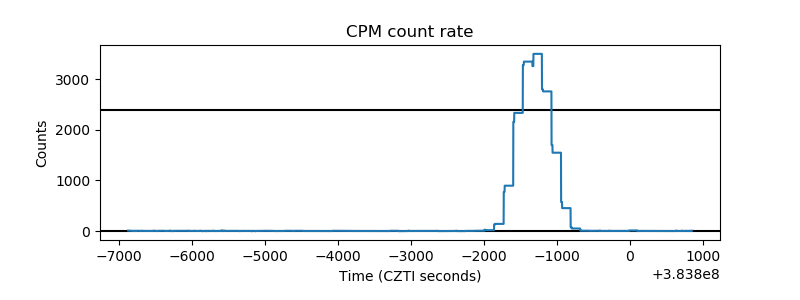 |
| CZT Counter | 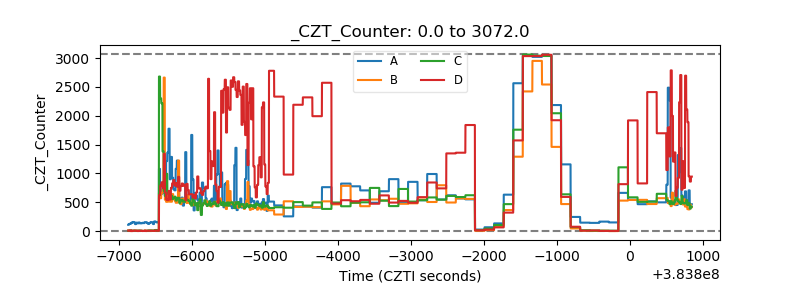 |
| +2.5 Volts monitor | 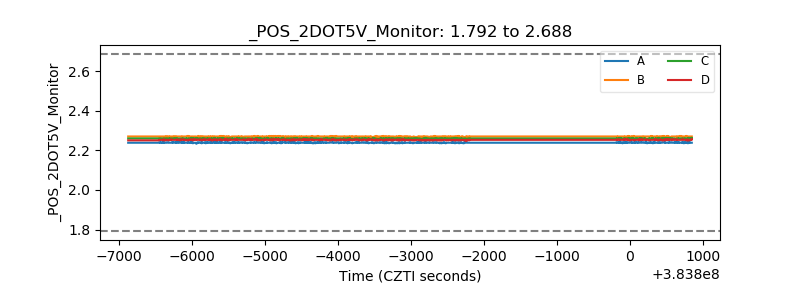 |
| +5 Volts monitor | 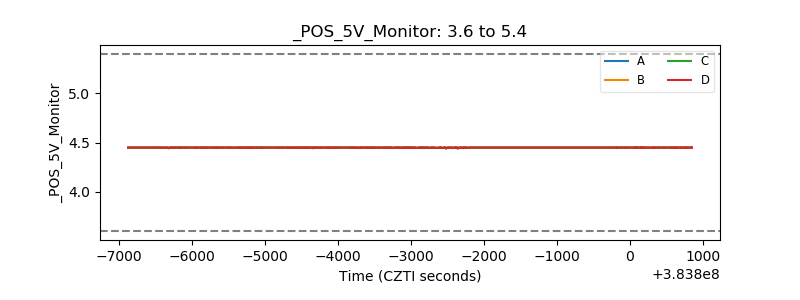 |
| _ROLL_ROT | 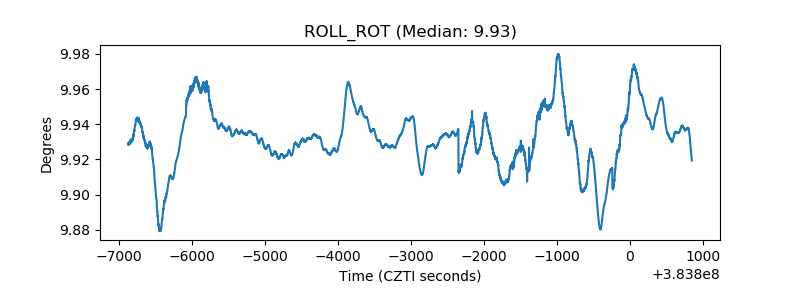 |
| _Roll_DEC | 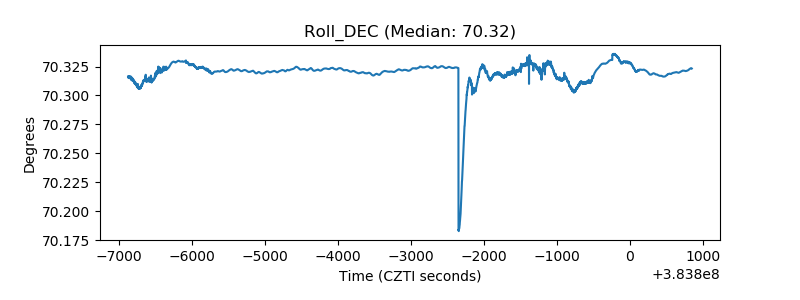 |
| _Roll_RA | 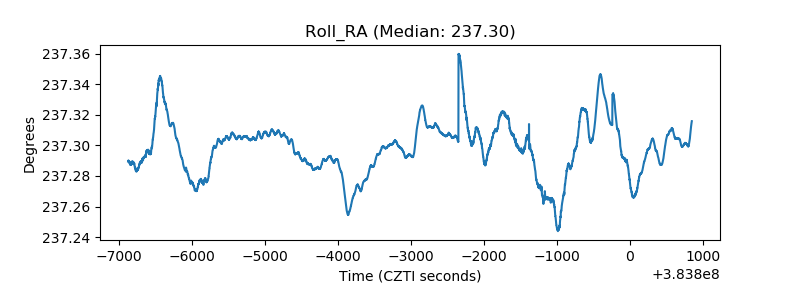 |
| Veto Counter | 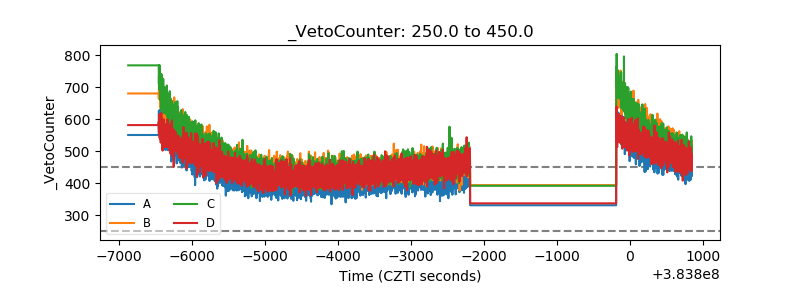 |