| Param | Original file | Final file |
|---|---|---|
| Filename | modeM0/AS1C07_001T01_9000004982_34724cztM0_level2.evt | modeM0/AS1C07_001T01_9000004982_34724cztM0_level2_quad_clean.evt |
| Size (bytes) | 468,339,840 | 100,889,280 |
| Size | 446.6 MB | 96.2 MB |
| Events in quadrant A | 2,844,139 | 672,110 |
| Events in quadrant B | 2,811,724 | 693,340 |
| Events in quadrant C | 2,895,590 | 691,366 |
| Events in quadrant D | 5,265,143 | 619,778 |
| Mode M0 | |||
|---|---|---|---|
| Quadrant | BADHDUFLAG | Total packets | Discarded packets |
| A | 0 | 12027 | 3 |
| B | 0 | 11762 | 2 |
| C | 0 | 11851 | 2 |
| D | 0 | 19448 | 2 |
| Mode SS | |||
|---|---|---|---|
| Quadrant | BADHDUFLAG | Total packets | Discarded packets |
| A | 0 | 110 | 0 |
| B | 0 | 110 | 0 |
| C | 0 | 110 | 0 |
| D | 0 | 110 | 0 |
| Mode M9 | |||
|---|---|---|---|
| Quadrant | BADHDUFLAG | Total packets | Discarded packets |
| A | 0 | 20 | 0 |
| B | 0 | 20 | 0 |
| C | 0 | 20 | 0 |
| D | 0 | 21 | 0 |
| Quadrant | Total seconds | Saturated seconds | Saturation percentage |
|---|---|---|---|
| A | 5412 | 17 | 0.314117% |
| B | 5412 | 53 | 0.979305% |
| C | 5412 | 75 | 1.385809% |
| D | 5412 | 464 | 8.573540% |
Noise dominated data is calculated using 1-second bins in cleaned event files. If a bin has >2000 counts, and if more than 50% of those come from <1% of pixels, then it is considered to be noise-dominated and hence unusable.
| Quadrant | # 1 sec bins | Bins with >0 counts | Bins with >2000 counts | High rate bins dominated by noise | Noise dominated (total time) | Noise dominated (detector-on time) | Marked lightcurve |
|---|---|---|---|---|---|---|---|
| A | 7295 | 5413 | 15 | 15 | 0.21% | 0.28% | 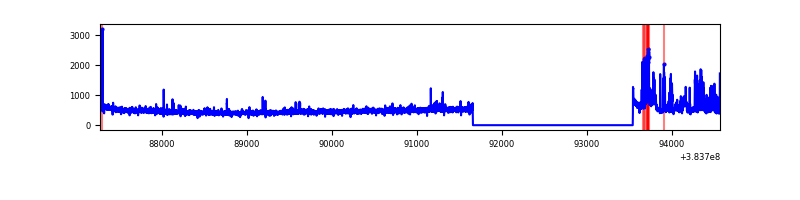 |
| B | 7295 | 5413 | 34 | 34 | 0.47% | 0.63% | 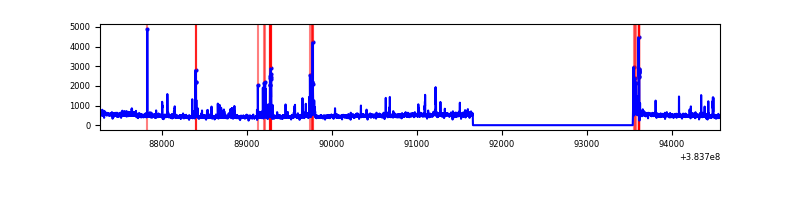 |
| C | 7295 | 5413 | 48 | 48 | 0.66% | 0.89% | 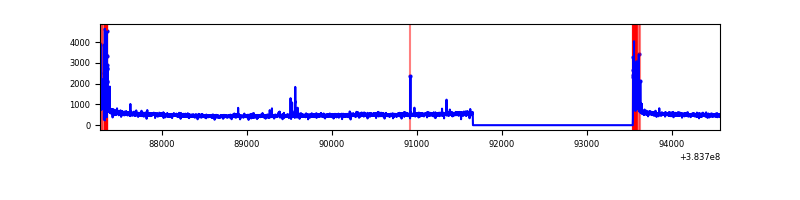 |
| D | 7295 | 5413 | 455 | 455 | 6.24% | 8.41% | 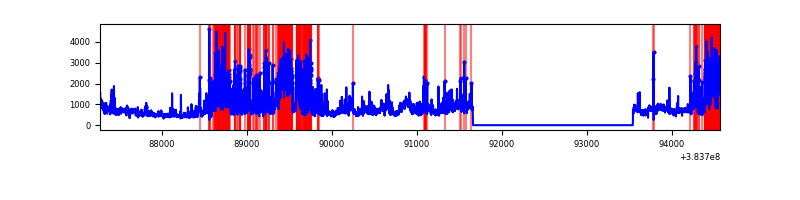 |
Top three noisy pixels from each quadrant. If the there are fewer than three noisy pixels in the level2.evt file, extra rows are filled as -1
| Pixel properties | Quadrant properties | ||||||
|---|---|---|---|---|---|---|---|
| Quadrant | DetID | PixID | Counts | Sigma | Mean | Median | Sigma |
| A | 15 | 169 | 314482 | 2526.3 | 628 | 618 | 124.2 |
| A | 10 | 83 | 47557 | 377.81 | 628 | 618 | 124.2 |
| A | 7 | 48 | 22628 | 177.16 | 628 | 618 | 124.2 |
| B | 5 | 172 | 227680 | 1922.16 | 631 | 616 | 118.1 |
| B | 0 | 190 | 25530 | 210.9 | 631 | 616 | 118.1 |
| B | 5 | 255 | 24633 | 203.31 | 631 | 616 | 118.1 |
| C | 0 | 10 | 234462 | 1655.63 | 616 | 621 | 141.2 |
| C | 15 | 214 | 229092 | 1617.61 | 616 | 621 | 141.2 |
| C | 14 | 67 | 19421 | 133.11 | 616 | 621 | 141.2 |
| D | 2 | 250 | 1726369 | 11253.59 | 588 | 574 | 153.4 |
| D | 8 | 195 | 787849 | 5133.68 | 588 | 574 | 153.4 |
| D | 1 | 20 | 185883 | 1208.37 | 588 | 574 | 153.4 |
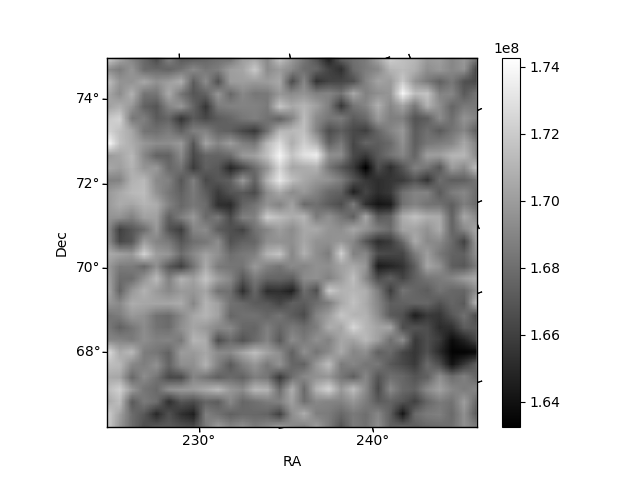
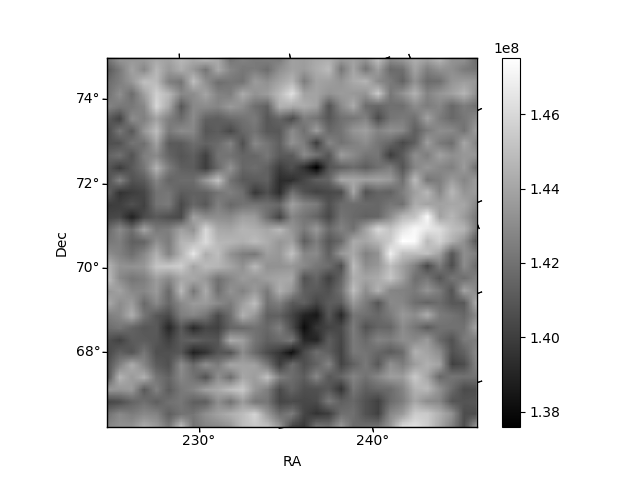
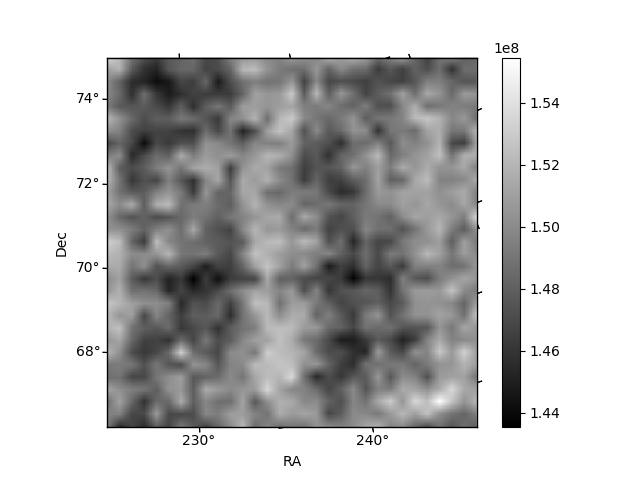
Histogram calculated using DETX and DETY for each event in the final _common_clean file
| Quadrant A | 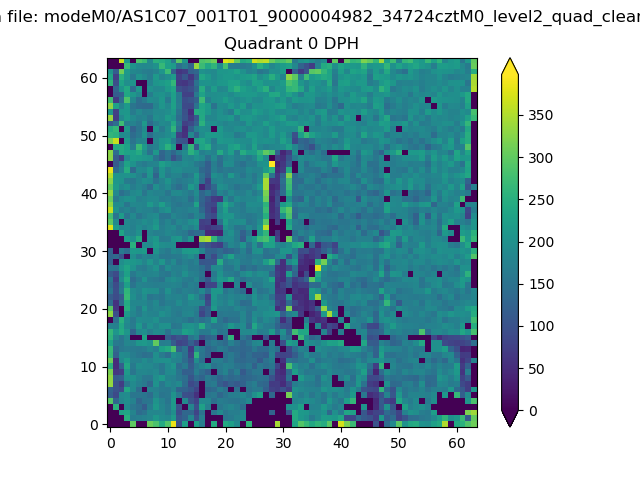 |
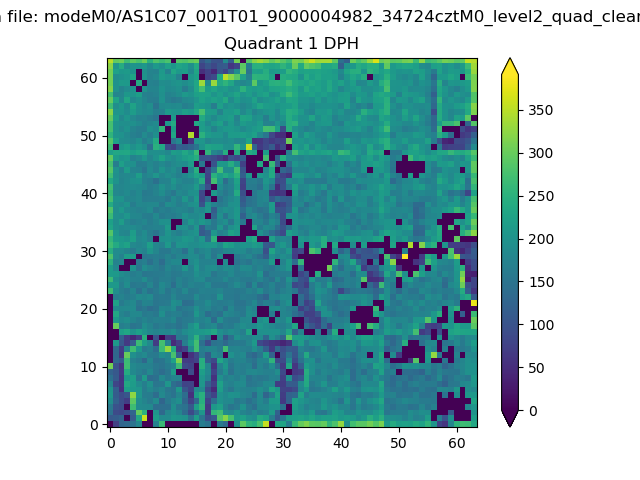 |
Quadrant B |
|---|---|---|---|
| Quadrant D | 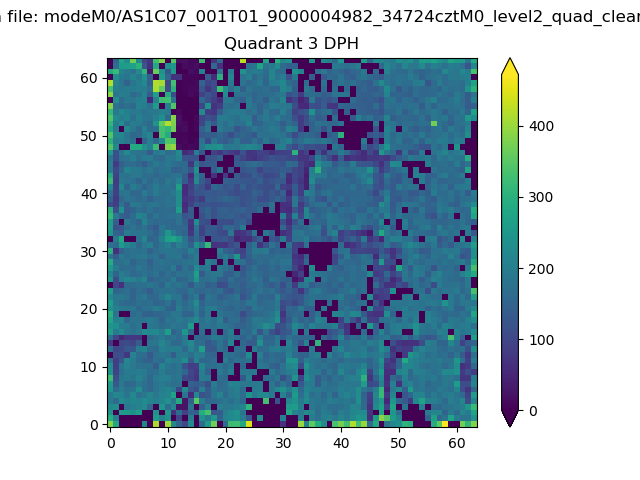 |
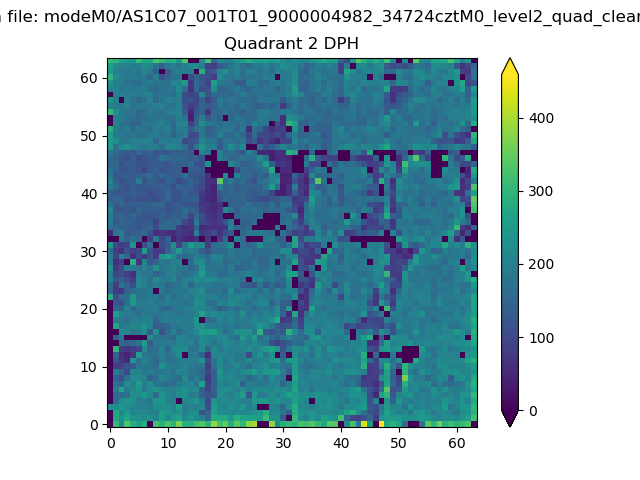 |
Quadrant C |
| Plot type | Count rate plots | Images |
|---|---|---|
| Comparison with Poisson distribution Blue bars denote a histogram of data divided into 1 sec bins. Red curve is a Poisson curve with rate = median count rate of data. |
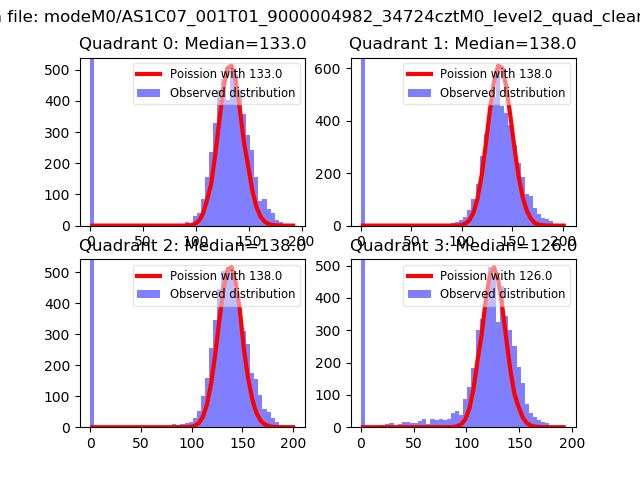 |
 |
| Quadrant-wise count rates Data is divided into 100 sec bins |
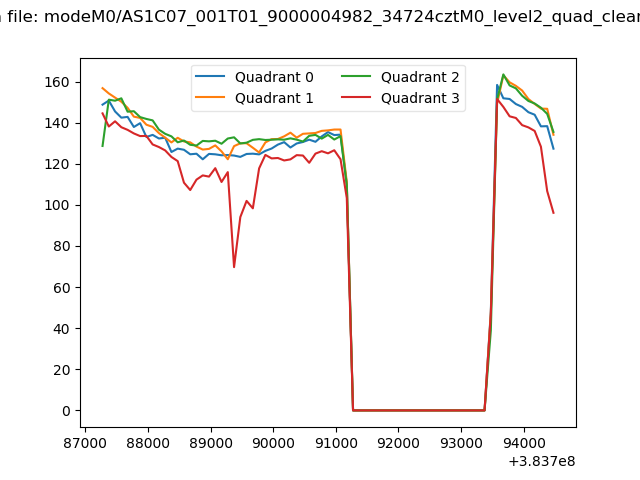 |
|
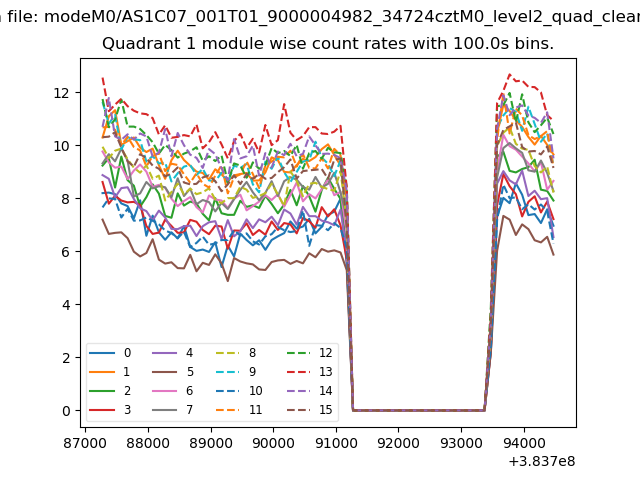
| Module-wise count rates for Quadrant A Data is divided into 100 sec bins |
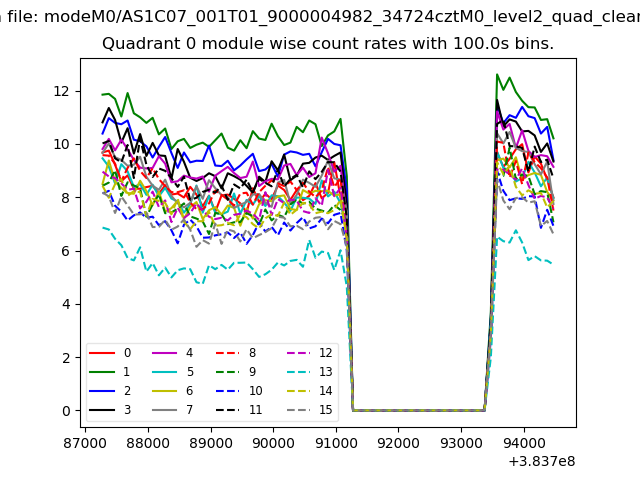 |
 |
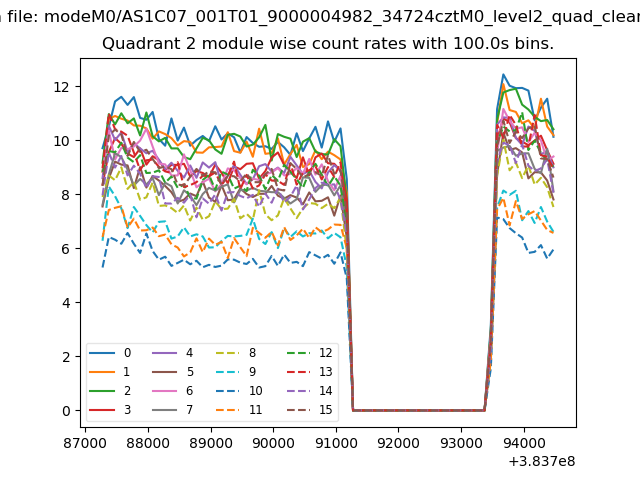
| Module-wise count rates for Quadrant B Data is divided into 100 sec bins |
 |
 |
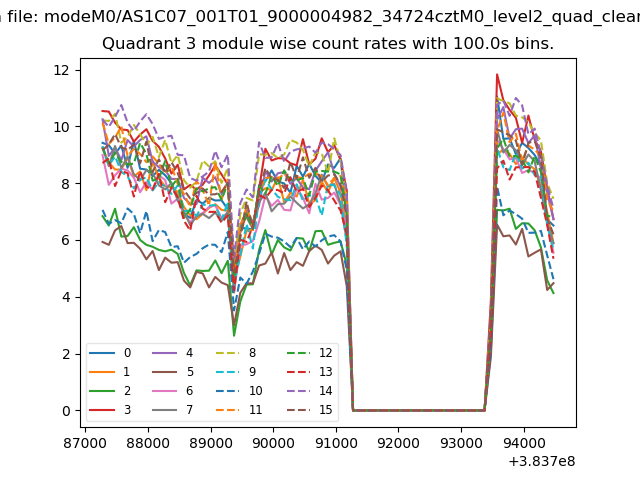
| Module-wise count rates for Quadrant C Data is divided into 100 sec bins |
 |
 |
| Module-wise count rates for Quadrant D Data is divided into 100 sec bins |
 |
 |
| Parameter | Plot |
|---|---|
| CZT HV Monitor | 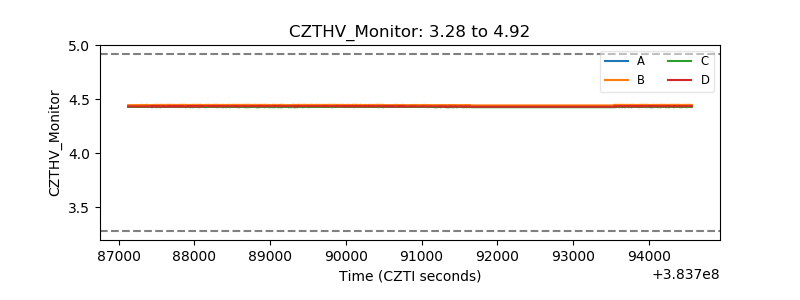 |
| D_VDD | 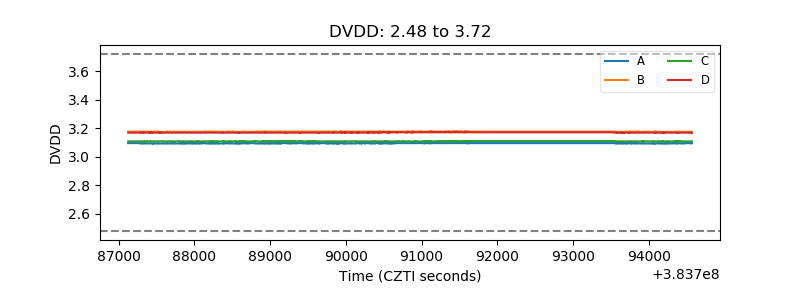 |
| Temperature 1 | 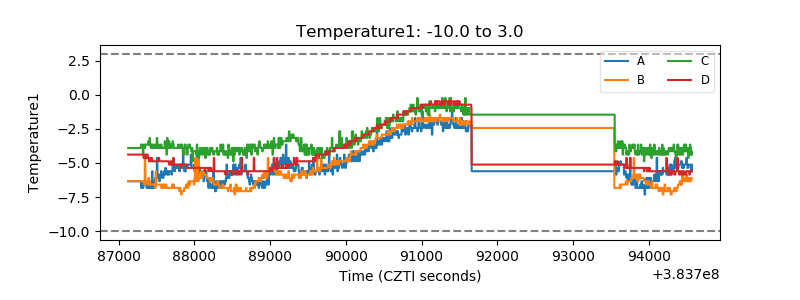 |
| Veto HV Monitor | 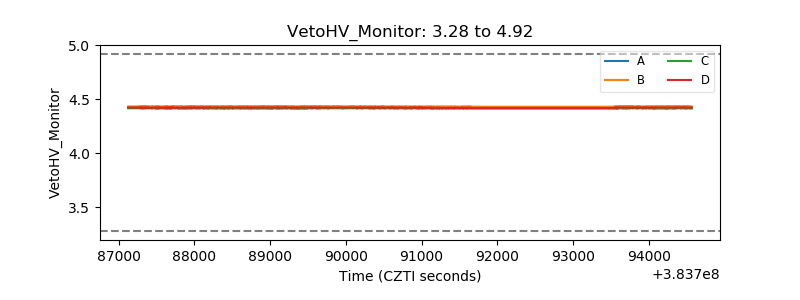 |
| Veto LLD |  |
| Alpha Counter | 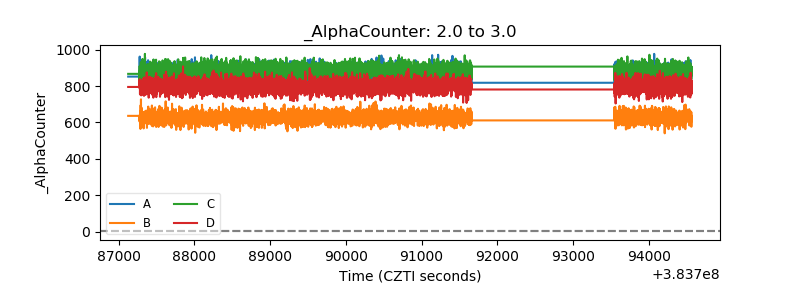 |
| _CPM_Rate | 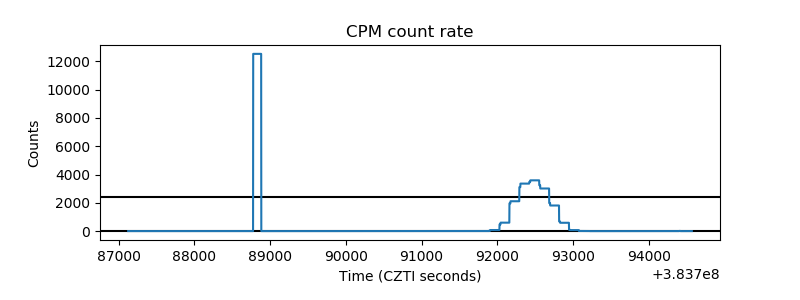 |
| CZT Counter | 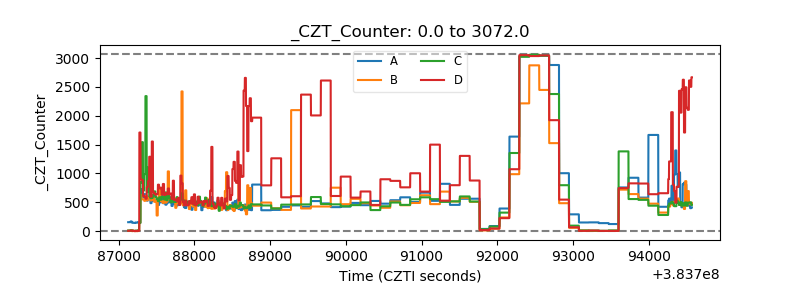 |
| +2.5 Volts monitor | 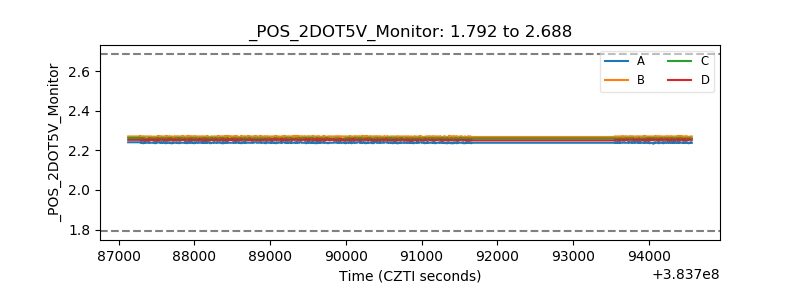 |
| +5 Volts monitor | 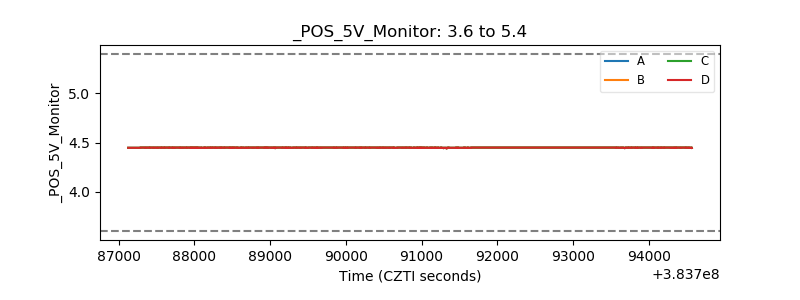 |
| _ROLL_ROT | 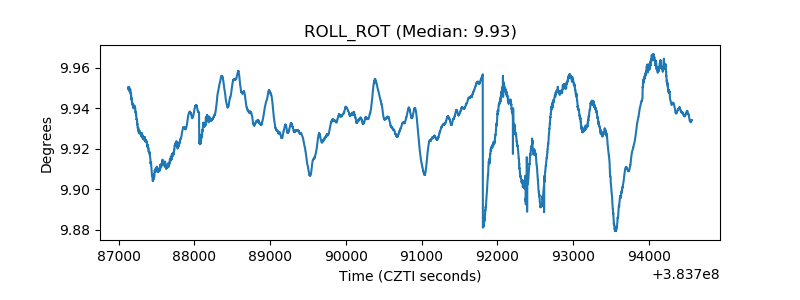 |
| _Roll_DEC | 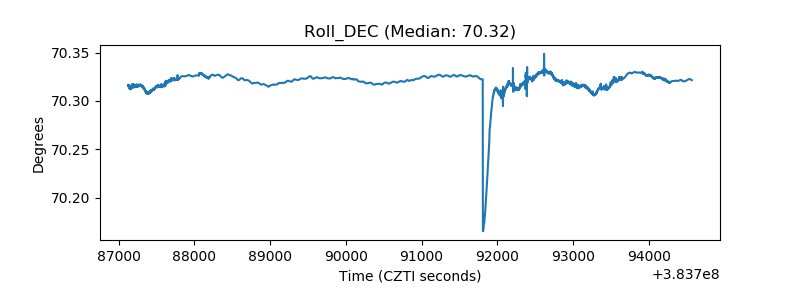 |
| _Roll_RA | 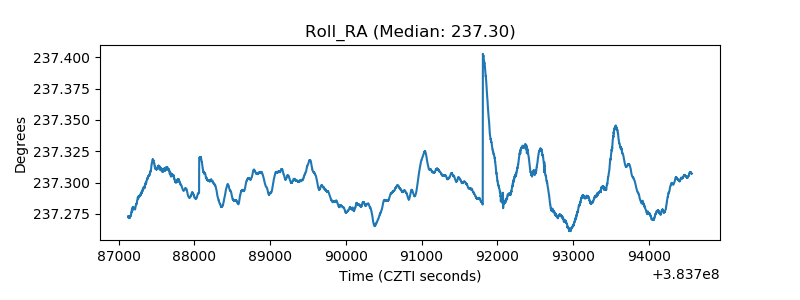 |
| Veto Counter | 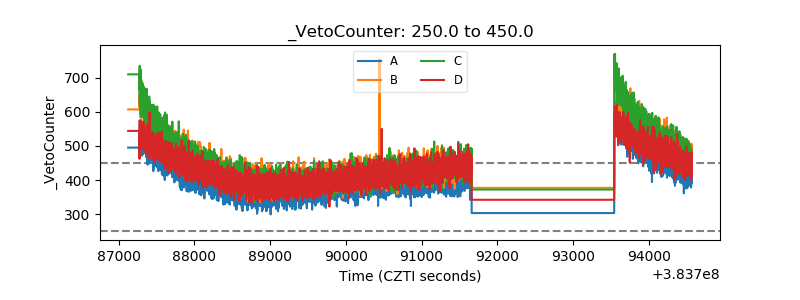 |