| Param | Original file | Final file |
|---|---|---|
| Filename | modeM0/AS1C07_001T01_9000004982_34717cztM0_level2.evt | modeM0/AS1C07_001T01_9000004982_34717cztM0_level2_quad_clean.evt |
| Size (bytes) | 534,556,800 | 90,529,920 |
| Size | 509.8 MB | 86.3 MB |
| Events in quadrant A | 3,303,721 | 591,489 |
| Events in quadrant B | 3,239,248 | 590,771 |
| Events in quadrant C | 3,044,600 | 594,092 |
| Events in quadrant D | 6,199,258 | 550,169 |
| Mode M0 | |||
|---|---|---|---|
| Quadrant | BADHDUFLAG | Total packets | Discarded packets |
| A | 0 | 13652 | 2 |
| B | 0 | 13401 | 1 |
| C | 0 | 12577 | 1 |
| D | 0 | 22543 | 1 |
| Mode SS | |||
|---|---|---|---|
| Quadrant | BADHDUFLAG | Total packets | Discarded packets |
| A | 0 | 118 | 0 |
| B | 0 | 118 | 0 |
| C | 0 | 118 | 0 |
| D | 0 | 118 | 0 |
| Mode M9 | |||
|---|---|---|---|
| Quadrant | BADHDUFLAG | Total packets | Discarded packets |
| A | 0 | 16 | 0 |
| B | 0 | 16 | 0 |
| C | 0 | 16 | 0 |
| D | 0 | 17 | 0 |
| Quadrant | Total seconds | Saturated seconds | Saturation percentage |
|---|---|---|---|
| A | 5949 | 118 | 1.983527% |
| B | 5949 | 115 | 1.933098% |
| C | 5949 | 37 | 0.621953% |
| D | 5949 | 464 | 7.799630% |
Noise dominated data is calculated using 1-second bins in cleaned event files. If a bin has >2000 counts, and if more than 50% of those come from <1% of pixels, then it is considered to be noise-dominated and hence unusable.
| Quadrant | # 1 sec bins | Bins with >0 counts | Bins with >2000 counts | High rate bins dominated by noise | Noise dominated (total time) | Noise dominated (detector-on time) | Marked lightcurve |
|---|---|---|---|---|---|---|---|
| A | 7262 | 5950 | 87 | 87 | 1.20% | 1.46% | 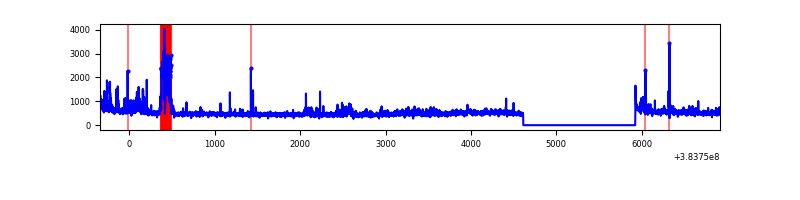 |
| B | 7262 | 5950 | 63 | 63 | 0.87% | 1.06% | 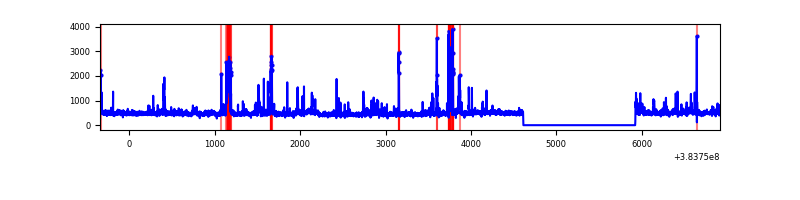 |
| C | 7262 | 5950 | 26 | 26 | 0.36% | 0.44% | 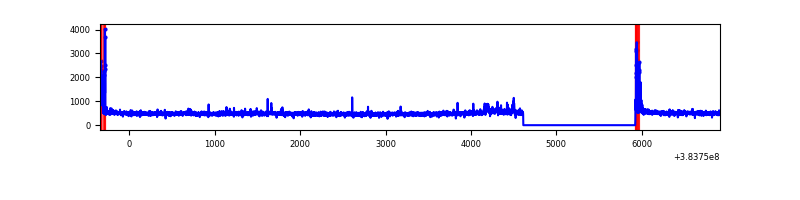 |
| D | 7262 | 5950 | 425 | 425 | 5.85% | 7.14% | 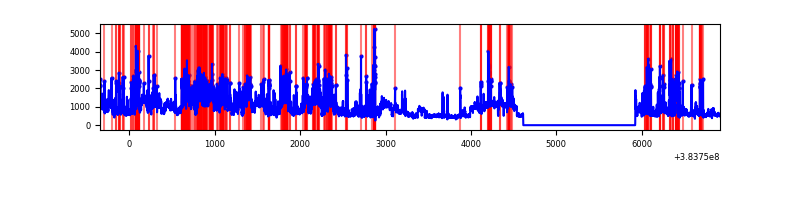 |
Top three noisy pixels from each quadrant. If the there are fewer than three noisy pixels in the level2.evt file, extra rows are filled as -1
| Pixel properties | Quadrant properties | ||||||
|---|---|---|---|---|---|---|---|
| Quadrant | DetID | PixID | Counts | Sigma | Mean | Median | Sigma |
| A | 15 | 169 | 528270 | 3874.85 | 680 | 667 | 136.2 |
| A | 10 | 83 | 52280 | 379.06 | 680 | 667 | 136.2 |
| A | 9 | 143 | 51510 | 373.4 | 680 | 667 | 136.2 |
| B | 5 | 172 | 336794 | 2603.95 | 676 | 657 | 129.1 |
| B | 4 | 171 | 113582 | 874.8 | 676 | 657 | 129.1 |
| B | 4 | 232 | 23123 | 174.04 | 676 | 657 | 129.1 |
| C | 15 | 214 | 253690 | 1647.55 | 666 | 670 | 153.6 |
| C | 0 | 10 | 113522 | 734.84 | 666 | 670 | 153.6 |
| C | 0 | 207 | 42210 | 270.49 | 666 | 670 | 153.6 |
| D | 8 | 195 | 1094326 | 6321.47 | 649 | 635 | 173.0 |
| D | 14 | 52 | 1000072 | 5776.69 | 649 | 635 | 173.0 |
| D | 1 | 20 | 362338 | 2090.62 | 649 | 635 | 173.0 |
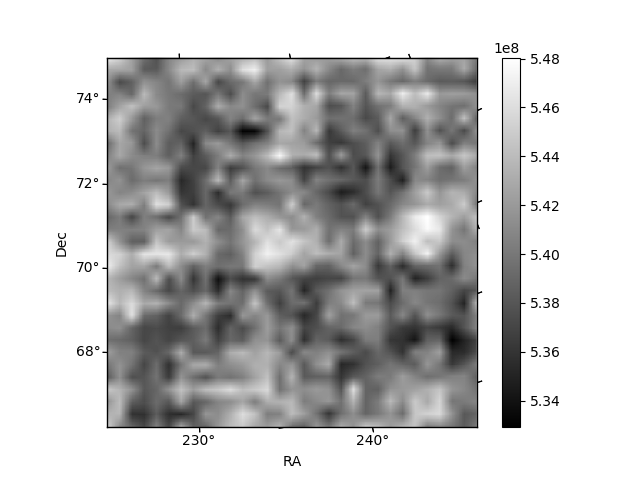
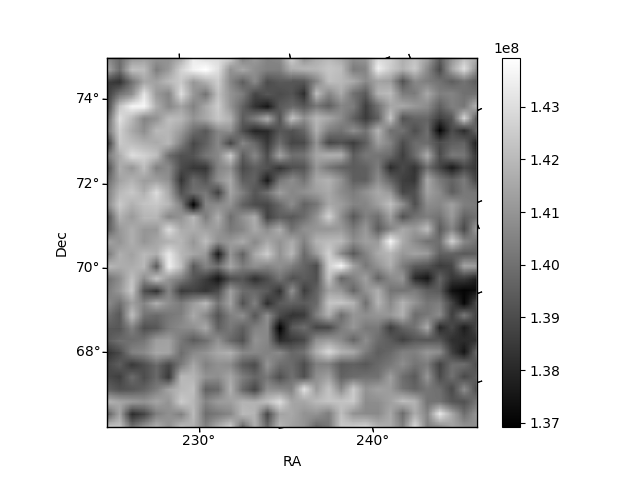
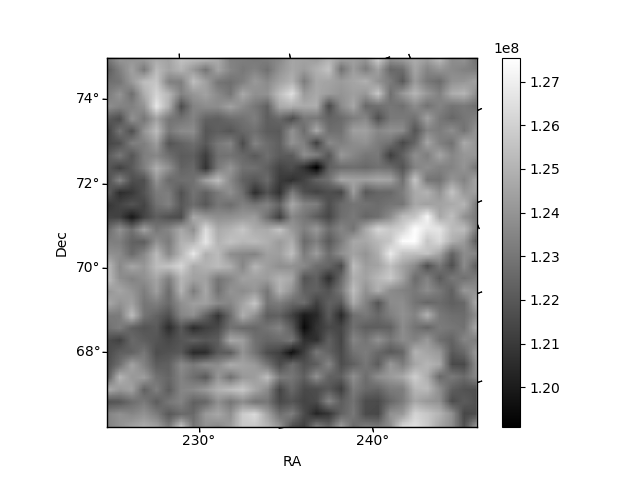
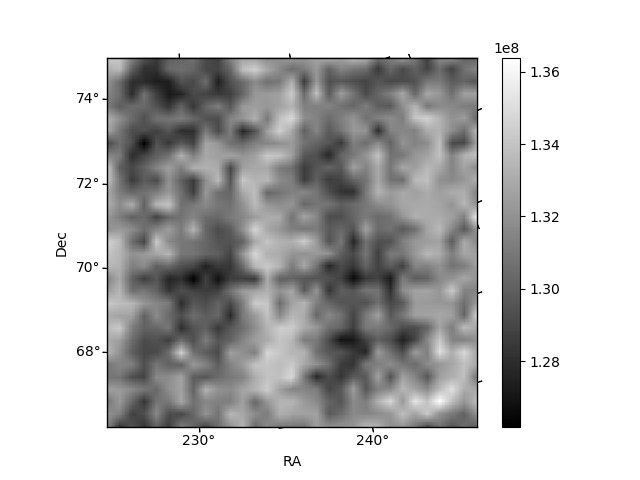
Histogram calculated using DETX and DETY for each event in the final _common_clean file
| Quadrant A | 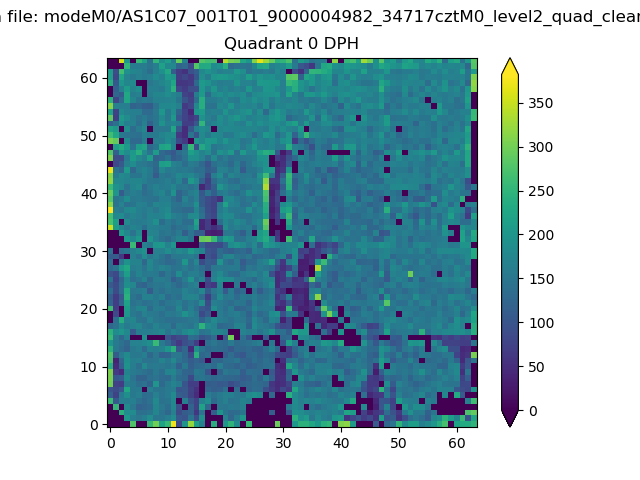 |
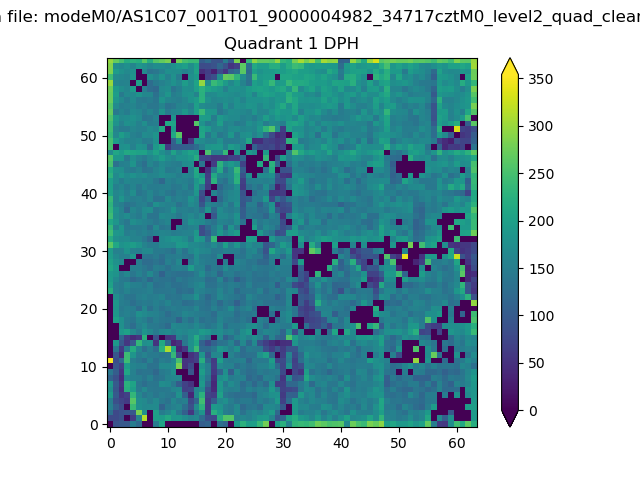 |
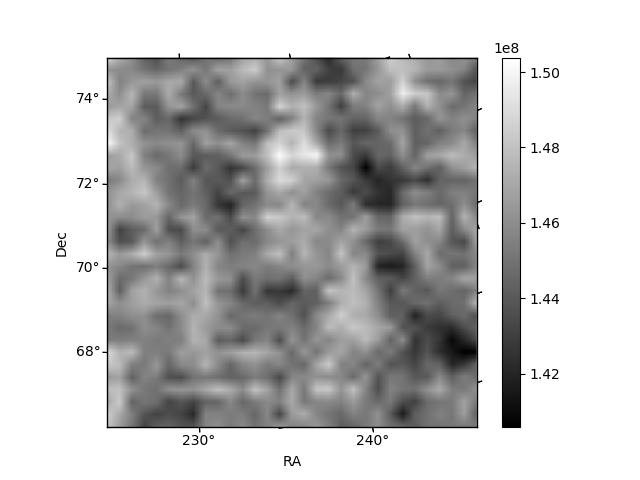
Quadrant B |
|---|---|---|---|
| Quadrant D | 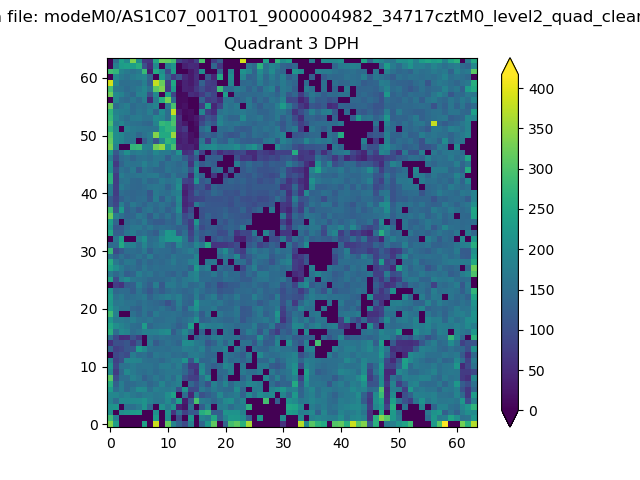 |
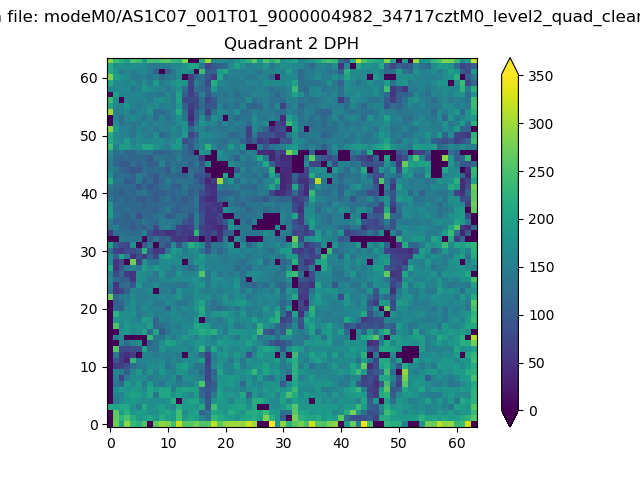 |
Quadrant C |
| Plot type | Count rate plots | Images |
|---|---|---|
| Comparison with Poisson distribution Blue bars denote a histogram of data divided into 1 sec bins. Red curve is a Poisson curve with rate = median count rate of data. |
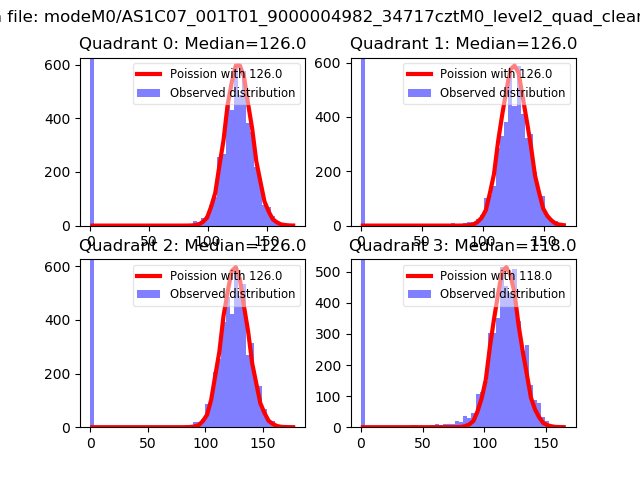 |
 |
| Quadrant-wise count rates Data is divided into 100 sec bins |
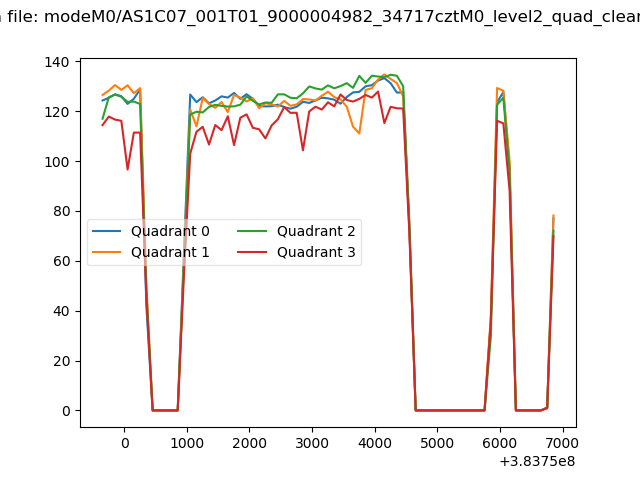 |
|
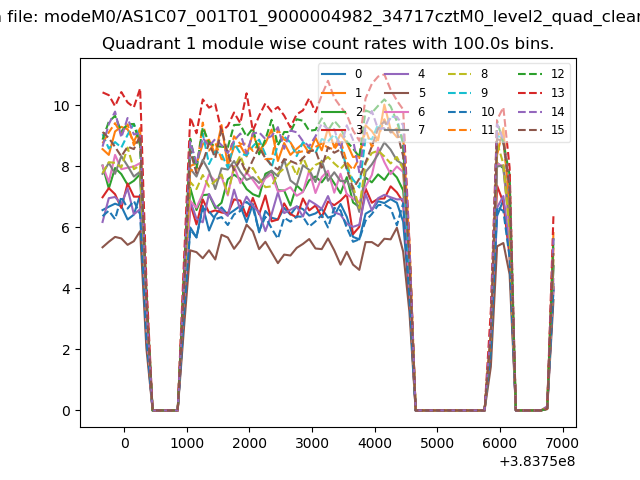
| Module-wise count rates for Quadrant A Data is divided into 100 sec bins |
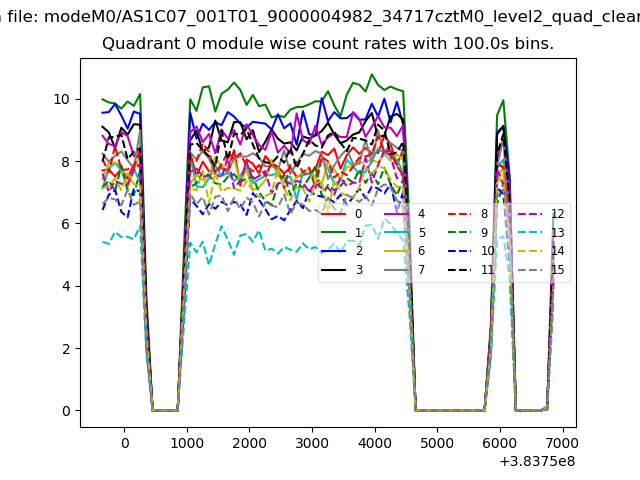 |
 |
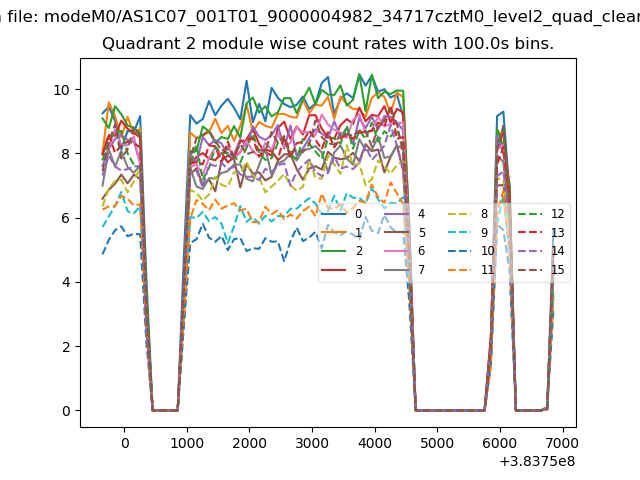
| Module-wise count rates for Quadrant B Data is divided into 100 sec bins |
 |
 |
| Module-wise count rates for Quadrant C Data is divided into 100 sec bins |
 |
 |
| Module-wise count rates for Quadrant D Data is divided into 100 sec bins |
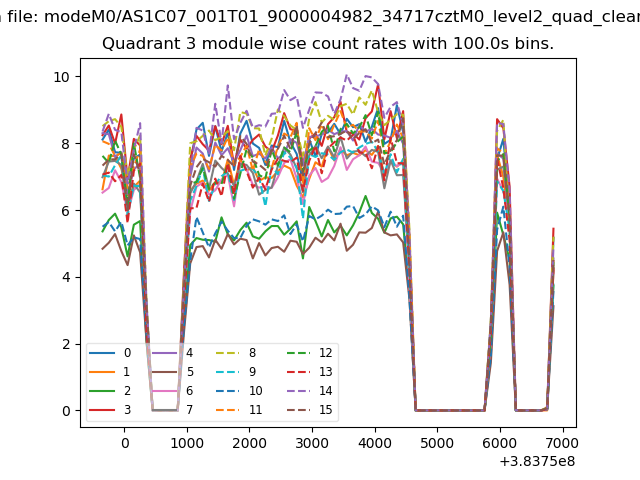 |
 |
| Parameter | Plot |
|---|---|
| CZT HV Monitor | 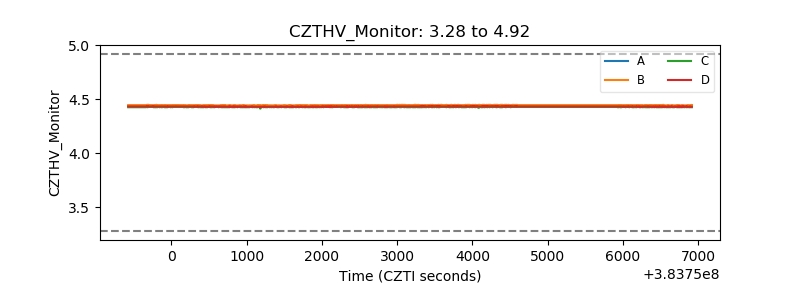 |
| D_VDD | 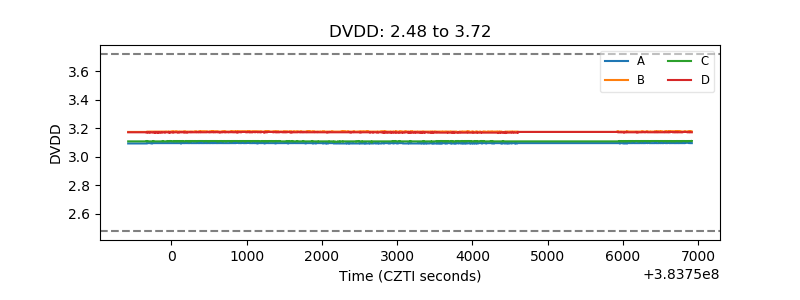 |
| Temperature 1 | 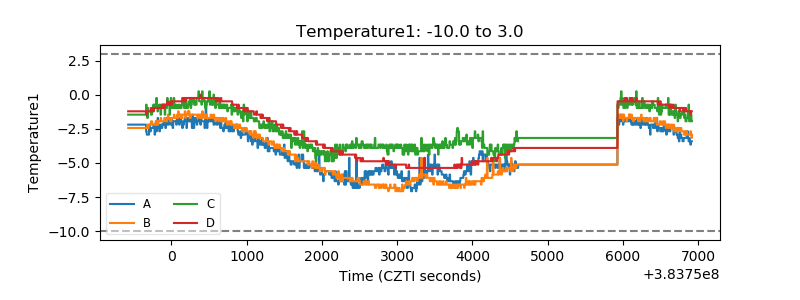 |
| Veto HV Monitor | 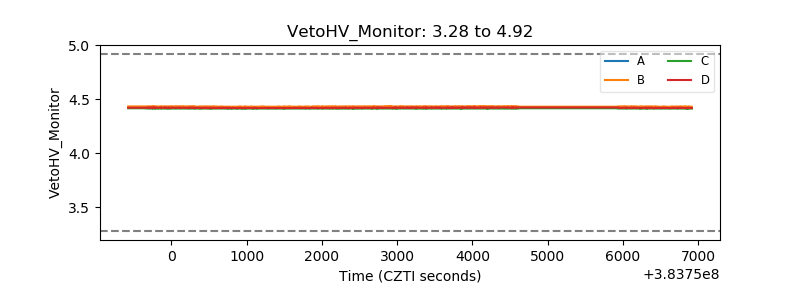 |
| Veto LLD | 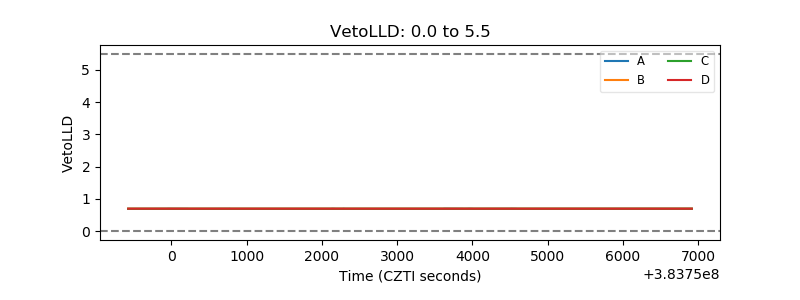 |
| Alpha Counter | 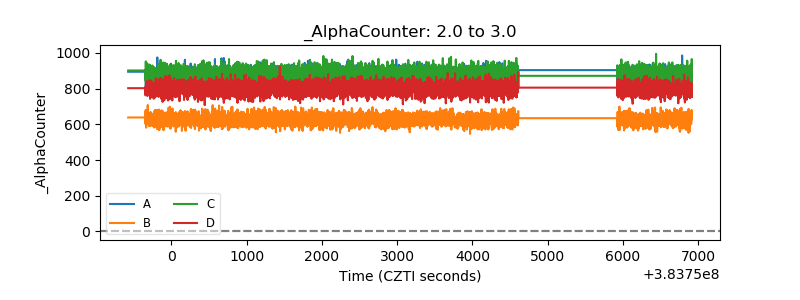 |
| _CPM_Rate | 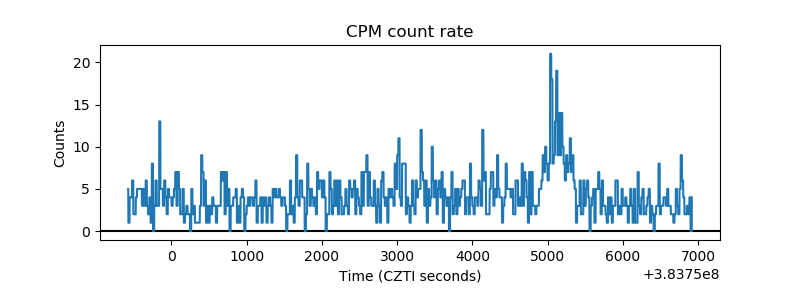 |
| CZT Counter | 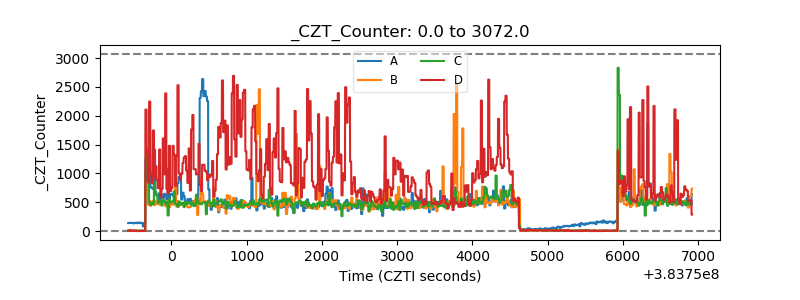 |
| +2.5 Volts monitor | 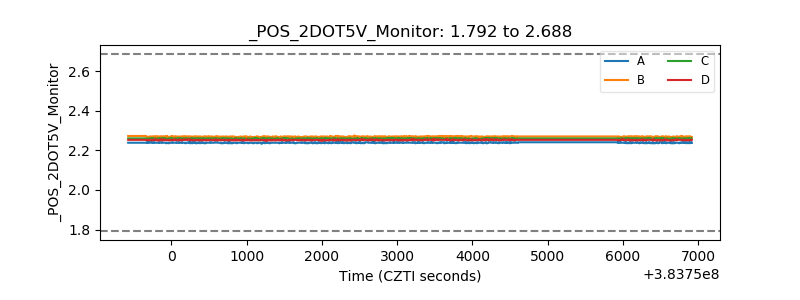 |
| +5 Volts monitor | 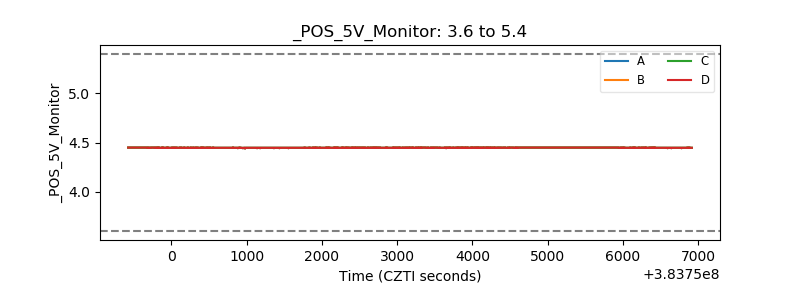 |
| _ROLL_ROT | 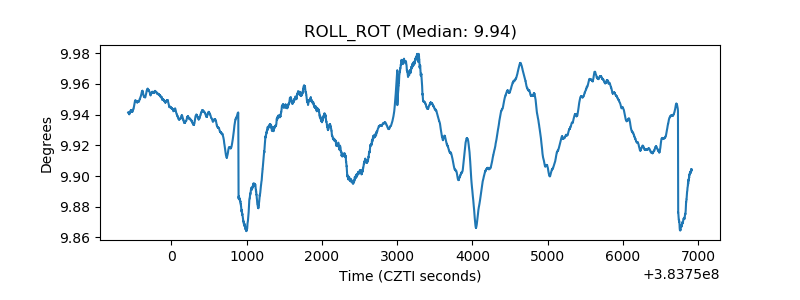 |
| _Roll_DEC | 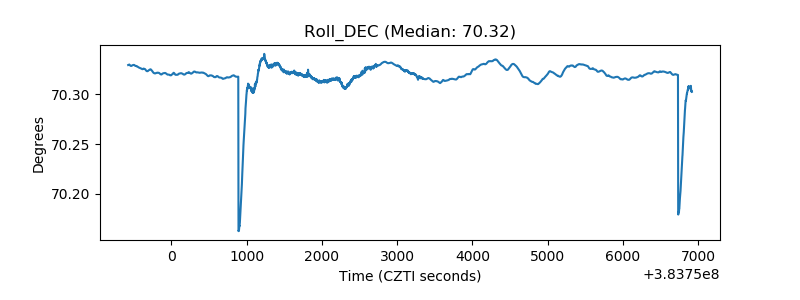 |
| _Roll_RA | 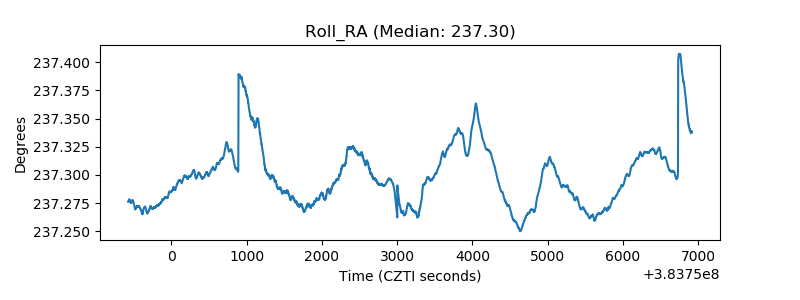 |
| Veto Counter | 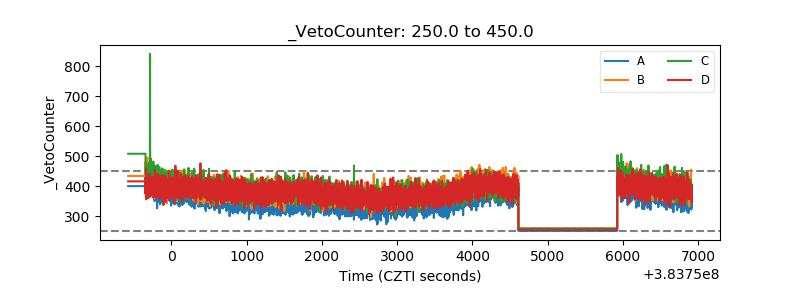 |