| Param | Original file | Final file |
|---|---|---|
| Filename | modeM0/AS1C07_001T01_9000004982cztM0_level2_bc.evt | modeM0/AS1C07_001T01_9000004982cztM0_level2_quad_clean.evt |
| Size (bytes) | 4,247,256,960 | 1,362,214,080 |
| Size | 4.0 GB | 1.3 GB |
| Events in quadrant A | 26,386,223 | 9,039,340 |
| Events in quadrant B | 20,792,373 | 9,171,714 |
| Events in quadrant C | 21,311,552 | 9,167,713 |
| Events in quadrant D | 54,633,907 | 8,325,910 |
| Mode M0 | |||
|---|---|---|---|
| Quadrant | BADHDUFLAG | Total packets | Discarded packets |
| A | 0 | 199534 | 0 |
| B | 0 | 178469 | 0 |
| C | 0 | 170761 | 0 |
| D | 0 | 295316 | 0 |
| Mode SS | |||
|---|---|---|---|
| Quadrant | BADHDUFLAG | Total packets | Discarded packets |
| A | 0 | 1656 | 0 |
| B | 0 | 1650 | 0 |
| C | 0 | 1656 | 0 |
| D | 0 | 1648 | 0 |
| Mode M9 | |||
|---|---|---|---|
| Quadrant | BADHDUFLAG | Total packets | Discarded packets |
| A | 0 | 301 | 0 |
| B | 0 | 301 | 0 |
| C | 0 | 301 | 0 |
| D | 0 | 301 | 0 |
| Quadrant | Total seconds | Saturated seconds | Saturation percentage |
|---|---|---|---|
| A | 81129 | 2031 | 2.503420% |
| B | 81084 | 1139 | 1.404716% |
| C | 81151 | 511 | 0.629690% |
| D | 80966 | 6880 | 8.497394% |
Noise dominated data is calculated using 1-second bins in cleaned event files. If a bin has >2000 counts, and if more than 50% of those come from <1% of pixels, then it is considered to be noise-dominated and hence unusable.
| Quadrant | # 1 sec bins | Bins with >0 counts | Bins with >2000 counts | High rate bins dominated by noise | Noise dominated (total time) | Noise dominated (detector-on time) | Marked lightcurve |
|---|---|---|---|---|---|---|---|
| A | 111306 | 81349 | 29 | 29 | 0.03% | 0.04% | 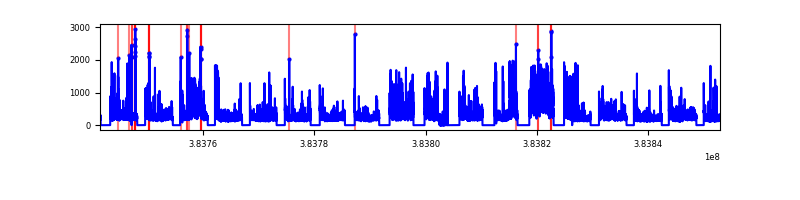 |
| B | 111306 | 81295 | 166 | 166 | 0.15% | 0.20% | 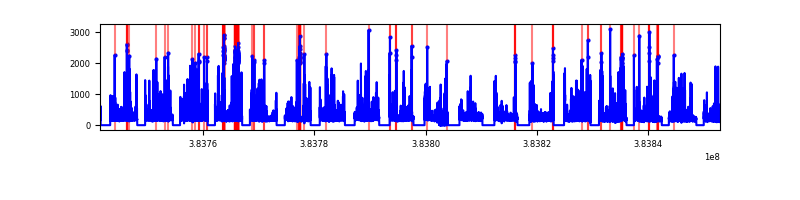 |
| C | 111306 | 81328 | 75 | 75 | 0.07% | 0.09% | 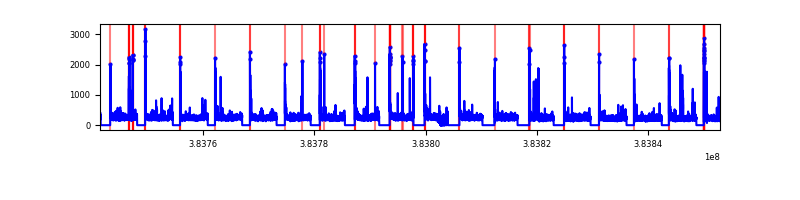 |
| D | 111306 | 81201 | 1076 | 1076 | 0.97% | 1.33% | 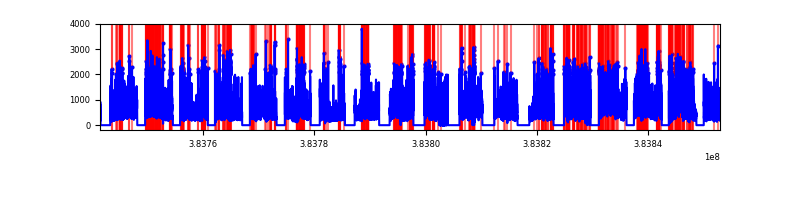 |
Top three noisy pixels from each quadrant. If the there are fewer than three noisy pixels in the level2.evt file, extra rows are filled as -1
| Pixel properties | Quadrant properties | ||||||
|---|---|---|---|---|---|---|---|
| Quadrant | DetID | PixID | Counts | Sigma | Mean | Median | Sigma |
| A | 15 | 169 | 8602394 | 9412.97 | 4123 | 4070 | 913.5 |
| A | 10 | 83 | 494403 | 536.79 | 4123 | 4070 | 913.5 |
| A | 9 | 143 | 401845 | 435.46 | 4123 | 4070 | 913.5 |
| B | 5 | 172 | 2700528 | 3267.27 | 4170 | 4089 | 825.3 |
| B | 4 | 171 | 436144 | 523.52 | 4170 | 4089 | 825.3 |
| B | 4 | 232 | 286989 | 342.79 | 4170 | 4089 | 825.3 |
| C | 15 | 214 | 3261927 | 3459.04 | 4088 | 4067 | 941.8 |
| C | 0 | 10 | 1056468 | 1117.39 | 4088 | 4067 | 941.8 |
| C | 0 | 207 | 430721 | 453.0 | 4088 | 4067 | 941.8 |
| D | 8 | 195 | 15165933 | 14562.41 | 3933 | 3831 | 1041.2 |
| D | 2 | 250 | 7186594 | 6898.67 | 3933 | 3831 | 1041.2 |
| D | 1 | 20 | 5334864 | 5120.18 | 3933 | 3831 | 1041.2 |
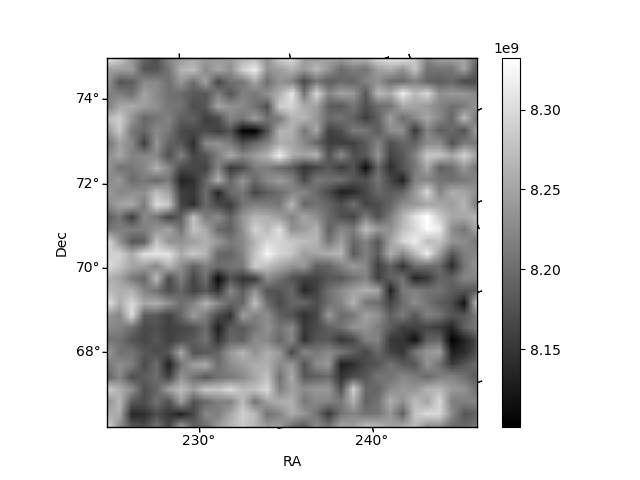
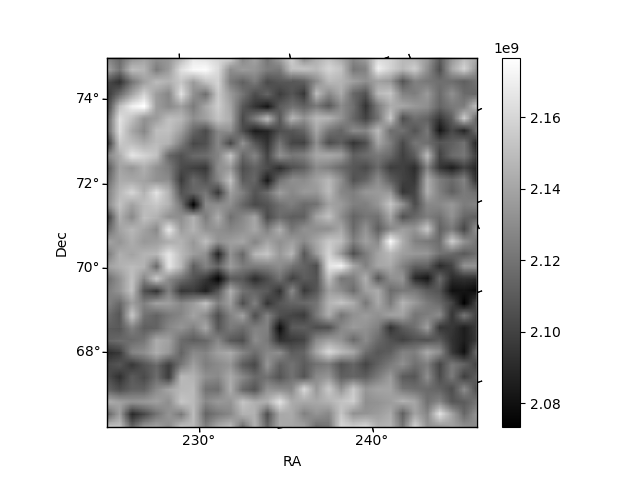
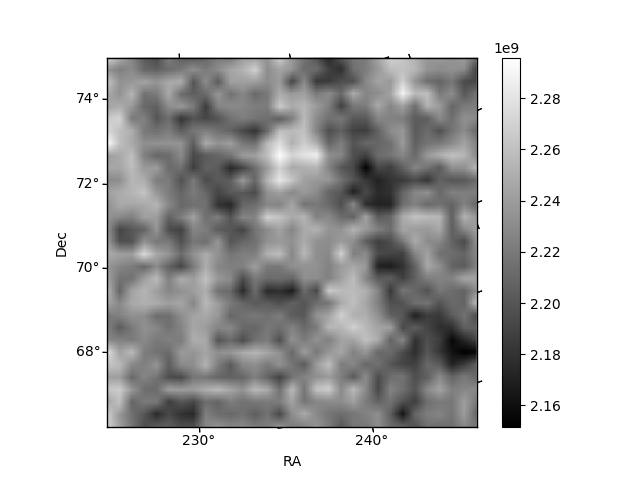
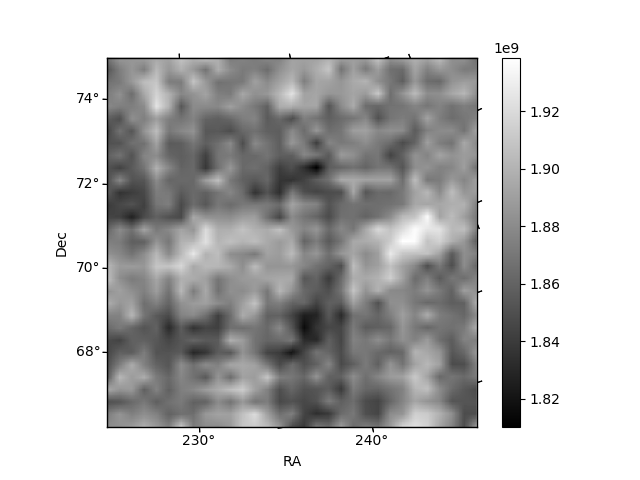
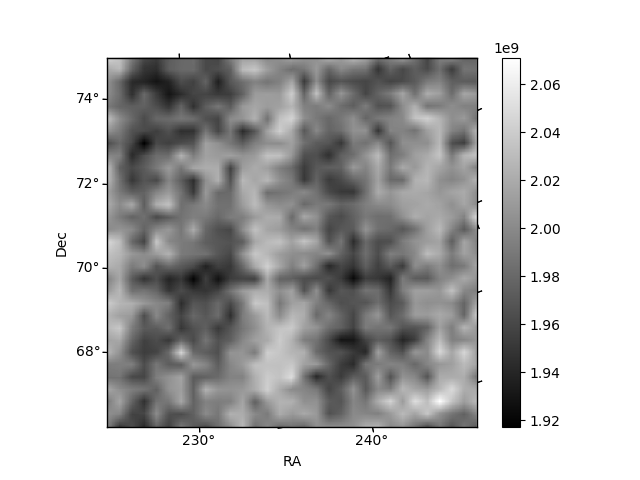
Histogram calculated using DETX and DETY for each event in the final _common_clean file
| Quadrant A | 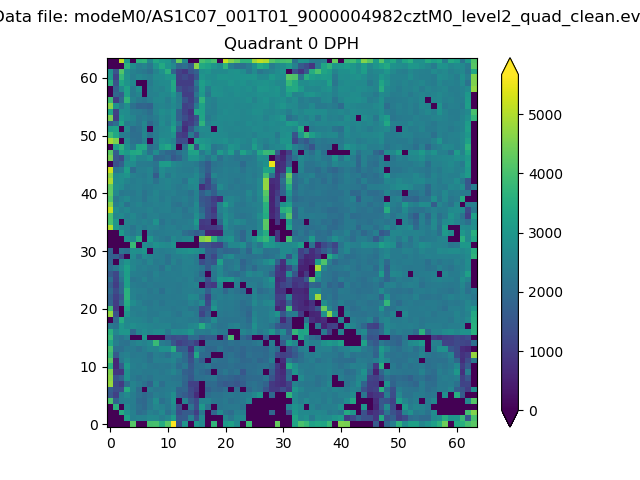 |
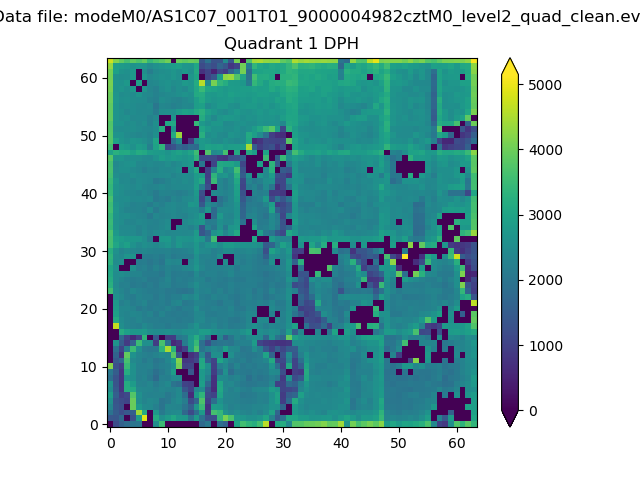 |
Quadrant B |
|---|---|---|---|
| Quadrant D | 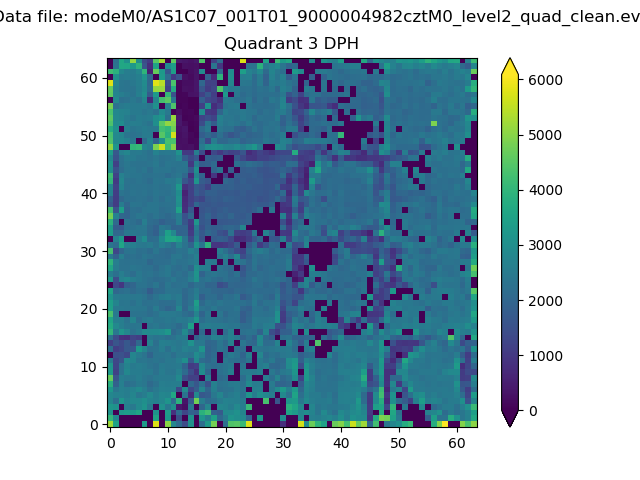 |
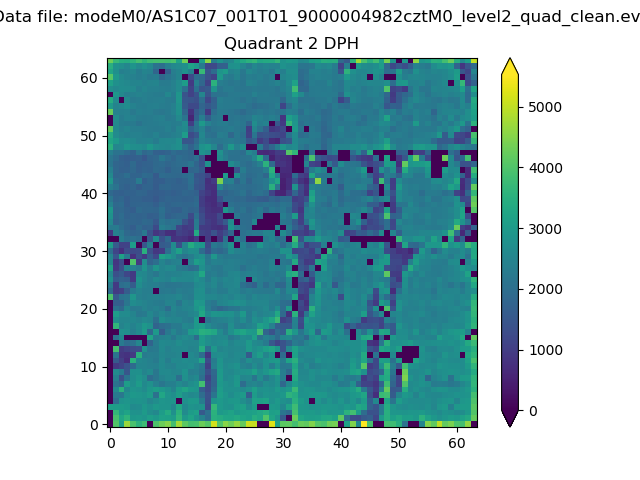 |
Quadrant C |
| Plot type | Count rate plots | Images |
|---|---|---|
| Comparison with Poisson distribution Blue bars denote a histogram of data divided into 1 sec bins. Red curve is a Poisson curve with rate = median count rate of data. |
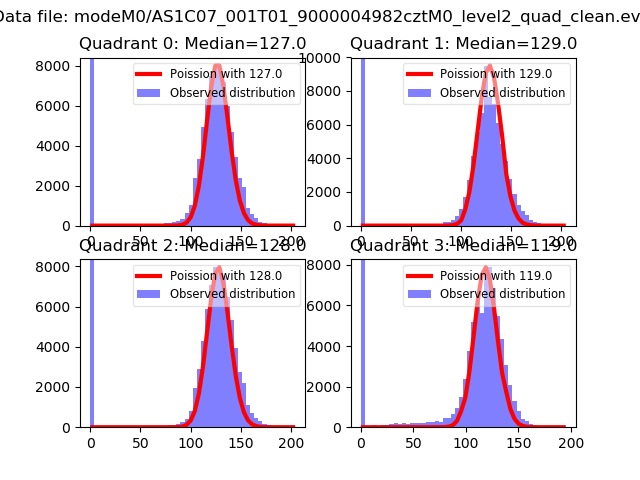 |
 |
| Quadrant-wise count rates Data is divided into 100 sec bins |
 |
|
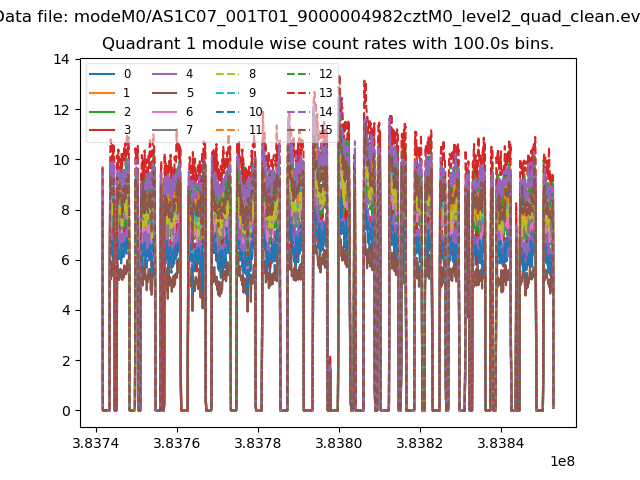
| Module-wise count rates for Quadrant A Data is divided into 100 sec bins |
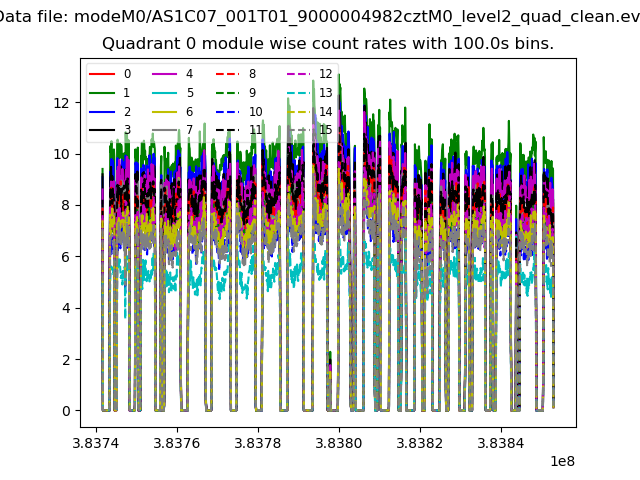 |
 |
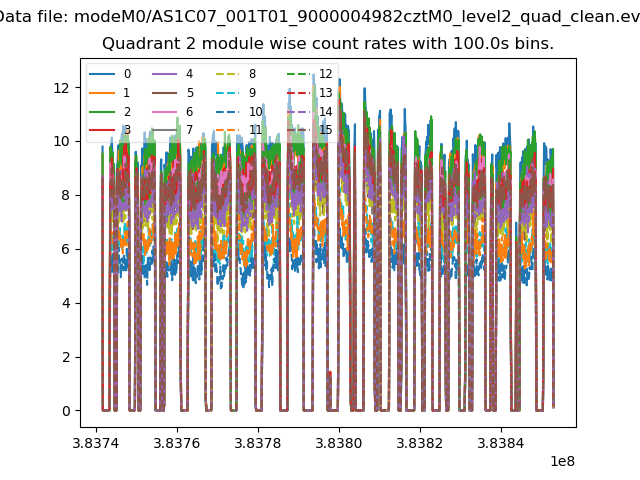
| Module-wise count rates for Quadrant B Data is divided into 100 sec bins |
 |
 |
| Module-wise count rates for Quadrant C Data is divided into 100 sec bins |
 |
 |
| Module-wise count rates for Quadrant D Data is divided into 100 sec bins |
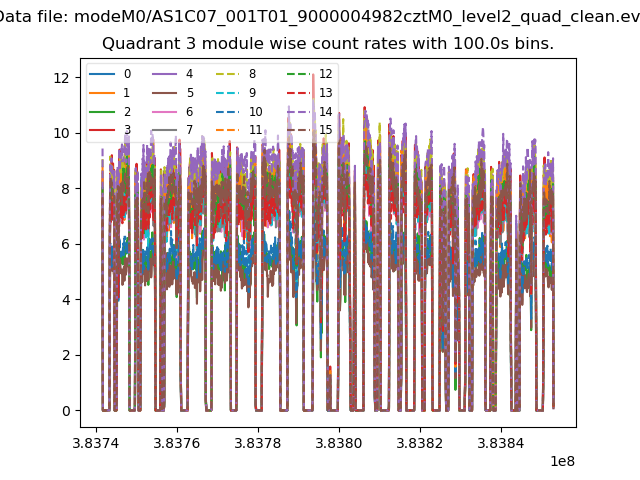 |
 |
| Parameter | Plot |
|---|---|
| CZT HV Monitor | 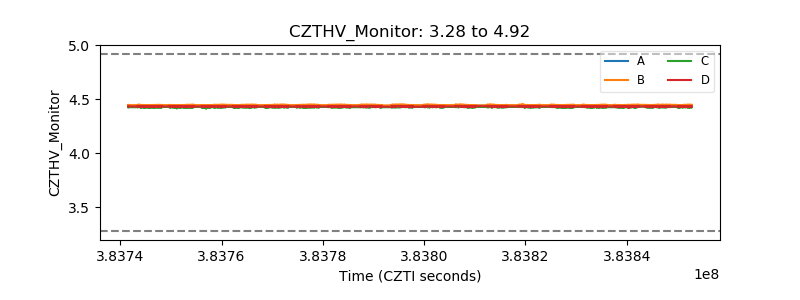 |
| D_VDD | 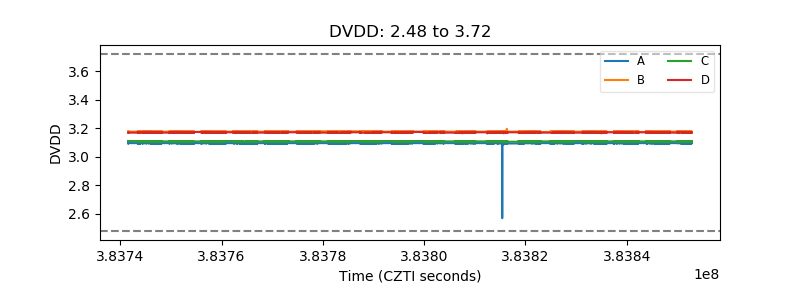 |
| Temperature 1 | 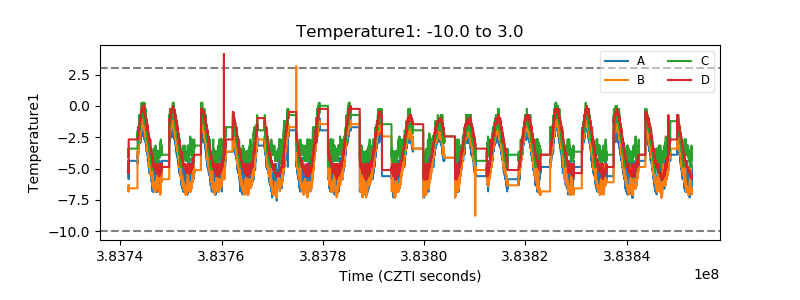 |
| Veto HV Monitor | 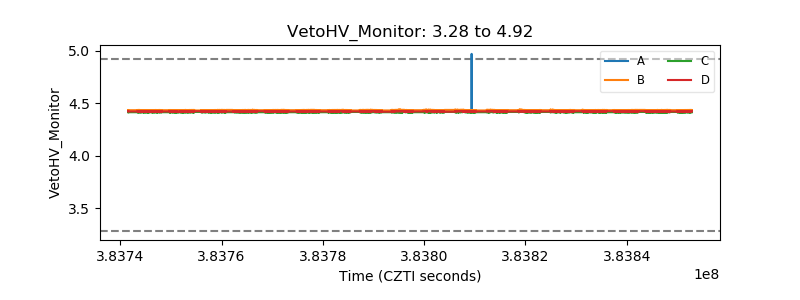 |
| Veto LLD | 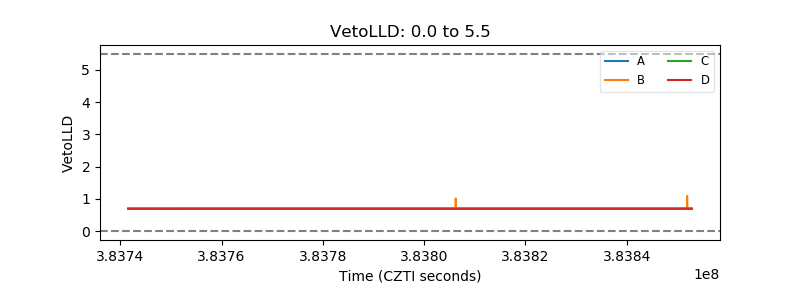 |
| Alpha Counter | 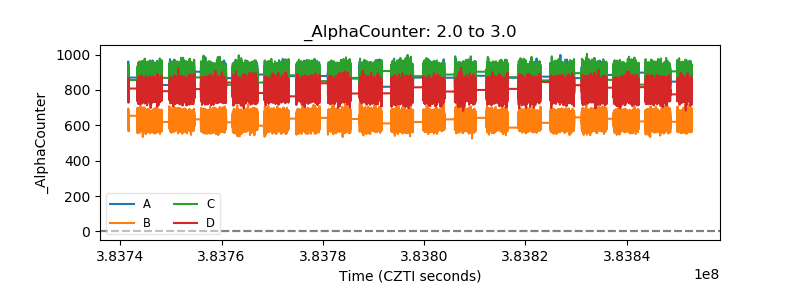 |
| _CPM_Rate | 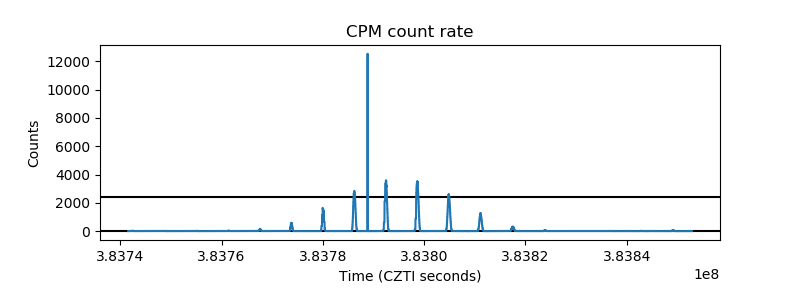 |
| CZT Counter | 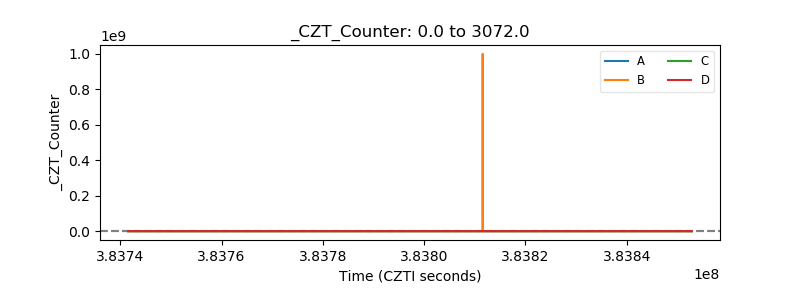 |
| +2.5 Volts monitor | 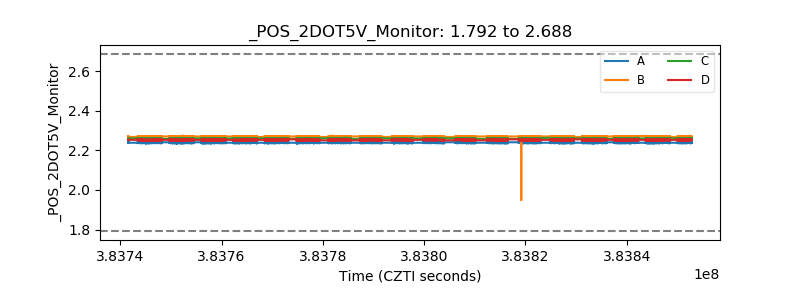 |
| +5 Volts monitor | 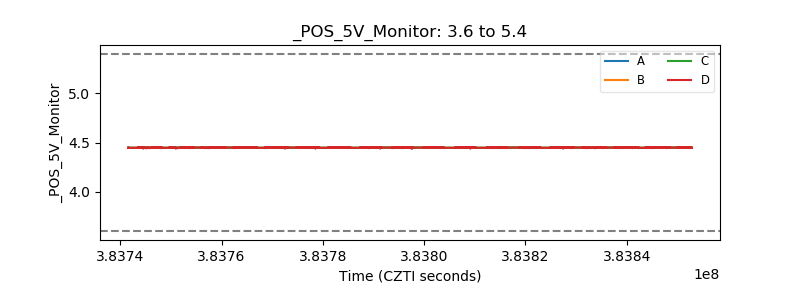 |
| _ROLL_ROT | 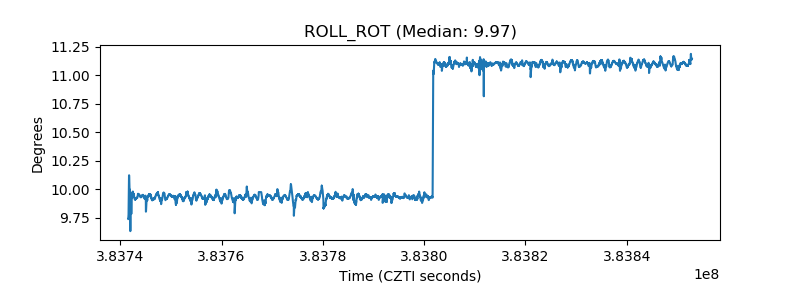 |
| _Roll_DEC | 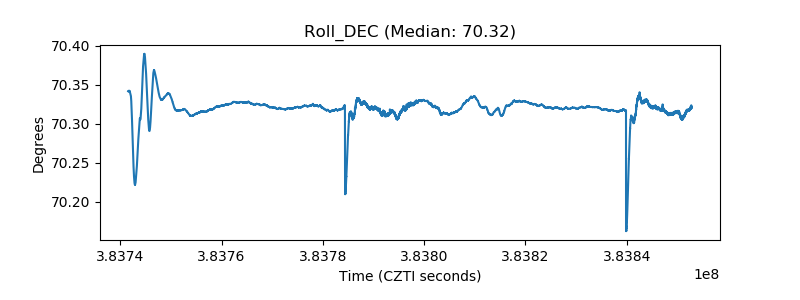 |
| _Roll_RA | 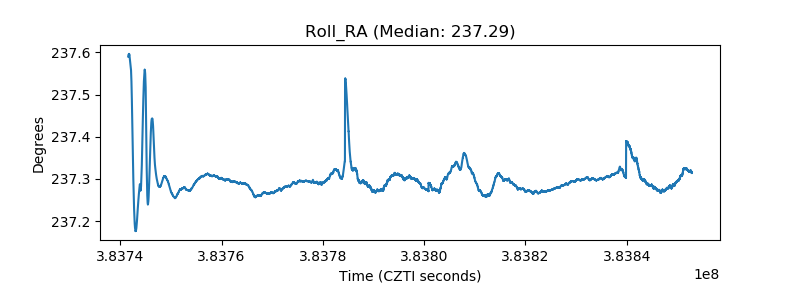 |
| Veto Counter | 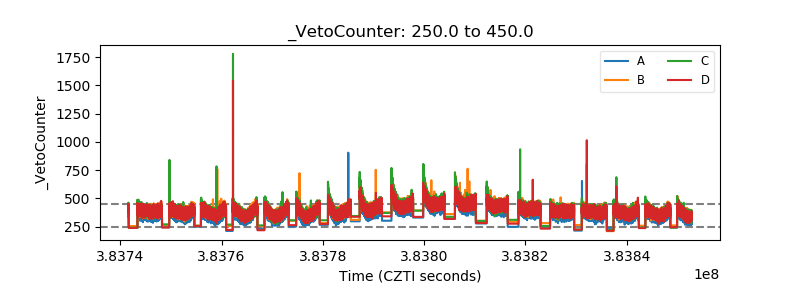 |