| Param | Original file | Final file |
|---|---|---|
| Filename | modeM0/AS1A09_038T41_9000004978_34714cztM0_level2.evt | modeM0/AS1A09_038T41_9000004978_34714cztM0_level2_quad_clean.evt |
| Size (bytes) | 327,605,760 | 71,657,280 |
| Size | 312.4 MB | 68.3 MB |
| Events in quadrant A | 2,288,100 | 483,979 |
| Events in quadrant B | 2,223,284 | 483,589 |
| Events in quadrant C | 1,830,813 | 494,779 |
| Events in quadrant D | 3,337,416 | 456,011 |
| Mode SS | |||
|---|---|---|---|
| Quadrant | BADHDUFLAG | Total packets | Discarded packets |
| A | 0 | 70 | 0 |
| B | 0 | 70 | 0 |
| C | 0 | 70 | 0 |
| D | 0 | 70 | 0 |
| Mode M9 | |||
|---|---|---|---|
| Quadrant | BADHDUFLAG | Total packets | Discarded packets |
| A | 0 | 2 | 0 |
| B | 0 | 2 | 0 |
| C | 0 | 2 | 0 |
| D | 0 | 3 | 0 |
| Mode M0 | |||
|---|---|---|---|
| Quadrant | BADHDUFLAG | Total packets | Discarded packets |
| A | 0 | 9071 | 1 |
| B | 0 | 8842 | 1 |
| C | 0 | 7473 | 1 |
| D | 0 | 12308 | 1 |
| Quadrant | Total seconds | Saturated seconds | Saturation percentage |
|---|---|---|---|
| A | 3555 | 12 | 0.337553% |
| B | 3555 | 146 | 4.106892% |
| C | 3555 | 25 | 0.703235% |
| D | 3555 | 180 | 5.063291% |
Noise dominated data is calculated using 1-second bins in cleaned event files. If a bin has >2000 counts, and if more than 50% of those come from <1% of pixels, then it is considered to be noise-dominated and hence unusable.
| Quadrant | # 1 sec bins | Bins with >0 counts | Bins with >2000 counts | High rate bins dominated by noise | Noise dominated (total time) | Noise dominated (detector-on time) | Marked lightcurve |
|---|---|---|---|---|---|---|---|
| A | 3555 | 3555 | 4 | 4 | 0.11% | 0.11% | 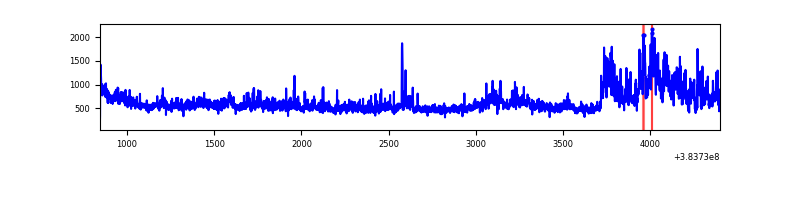 |
| B | 3555 | 3555 | 115 | 115 | 3.23% | 3.23% | 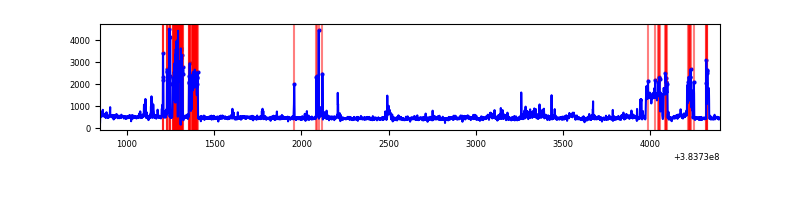 |
| C | 3555 | 3555 | 15 | 15 | 0.42% | 0.42% | 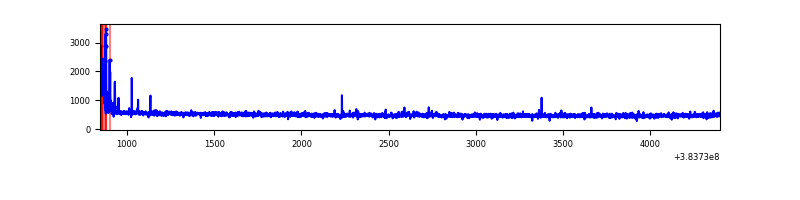 |
| D | 3555 | 3555 | 189 | 189 | 5.32% | 5.32% |  |
Top three noisy pixels from each quadrant. If the there are fewer than three noisy pixels in the level2.evt file, extra rows are filled as -1
| Pixel properties | Quadrant properties | ||||||
|---|---|---|---|---|---|---|---|
| Quadrant | DetID | PixID | Counts | Sigma | Mean | Median | Sigma |
| A | 15 | 169 | 575594 | 6700.56 | 422 | 414 | 85.8 |
| A | 10 | 83 | 27836 | 319.45 | 422 | 414 | 85.8 |
| A | 13 | 6 | 23157 | 264.94 | 422 | 414 | 85.8 |
| B | 5 | 172 | 284386 | 3672.73 | 407 | 399 | 77.3 |
| B | 0 | 182 | 183269 | 2365.01 | 407 | 399 | 77.3 |
| B | 4 | 81 | 47036 | 603.14 | 407 | 399 | 77.3 |
| C | 15 | 214 | 156643 | 1673.16 | 405 | 409 | 93.4 |
| C | 0 | 10 | 68680 | 731.14 | 405 | 409 | 93.4 |
| C | 14 | 67 | 11990 | 124.02 | 405 | 409 | 93.4 |
| D | 8 | 195 | 880985 | 8557.66 | 402 | 391 | 102.9 |
| D | 12 | 227 | 197695 | 1917.41 | 402 | 391 | 102.9 |
| D | 10 | 199 | 170543 | 1653.55 | 402 | 391 | 102.9 |
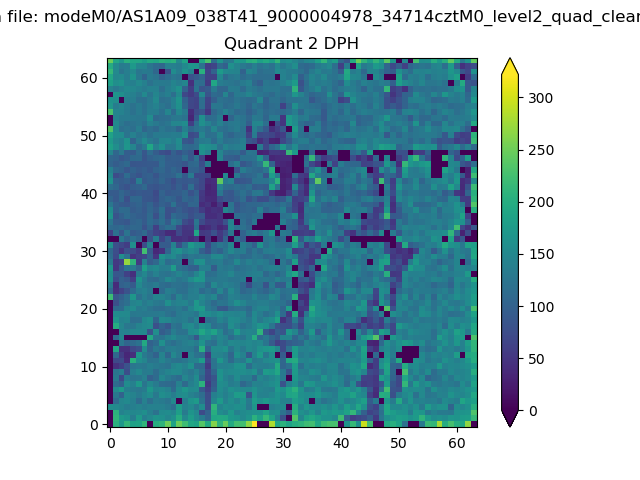
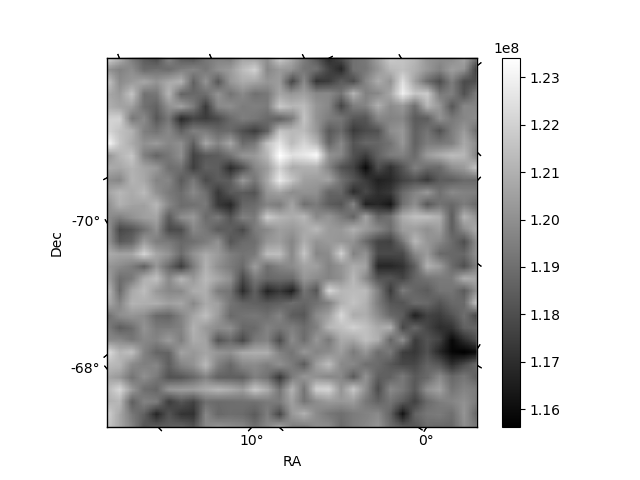
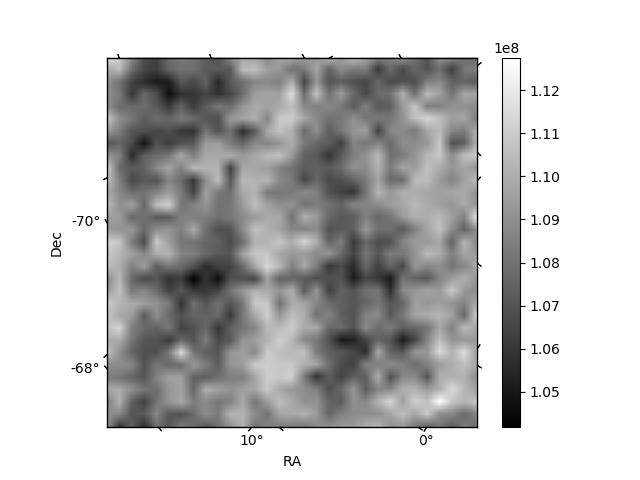
Histogram calculated using DETX and DETY for each event in the final _common_clean file
| Quadrant A | 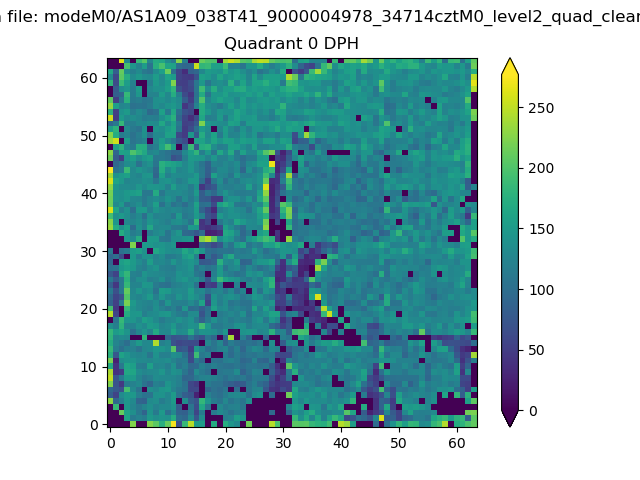 |
 |
Quadrant B |
|---|---|---|---|
| Quadrant D | 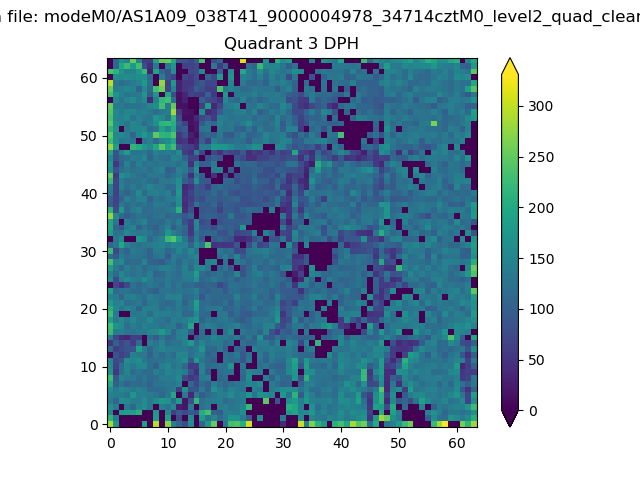 |
 |
Quadrant C |
| Plot type | Count rate plots | Images |
|---|---|---|
| Comparison with Poisson distribution Blue bars denote a histogram of data divided into 1 sec bins. Red curve is a Poisson curve with rate = median count rate of data. |
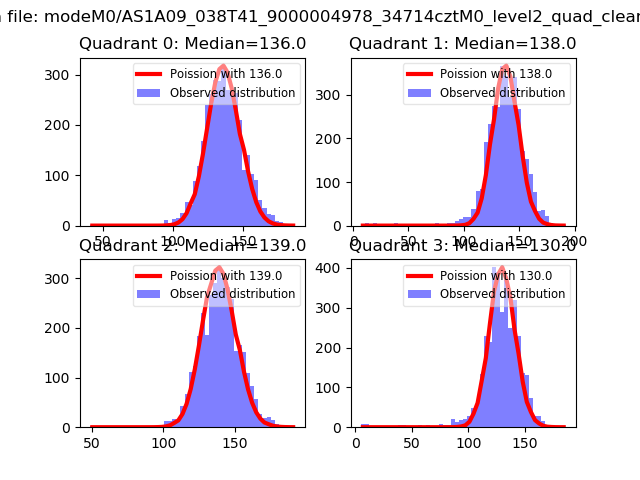 |
 |
| Quadrant-wise count rates Data is divided into 100 sec bins |
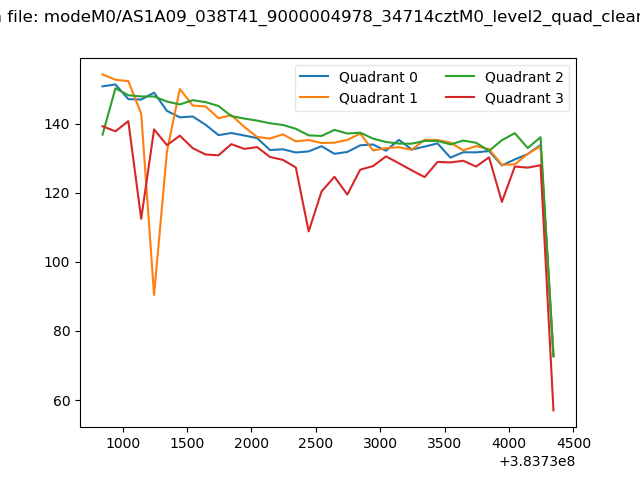 |
|
| Module-wise count rates for Quadrant A Data is divided into 100 sec bins |
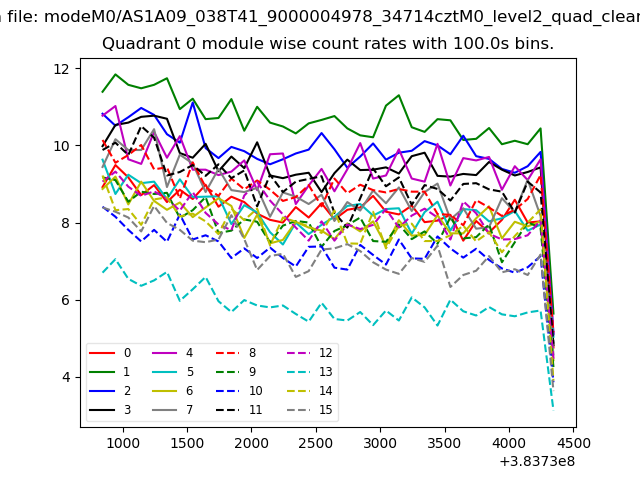 |
 |
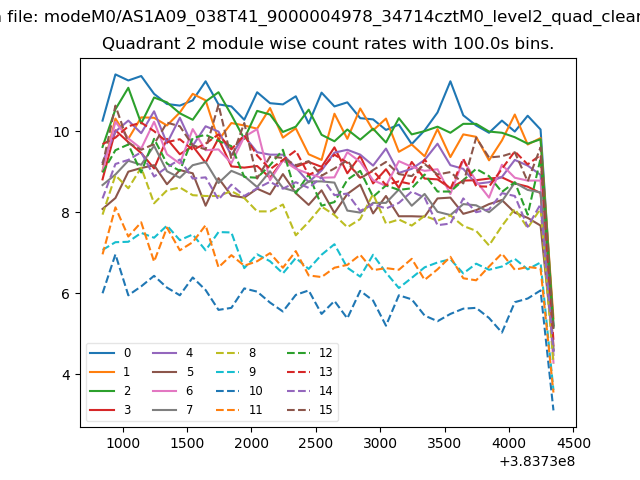
| Module-wise count rates for Quadrant B Data is divided into 100 sec bins |
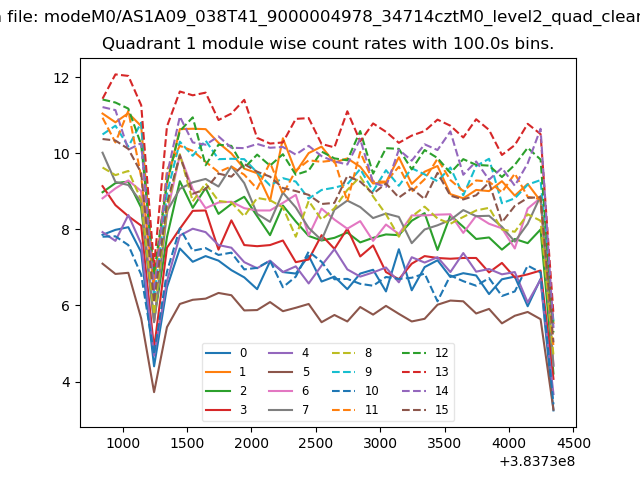 |
 |
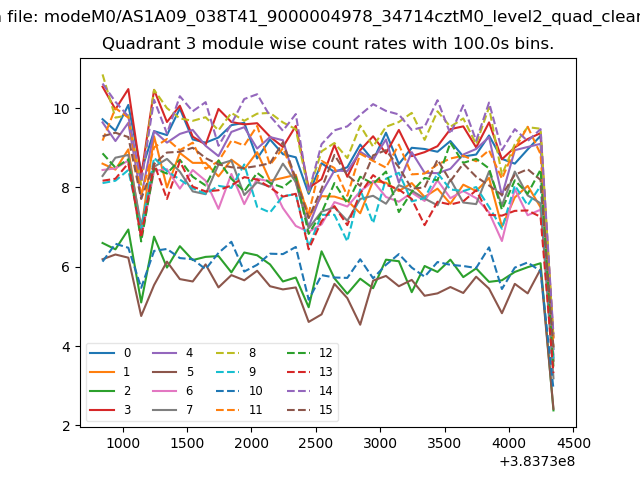
| Module-wise count rates for Quadrant C Data is divided into 100 sec bins |
 |
 |
| Module-wise count rates for Quadrant D Data is divided into 100 sec bins |
 |
 |
| Parameter | Plot |
|---|---|
| CZT HV Monitor | 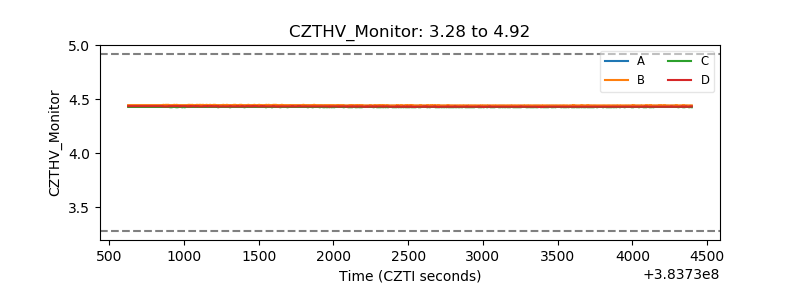 |
| D_VDD | 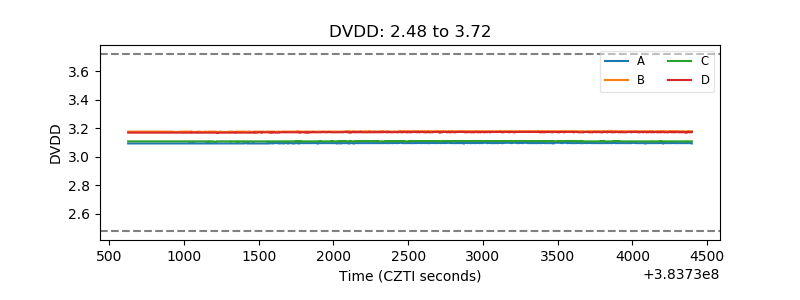 |
| Temperature 1 | 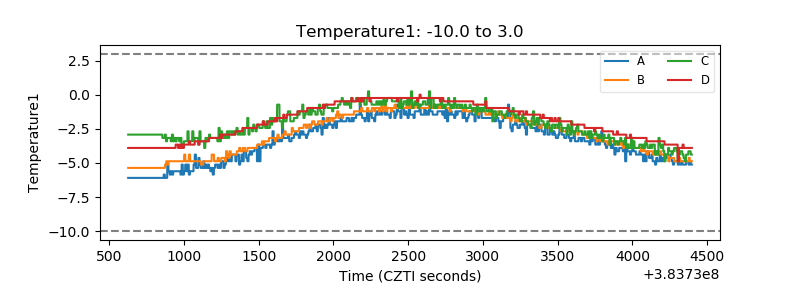 |
| Veto HV Monitor | 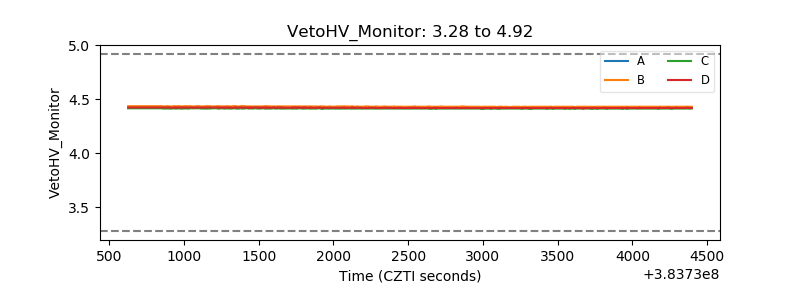 |
| Veto LLD | 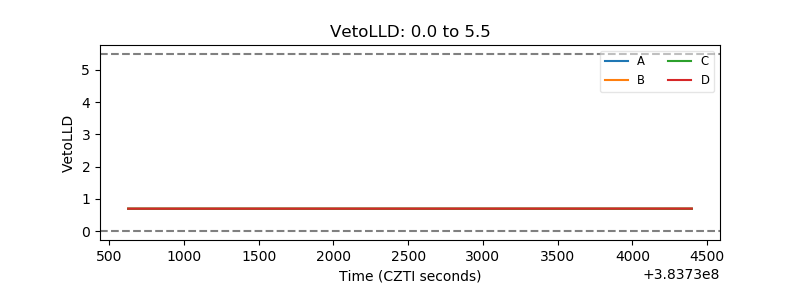 |
| Alpha Counter | 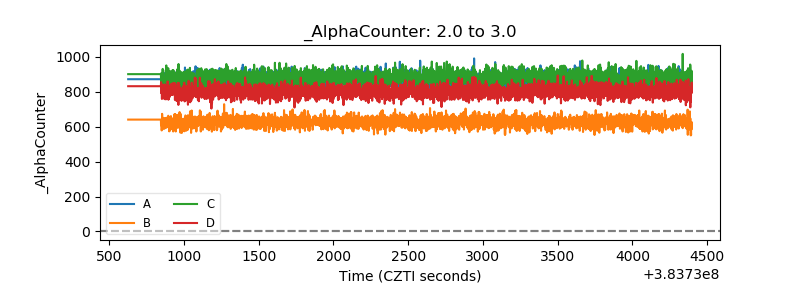 |
| _CPM_Rate | 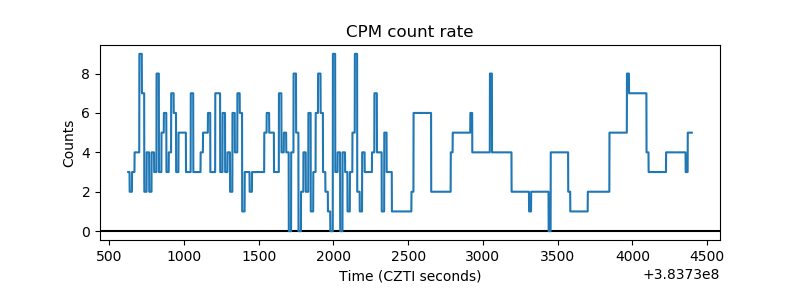 |
| CZT Counter | 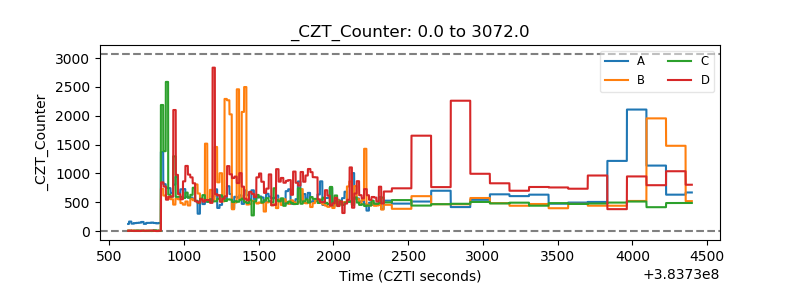 |
| +2.5 Volts monitor | 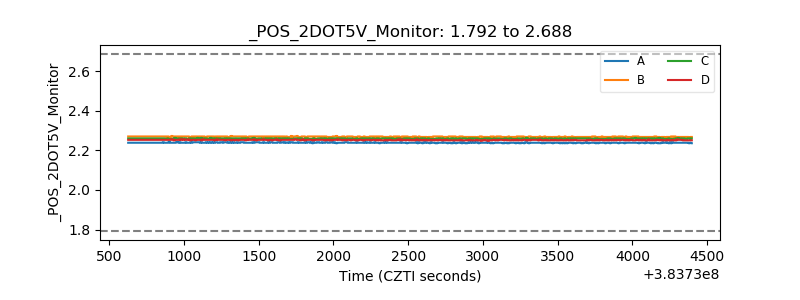 |
| +5 Volts monitor |  |
| _ROLL_ROT | 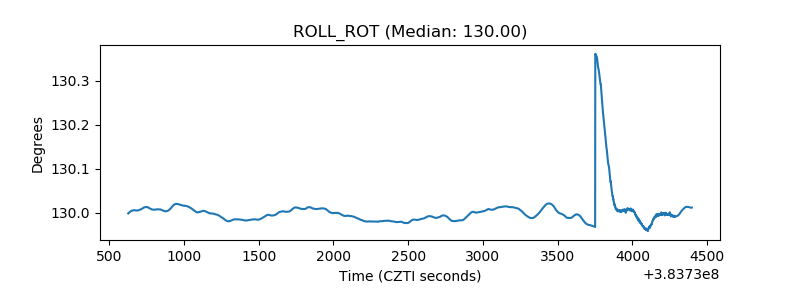 |
| _Roll_DEC | 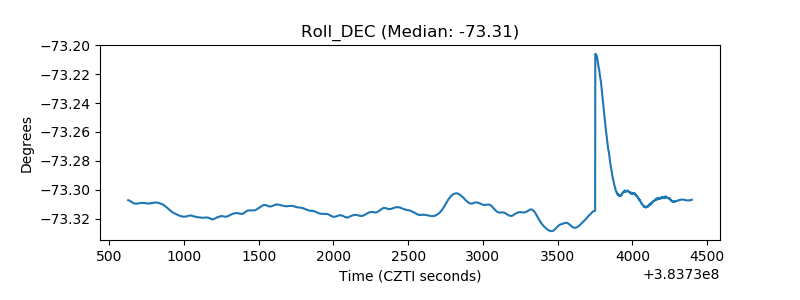 |
| _Roll_RA | 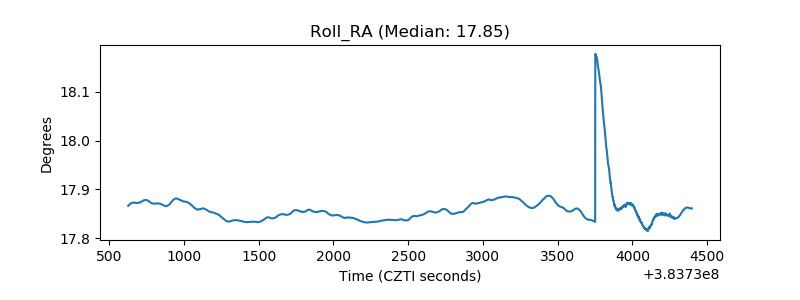 |
| Veto Counter | 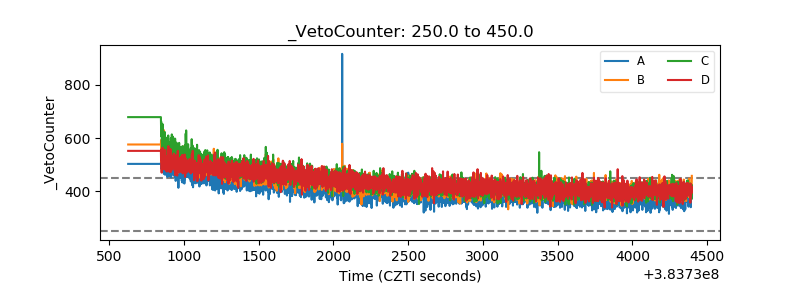 |