| Param | Original file | Final file |
|---|---|---|
| Filename | modeM0/AS1A09_038T41_9000004978_34712cztM0_level2.evt | modeM0/AS1A09_038T41_9000004978_34712cztM0_level2_quad_clean.evt |
| Size (bytes) | 73,667,520 | 18,311,040 |
| Size | 70.3 MB | 17.5 MB |
| Events in quadrant A | 647,465 | 123,852 |
| Events in quadrant B | 523,709 | 126,664 |
| Events in quadrant C | 504,735 | 125,171 |
| Events in quadrant D | 500,361 | 117,635 |
| Mode SS | |||
|---|---|---|---|
| Quadrant | BADHDUFLAG | Total packets | Discarded packets |
| A | 0 | 16 | 0 |
| B | 0 | 16 | 0 |
| C | 0 | 16 | 0 |
| D | 0 | 16 | 0 |
| Mode M9 | |||
|---|---|---|---|
| Quadrant | BADHDUFLAG | Total packets | Discarded packets |
| A | 0 | 20 | 0 |
| B | 0 | 20 | 0 |
| C | 0 | 20 | 0 |
| D | 0 | 20 | 0 |
| Mode M0 | |||
|---|---|---|---|
| Quadrant | BADHDUFLAG | Total packets | Discarded packets |
| A | 0 | 2484 | 2 |
| B | 0 | 1965 | 1 |
| C | 0 | 2026 | 1 |
| D | 0 | 1984 | 1 |
| Quadrant | Total seconds | Saturated seconds | Saturation percentage |
|---|---|---|---|
| A | 759 | 12 | 1.581028% |
| B | 759 | 38 | 5.006588% |
| C | 759 | 10 | 1.317523% |
| D | 759 | 1 | 0.131752% |
Noise dominated data is calculated using 1-second bins in cleaned event files. If a bin has >2000 counts, and if more than 50% of those come from <1% of pixels, then it is considered to be noise-dominated and hence unusable.
| Quadrant | # 1 sec bins | Bins with >0 counts | Bins with >2000 counts | High rate bins dominated by noise | Noise dominated (total time) | Noise dominated (detector-on time) | Marked lightcurve |
|---|---|---|---|---|---|---|---|
| A | 759 | 759 | 5 | 5 | 0.66% | 0.66% | 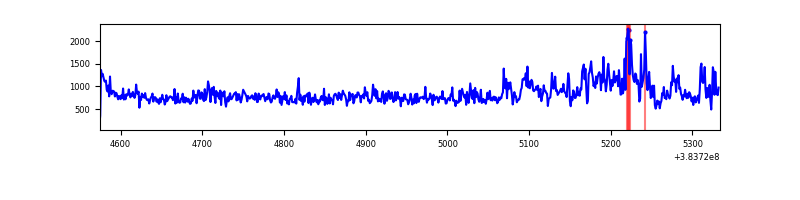 |
| B | 759 | 759 | 23 | 23 | 3.03% | 3.03% | 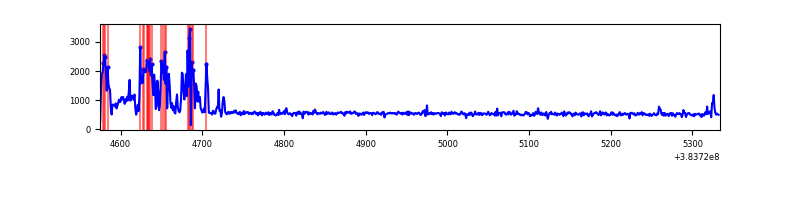 |
| C | 759 | 759 | 14 | 14 | 1.84% | 1.84% | 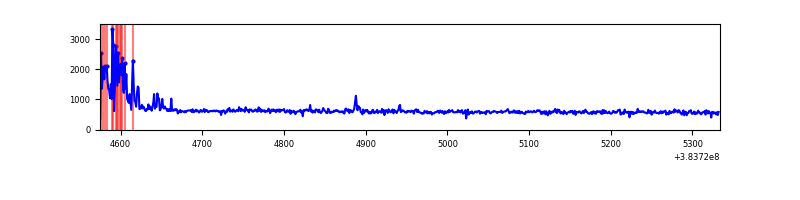 |
| D | 759 | 759 | 0 | 0 | 0.00% | 0.00% | 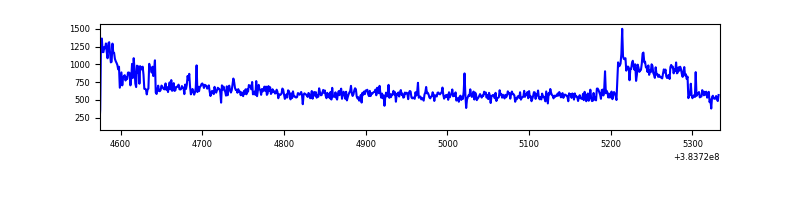 |
Top three noisy pixels from each quadrant. If the there are fewer than three noisy pixels in the level2.evt file, extra rows are filled as -1
| Pixel properties | Quadrant properties | ||||||
|---|---|---|---|---|---|---|---|
| Quadrant | DetID | PixID | Counts | Sigma | Mean | Median | Sigma |
| A | 15 | 169 | 220023 | 9603.02 | 104 | 102 | 22.9 |
| A | 10 | 83 | 19233 | 835.37 | 104 | 102 | 22.9 |
| A | 13 | 6 | 1370 | 55.37 | 104 | 102 | 22.9 |
| B | 5 | 172 | 88313 | 4177.11 | 103 | 101 | 21.1 |
| B | 0 | 155 | 27886 | 1315.71 | 103 | 101 | 21.1 |
| B | 4 | 171 | 3604 | 165.88 | 103 | 101 | 21.1 |
| C | 0 | 10 | 55147 | 2144.27 | 104 | 105 | 25.7 |
| C | 15 | 214 | 36399 | 1413.91 | 104 | 105 | 25.7 |
| C | 7 | 173 | 1598 | 58.16 | 104 | 105 | 25.7 |
| D | 8 | 195 | 100481 | 3777.17 | 103 | 100 | 26.6 |
| D | 2 | 234 | 2733 | 99.08 | 103 | 100 | 26.6 |
| D | 3 | 238 | 2723 | 98.7 | 103 | 100 | 26.6 |
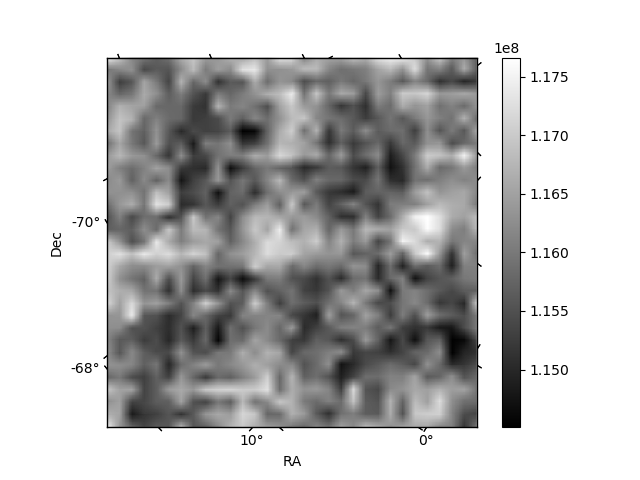
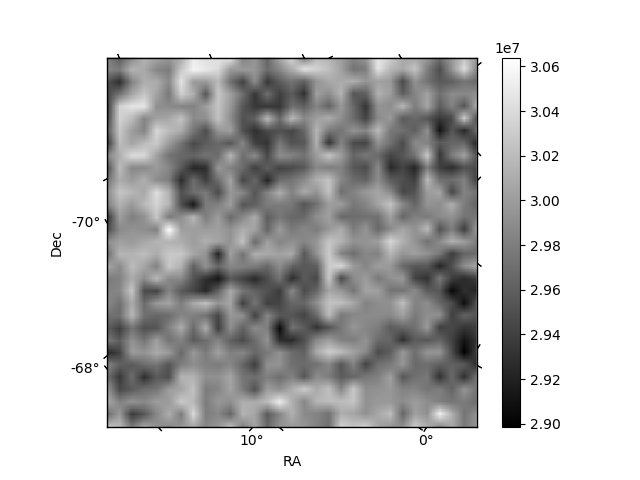
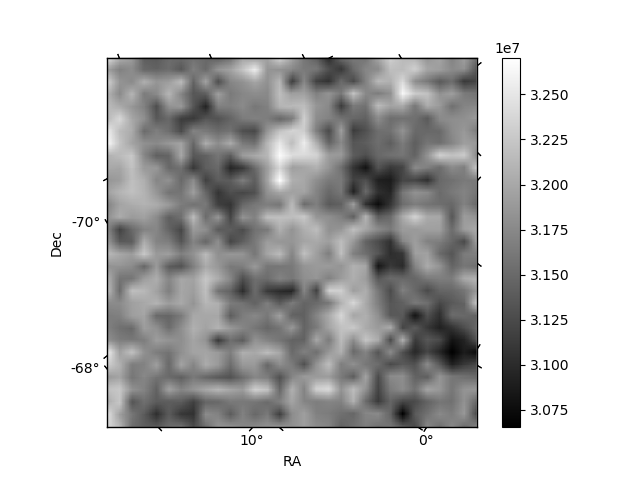
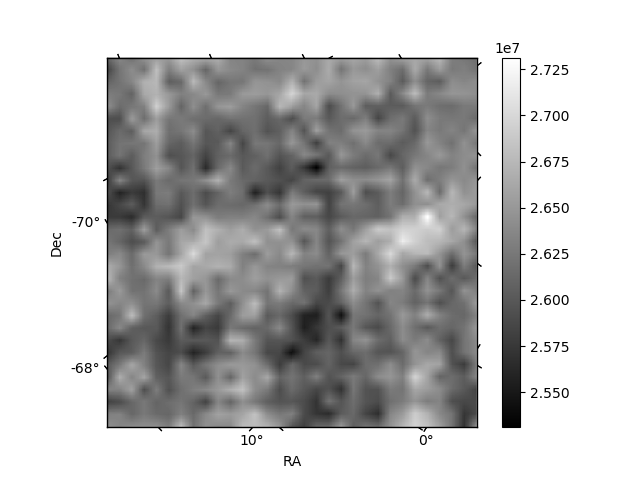
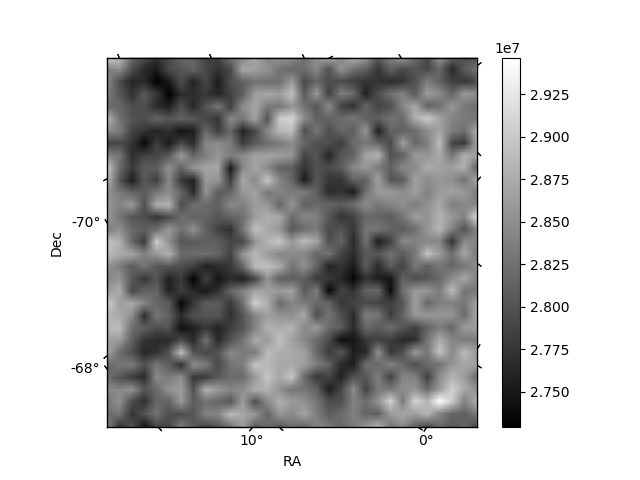
Histogram calculated using DETX and DETY for each event in the final _common_clean file
| Quadrant A | 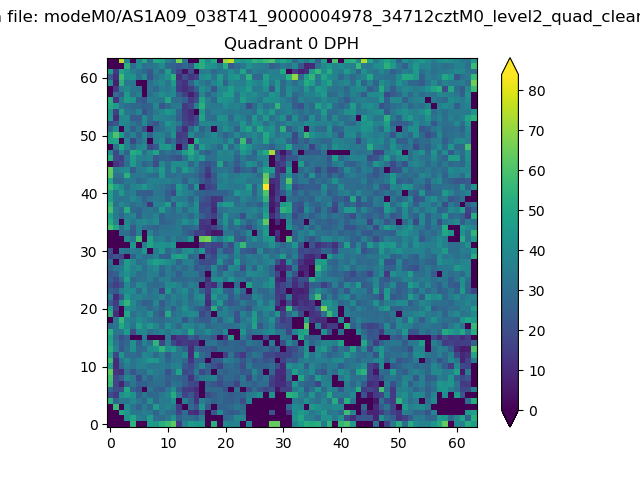 |
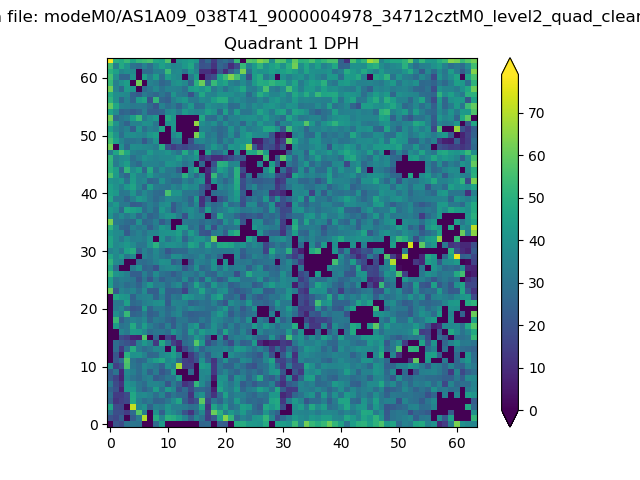 |
Quadrant B |
|---|---|---|---|
| Quadrant D | 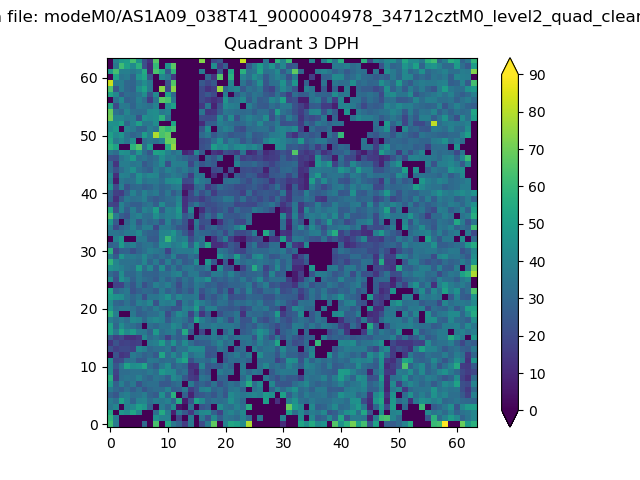 |
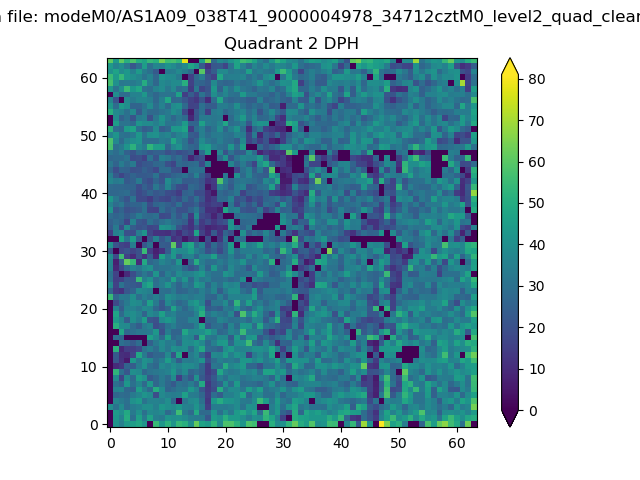 |
Quadrant C |
| Plot type | Count rate plots | Images |
|---|---|---|
| Comparison with Poisson distribution Blue bars denote a histogram of data divided into 1 sec bins. Red curve is a Poisson curve with rate = median count rate of data. |
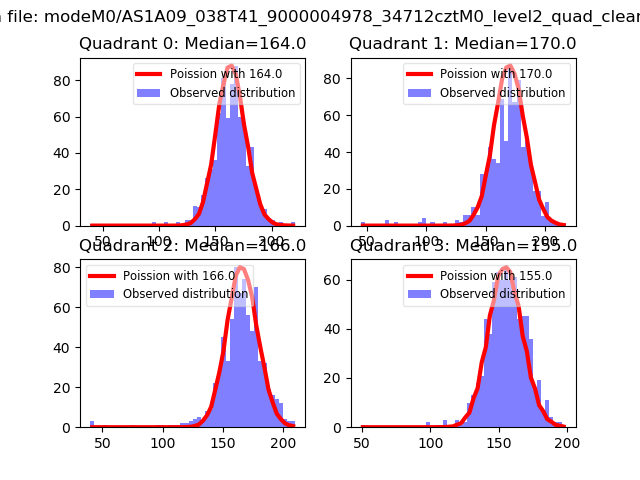 |
 |
| Quadrant-wise count rates Data is divided into 100 sec bins |
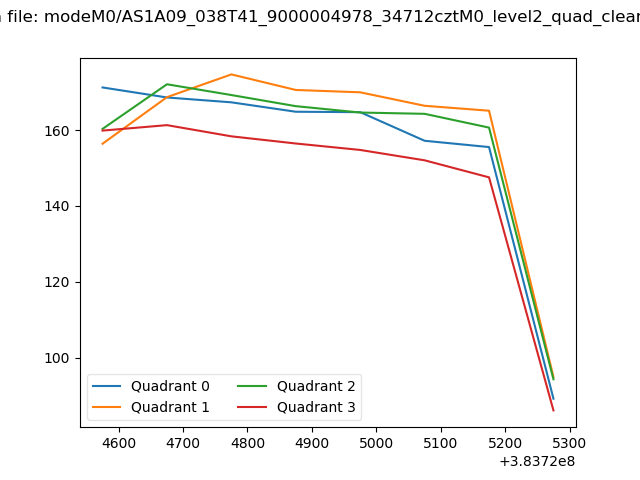 |
|
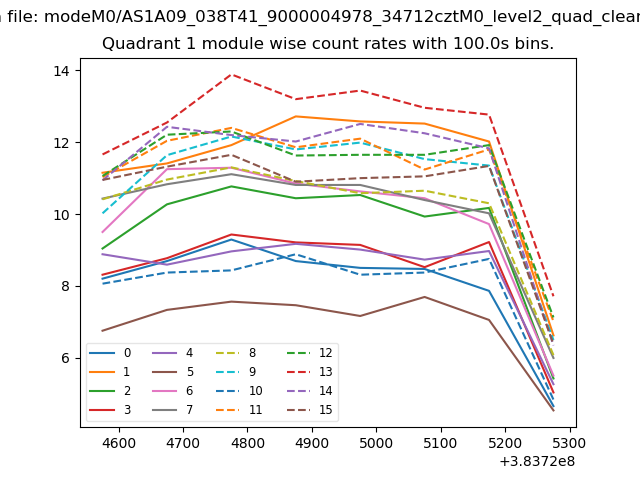
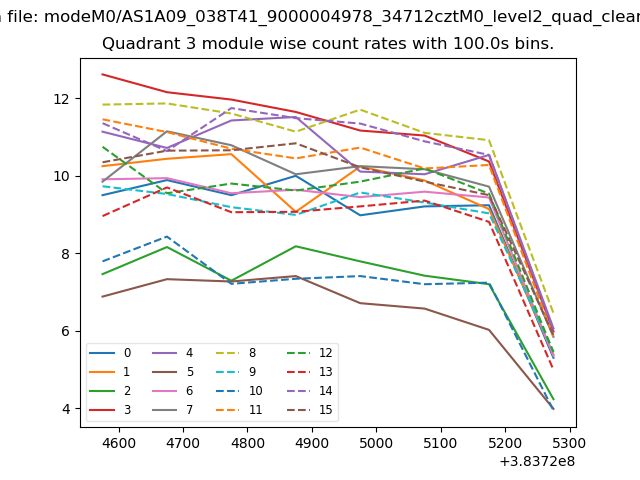
| Module-wise count rates for Quadrant A Data is divided into 100 sec bins |
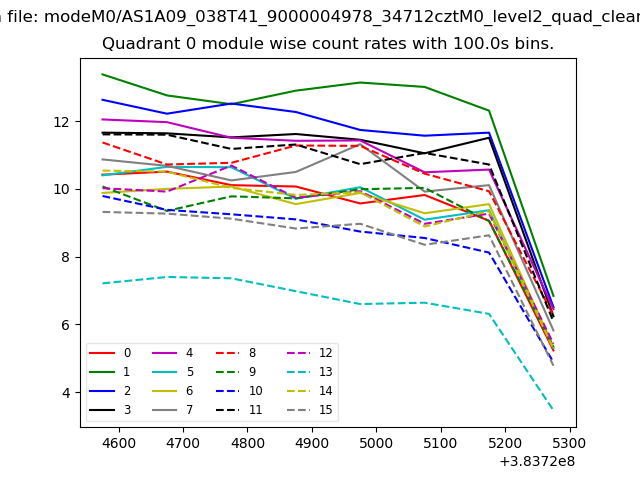 |
 |
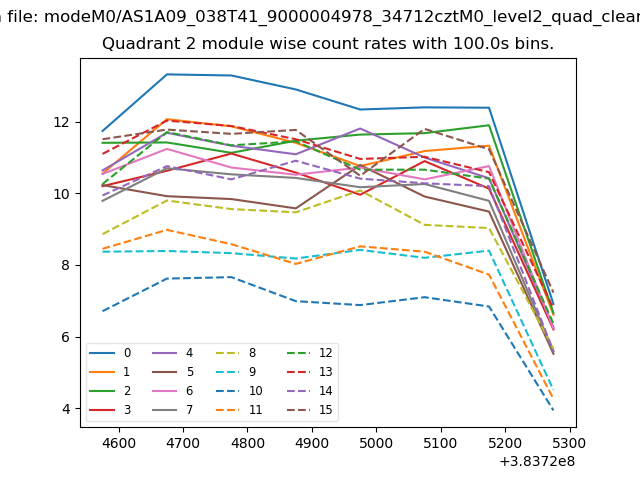
| Module-wise count rates for Quadrant B Data is divided into 100 sec bins |
 |
 |
| Module-wise count rates for Quadrant C Data is divided into 100 sec bins |
 |
 |
| Module-wise count rates for Quadrant D Data is divided into 100 sec bins |
 |
 |
| Parameter | Plot |
|---|---|
| CZT HV Monitor | 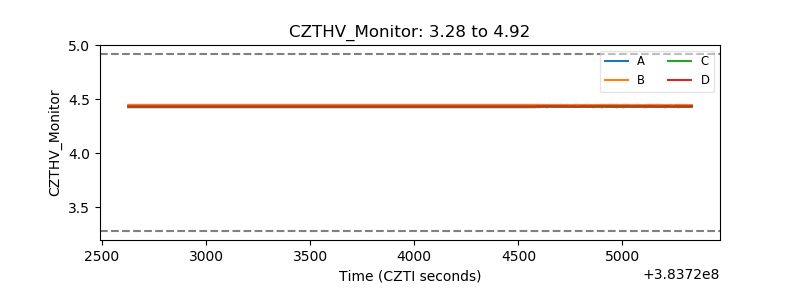 |
| D_VDD | 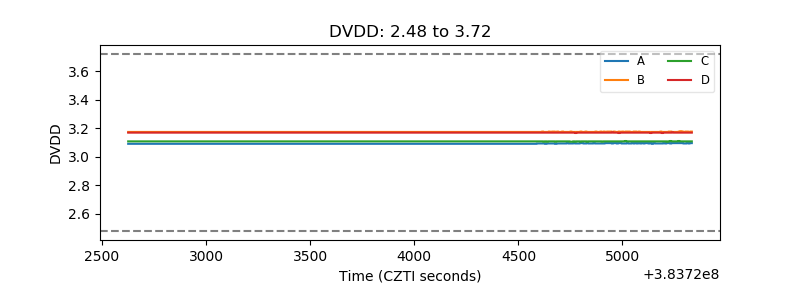 |
| Temperature 1 | 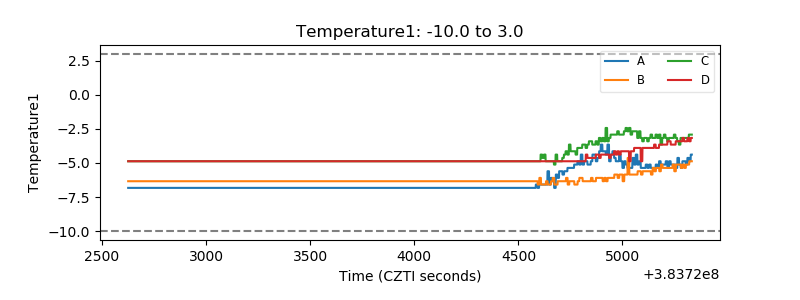 |
| Veto HV Monitor | 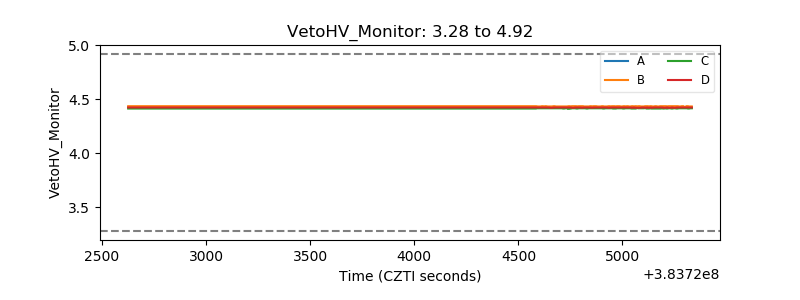 |
| Veto LLD | 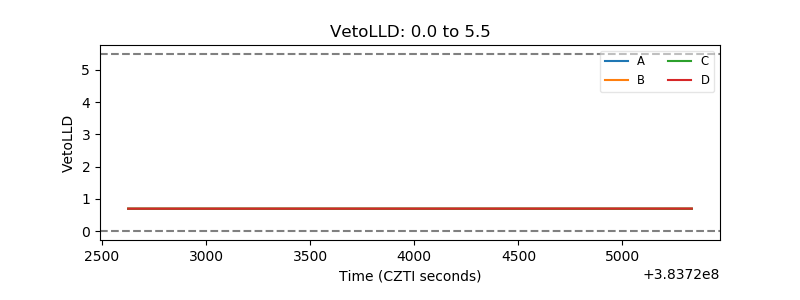 |
| Alpha Counter | 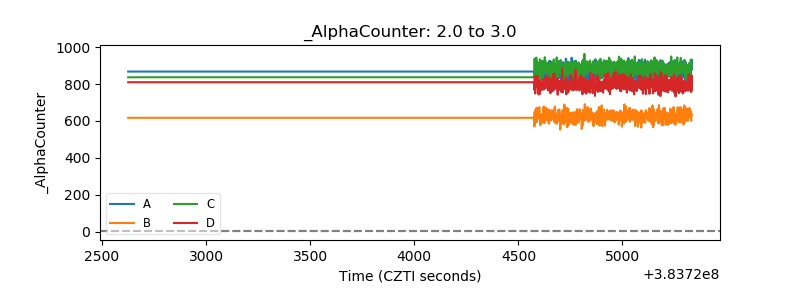 |
| _CPM_Rate | 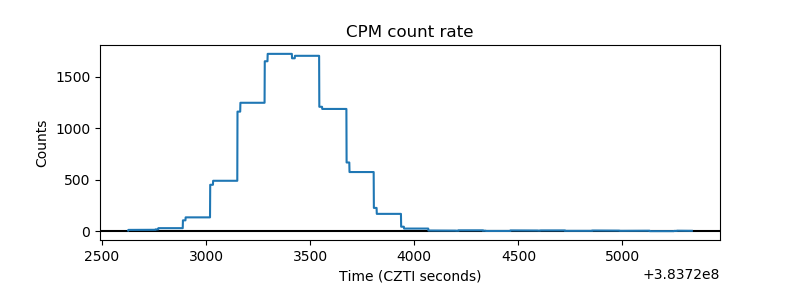 |
| CZT Counter | 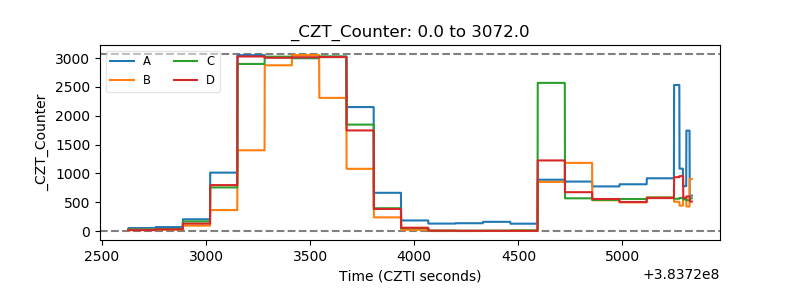 |
| +2.5 Volts monitor | 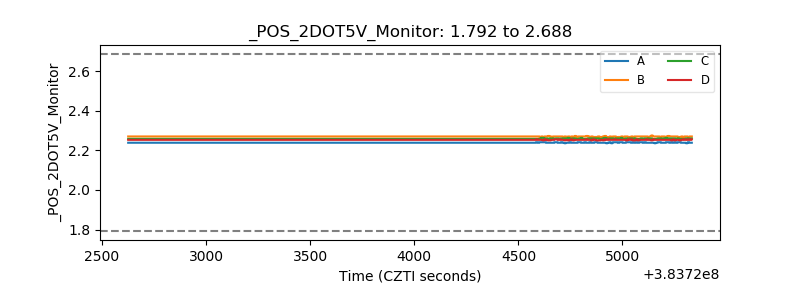 |
| +5 Volts monitor | 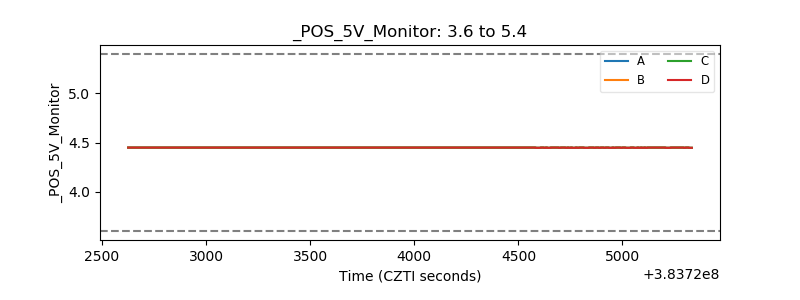 |
| _ROLL_ROT | 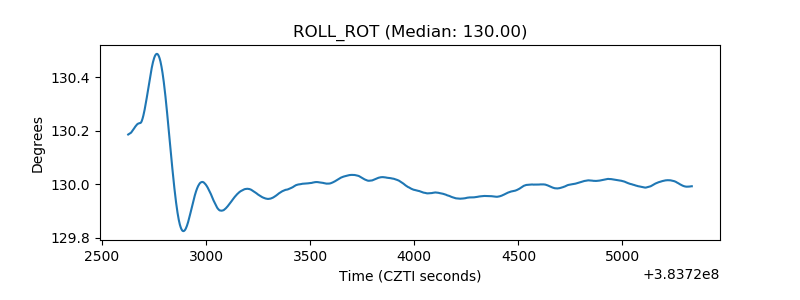 |
| _Roll_DEC | 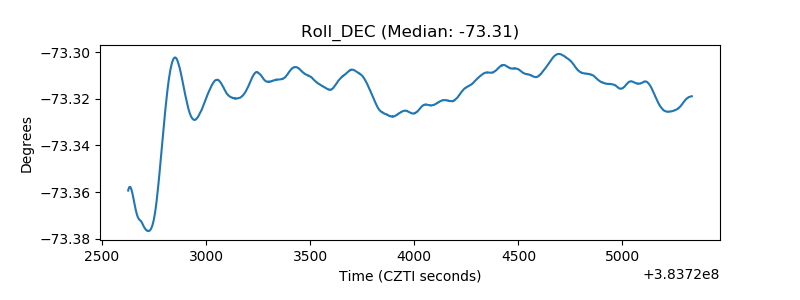 |
| _Roll_RA | 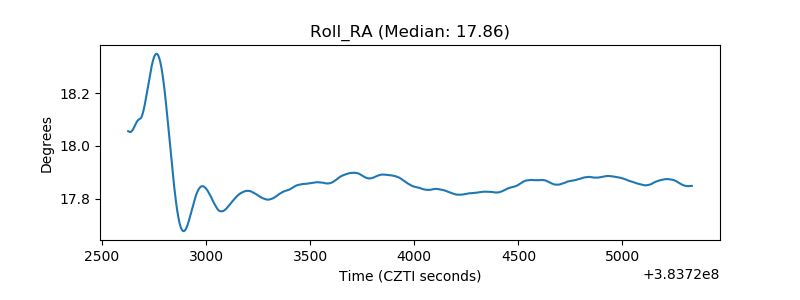 |
| Veto Counter | 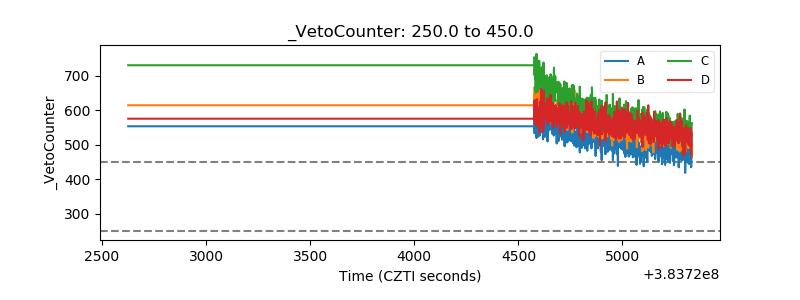 |