| Param | Original file | Final file |
|---|---|---|
| Filename | modeM0/AS1A11_069T01_9000004972_34707cztM0_level2.evt | modeM0/AS1A11_069T01_9000004972_34707cztM0_level2_quad_clean.evt |
| Size (bytes) | 939,412,800 | 124,882,560 |
| Size | 895.9 MB | 119.1 MB |
| Events in quadrant A | 7,284,320 | 780,629 |
| Events in quadrant B | 5,362,759 | 789,293 |
| Events in quadrant C | 5,279,521 | 770,296 |
| Events in quadrant D | 9,817,709 | 717,191 |
| Mode M9 | |||
|---|---|---|---|
| Quadrant | BADHDUFLAG | Total packets | Discarded packets |
| A | 0 | 29 | 0 |
| B | 0 | 29 | 0 |
| C | 0 | 29 | 0 |
| D | 0 | 30 | 0 |
| Mode SS | |||
|---|---|---|---|
| Quadrant | BADHDUFLAG | Total packets | Discarded packets |
| A | 0 | 214 | 0 |
| B | 0 | 214 | 0 |
| C | 0 | 214 | 0 |
| D | 0 | 214 | 0 |
| Mode M0 | |||
|---|---|---|---|
| Quadrant | BADHDUFLAG | Total packets | Discarded packets |
| A | 0 | 28648 | 3 |
| B | 0 | 22664 | 3 |
| C | 0 | 21929 | 3 |
| D | 0 | 36498 | 3 |
| Quadrant | Total seconds | Saturated seconds | Saturation percentage |
|---|---|---|---|
| A | 10459 | 761 | 7.276030% |
| B | 10459 | 103 | 0.984798% |
| C | 10459 | 78 | 0.745769% |
| D | 10459 | 369 | 3.528062% |
Noise dominated data is calculated using 1-second bins in cleaned event files. If a bin has >2000 counts, and if more than 50% of those come from <1% of pixels, then it is considered to be noise-dominated and hence unusable.
| Quadrant | # 1 sec bins | Bins with >0 counts | Bins with >2000 counts | High rate bins dominated by noise | Noise dominated (total time) | Noise dominated (detector-on time) | Marked lightcurve |
|---|---|---|---|---|---|---|---|
| A | 13233 | 10461 | 619 | 619 | 4.68% | 5.92% | 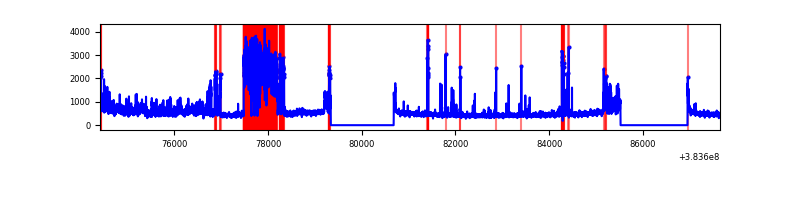 |
| B | 13233 | 10461 | 45 | 45 | 0.34% | 0.43% | 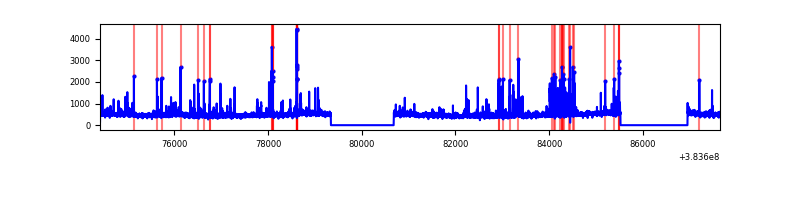 |
| C | 13233 | 10461 | 41 | 41 | 0.31% | 0.39% | 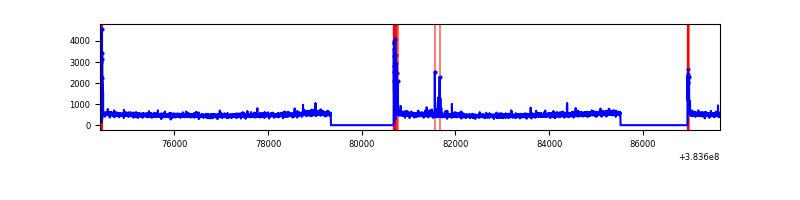 |
| D | 13233 | 10461 | 308 | 308 | 2.33% | 2.94% | 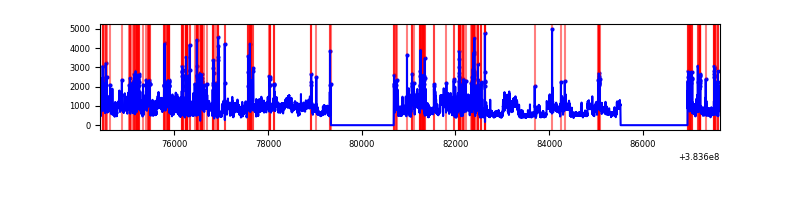 |
Top three noisy pixels from each quadrant. If the there are fewer than three noisy pixels in the level2.evt file, extra rows are filled as -1
| Pixel properties | Quadrant properties | ||||||
|---|---|---|---|---|---|---|---|
| Quadrant | DetID | PixID | Counts | Sigma | Mean | Median | Sigma |
| A | 15 | 169 | 2393481 | 10222.29 | 1163 | 1140 | 234.0 |
| A | 9 | 143 | 145188 | 615.51 | 1163 | 1140 | 234.0 |
| A | 7 | 48 | 129520 | 548.56 | 1163 | 1140 | 234.0 |
| B | 5 | 255 | 179392 | 785.12 | 1190 | 1158 | 227.0 |
| B | 5 | 172 | 175524 | 768.09 | 1190 | 1158 | 227.0 |
| B | 0 | 197 | 46552 | 199.96 | 1190 | 1158 | 227.0 |
| C | 15 | 214 | 442517 | 1623.13 | 1168 | 1175 | 271.9 |
| C | 0 | 10 | 185104 | 676.44 | 1168 | 1175 | 271.9 |
| C | 14 | 67 | 49236 | 176.75 | 1168 | 1175 | 271.9 |
| D | 8 | 195 | 3551973 | 12553.84 | 1154 | 1120 | 282.8 |
| D | 10 | 199 | 365055 | 1286.67 | 1154 | 1120 | 282.8 |
| D | 14 | 52 | 241629 | 850.31 | 1154 | 1120 | 282.8 |
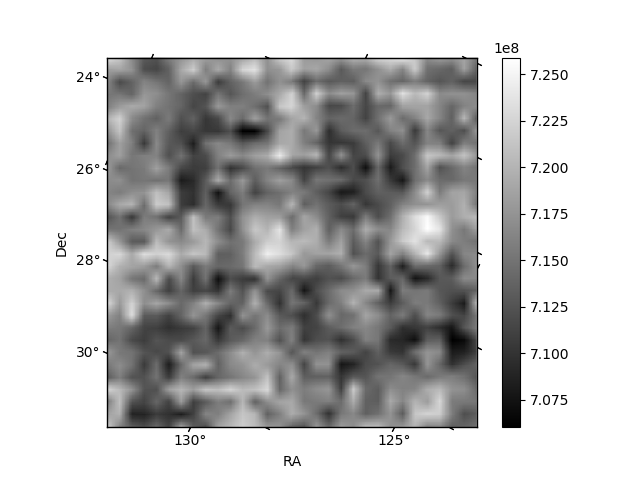
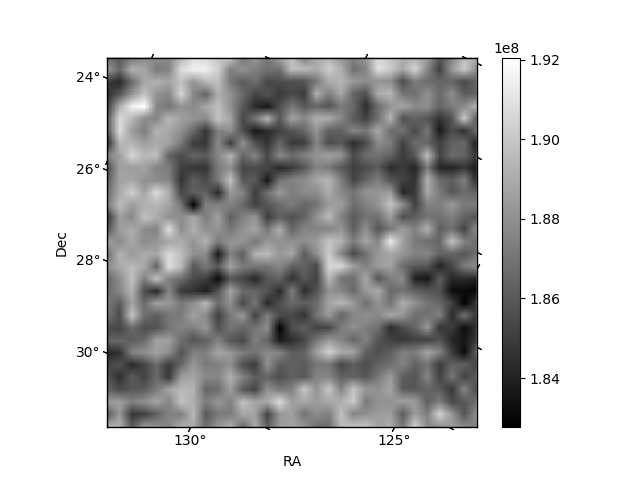
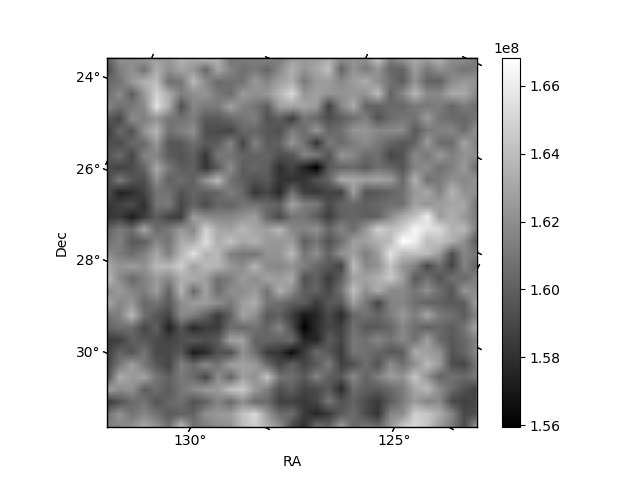
Histogram calculated using DETX and DETY for each event in the final _common_clean file
| Quadrant A | 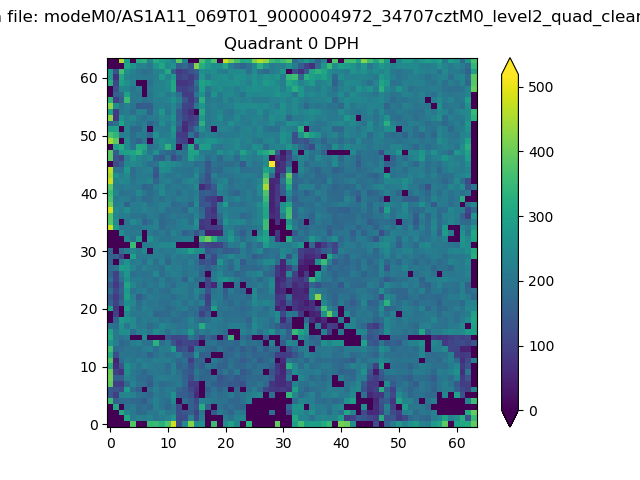 |
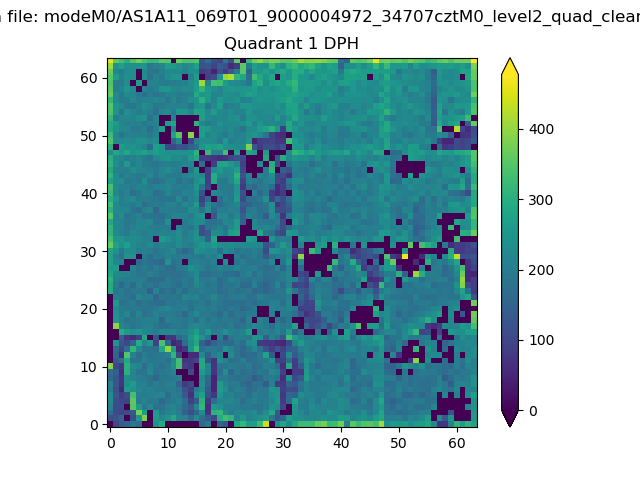 |
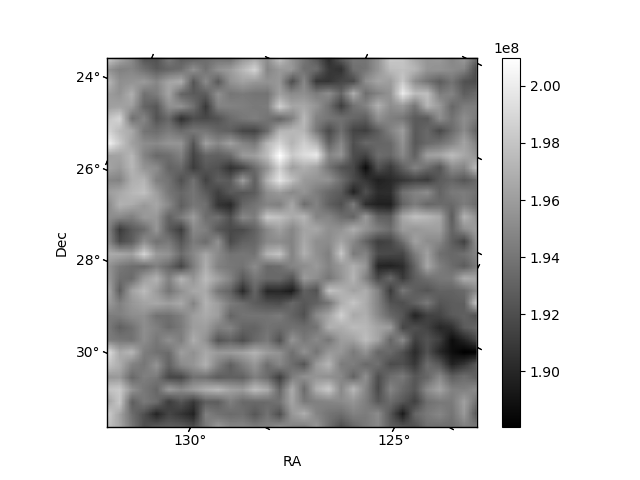
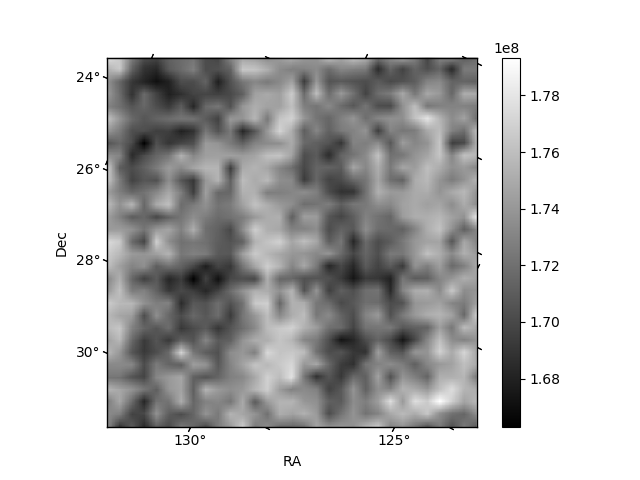
Quadrant B |
|---|---|---|---|
| Quadrant D | 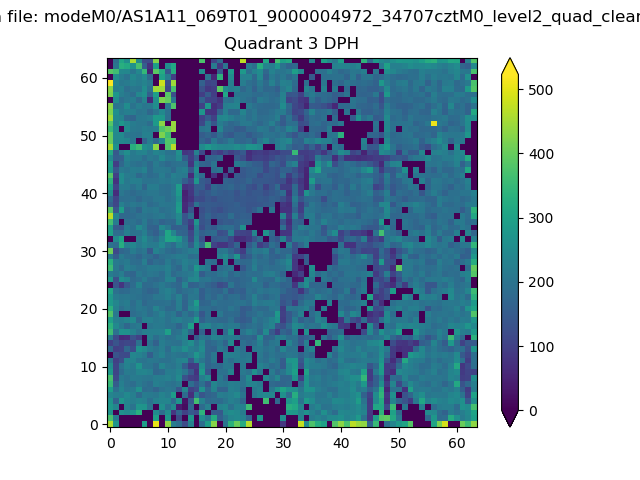 |
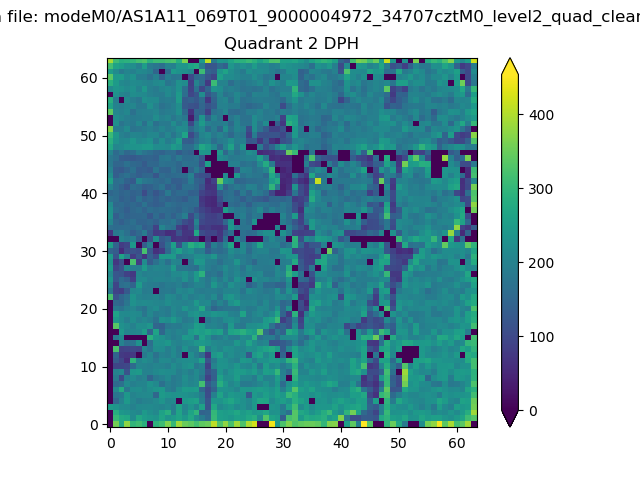 |
Quadrant C |
| Plot type | Count rate plots | Images |
|---|---|---|
| Comparison with Poisson distribution Blue bars denote a histogram of data divided into 1 sec bins. Red curve is a Poisson curve with rate = median count rate of data. |
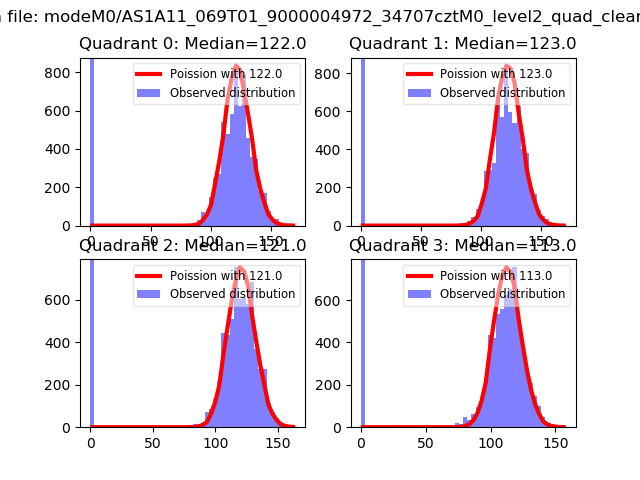 |
 |
| Quadrant-wise count rates Data is divided into 100 sec bins |
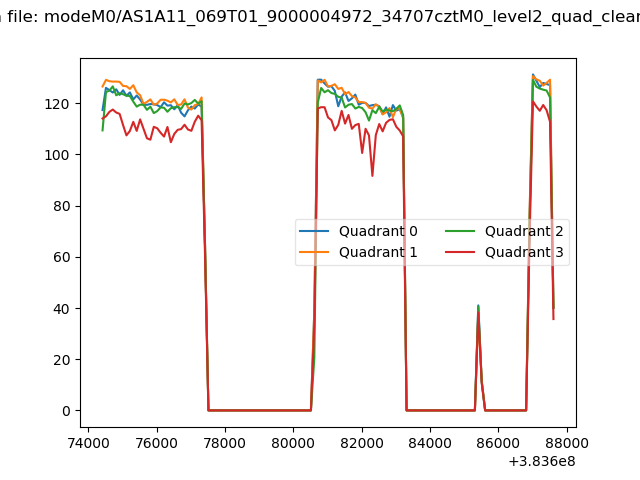 |
|
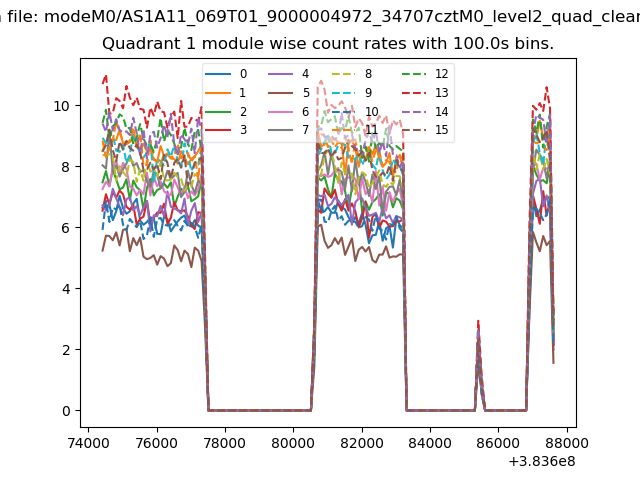
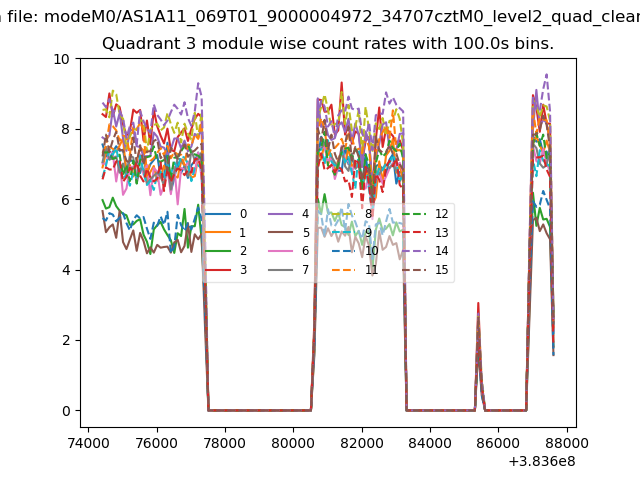
| Module-wise count rates for Quadrant A Data is divided into 100 sec bins |
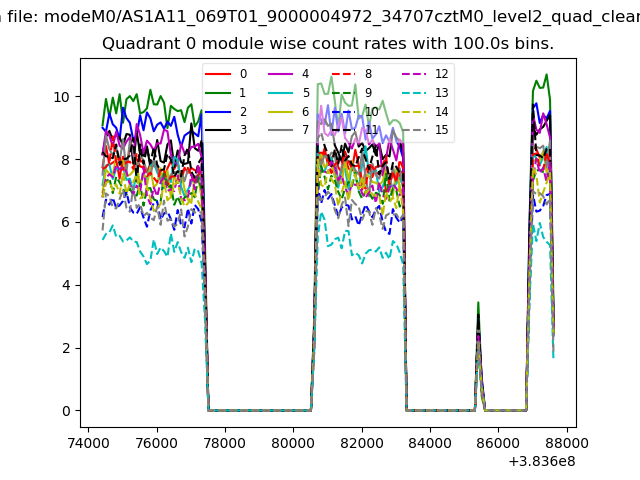 |
 |
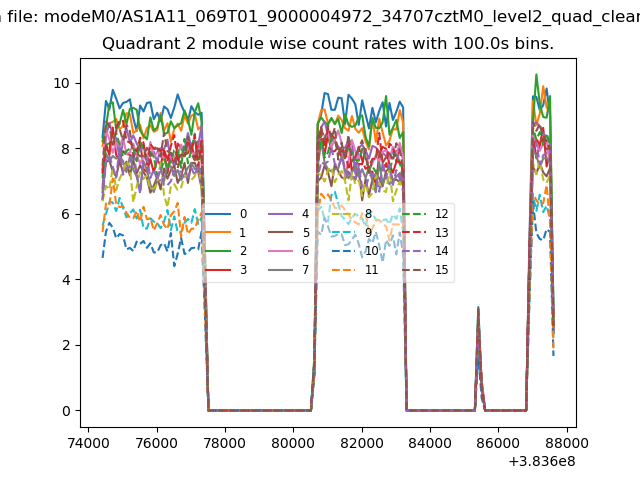
| Module-wise count rates for Quadrant B Data is divided into 100 sec bins |
 |
 |
| Module-wise count rates for Quadrant C Data is divided into 100 sec bins |
 |
 |
| Module-wise count rates for Quadrant D Data is divided into 100 sec bins |
 |
 |
| Parameter | Plot |
|---|---|
| CZT HV Monitor | 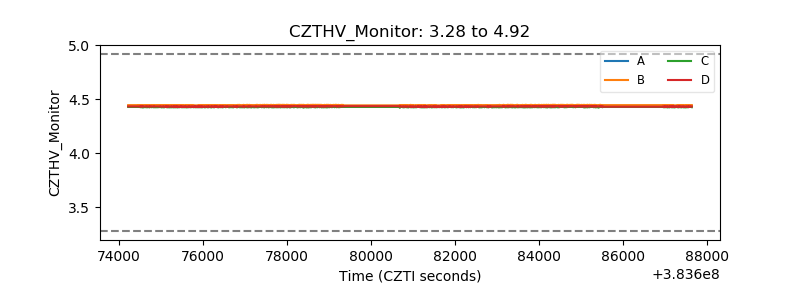 |
| D_VDD | 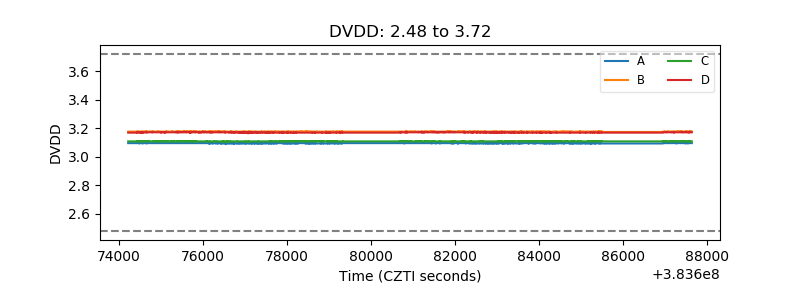 |
| Temperature 1 | 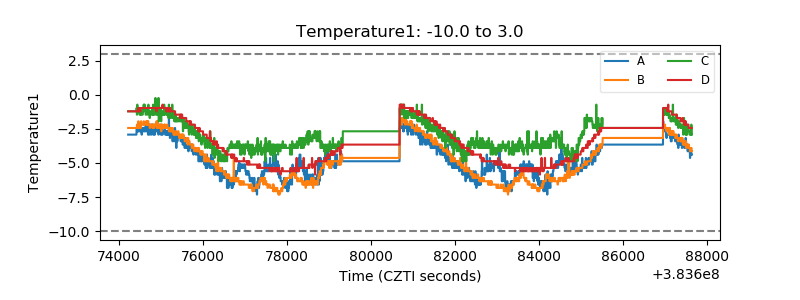 |
| Veto HV Monitor | 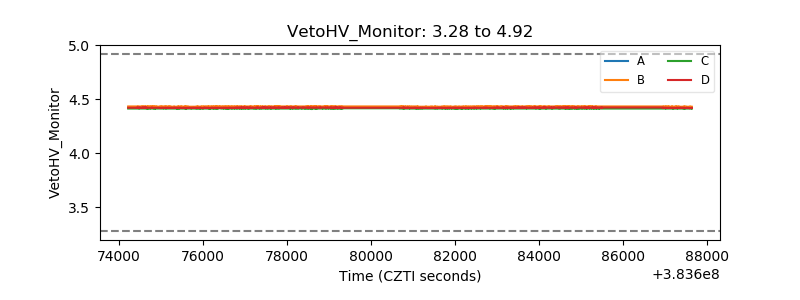 |
| Veto LLD | 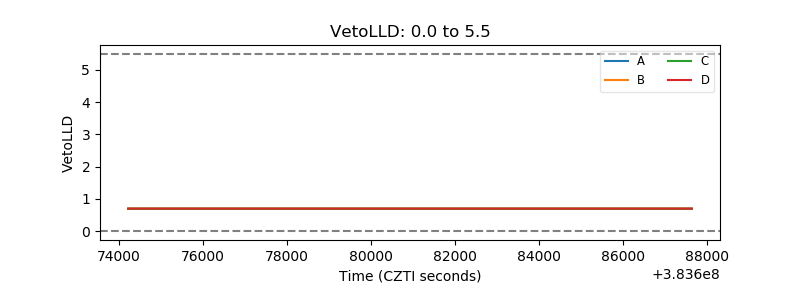 |
| Alpha Counter | 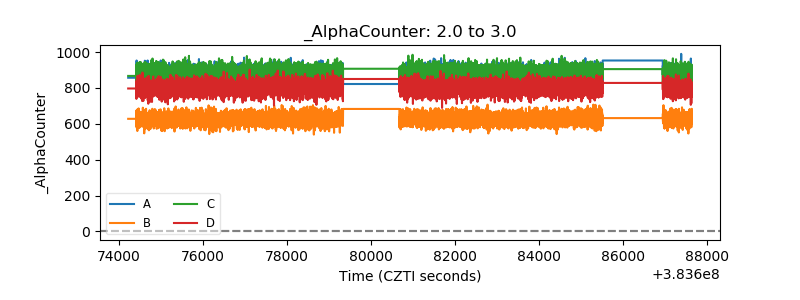 |
| _CPM_Rate | 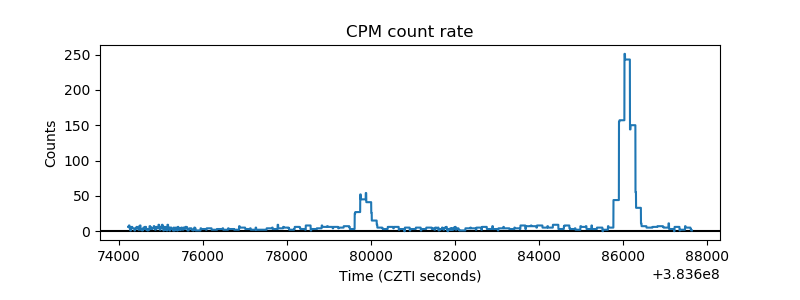 |
| CZT Counter | 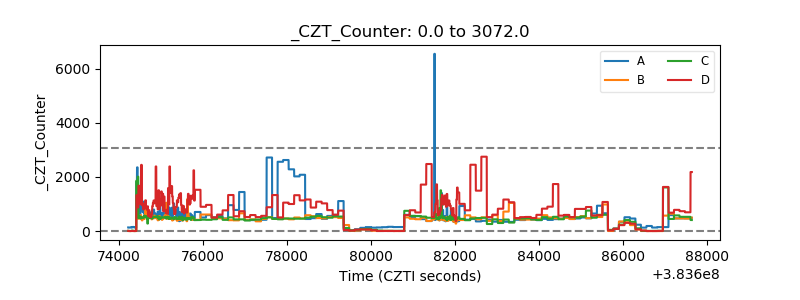 |
| +2.5 Volts monitor | 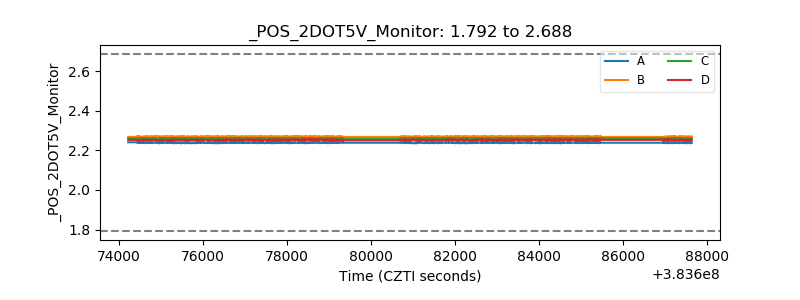 |
| +5 Volts monitor | 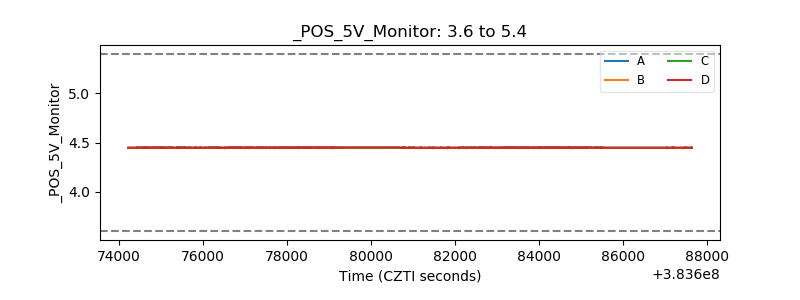 |
| _ROLL_ROT | 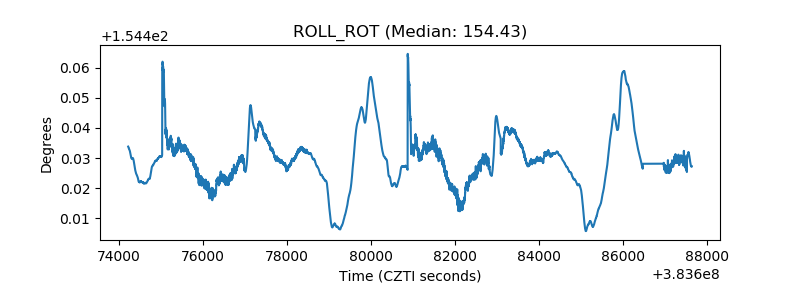 |
| _Roll_DEC | 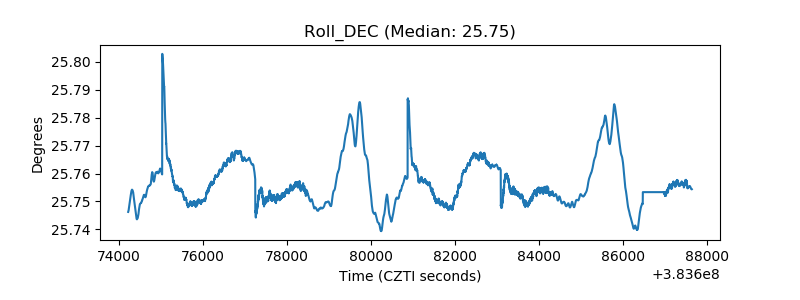 |
| _Roll_RA | 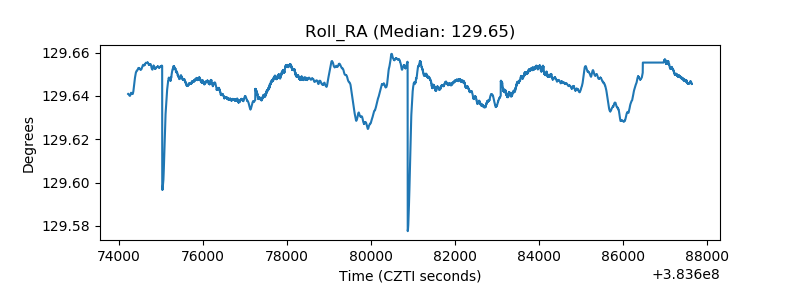 |
| Veto Counter | 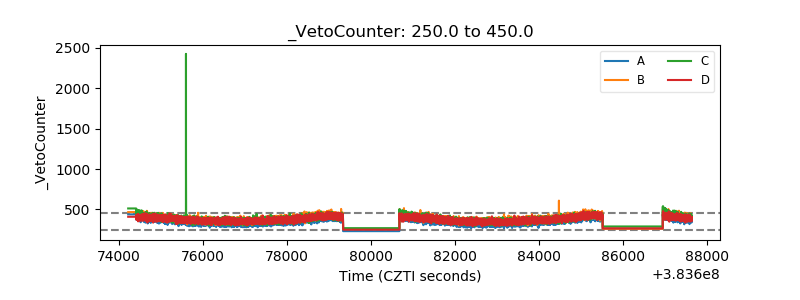 |