| Param | Original file | Final file |
|---|---|---|
| Filename | modeM0/AS1A11_069T01_9000004972_34703cztM0_level2.evt | modeM0/AS1A11_069T01_9000004972_34703cztM0_level2_quad_clean.evt |
| Size (bytes) | 640,166,400 | 83,592,000 |
| Size | 610.5 MB | 79.7 MB |
| Events in quadrant A | 7,141,119 | 515,686 |
| Events in quadrant B | 4,098,316 | 545,769 |
| Events in quadrant C | 3,049,384 | 543,670 |
| Events in quadrant D | 4,694,901 | 508,195 |
| Mode M9 | |||
|---|---|---|---|
| Quadrant | BADHDUFLAG | Total packets | Discarded packets |
| A | 0 | 12 | 0 |
| B | 0 | 12 | 0 |
| C | 0 | 12 | 0 |
| D | 0 | 13 | 0 |
| Mode SS | |||
|---|---|---|---|
| Quadrant | BADHDUFLAG | Total packets | Discarded packets |
| A | 0 | 122 | 0 |
| B | 0 | 122 | 0 |
| C | 0 | 122 | 0 |
| D | 0 | 122 | 0 |
| Mode M0 | |||
|---|---|---|---|
| Quadrant | BADHDUFLAG | Total packets | Discarded packets |
| A | 0 | 25456 | 3 |
| B | 0 | 15973 | 2 |
| C | 0 | 12542 | 2 |
| D | 0 | 17987 | 2 |
| Quadrant | Total seconds | Saturated seconds | Saturation percentage |
|---|---|---|---|
| A | 5979 | 951 | 15.905670% |
| B | 5979 | 444 | 7.425991% |
| C | 5979 | 47 | 0.786085% |
| D | 5979 | 89 | 1.488543% |
Noise dominated data is calculated using 1-second bins in cleaned event files. If a bin has >2000 counts, and if more than 50% of those come from <1% of pixels, then it is considered to be noise-dominated and hence unusable.
| Quadrant | # 1 sec bins | Bins with >0 counts | Bins with >2000 counts | High rate bins dominated by noise | Noise dominated (total time) | Noise dominated (detector-on time) | Marked lightcurve |
|---|---|---|---|---|---|---|---|
| A | 7263 | 5980 | 790 | 790 | 10.88% | 13.21% | 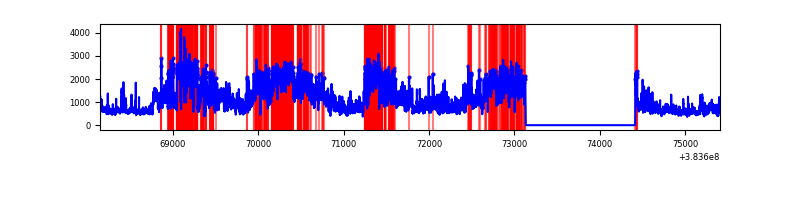 |
| B | 7263 | 5980 | 331 | 331 | 4.56% | 5.54% | 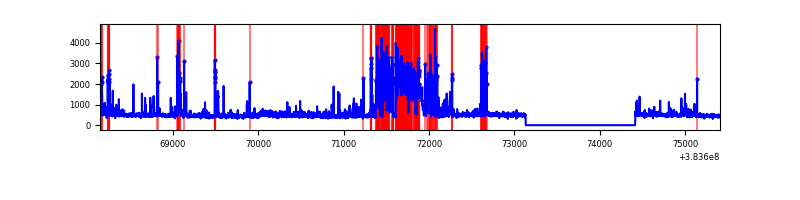 |
| C | 7263 | 5980 | 21 | 21 | 0.29% | 0.35% | 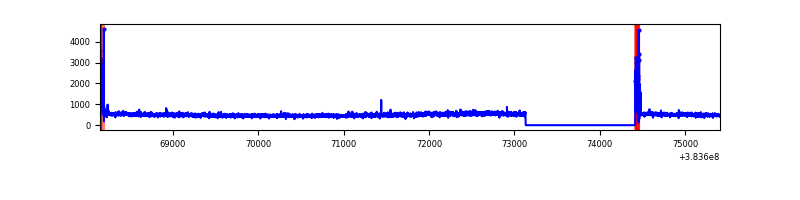 |
| D | 7263 | 5980 | 67 | 67 | 0.92% | 1.12% | 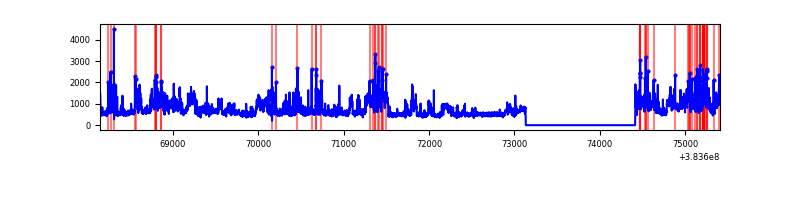 |
Top three noisy pixels from each quadrant. If the there are fewer than three noisy pixels in the level2.evt file, extra rows are filled as -1
| Pixel properties | Quadrant properties | ||||||
|---|---|---|---|---|---|---|---|
| Quadrant | DetID | PixID | Counts | Sigma | Mean | Median | Sigma |
| A | 15 | 169 | 4252675 | 31792.34 | 664 | 652 | 133.7 |
| A | 7 | 48 | 191217 | 1424.85 | 664 | 652 | 133.7 |
| A | 10 | 83 | 48491 | 357.69 | 664 | 652 | 133.7 |
| B | 0 | 182 | 870493 | 6757.07 | 666 | 646 | 128.7 |
| B | 5 | 172 | 378316 | 2933.78 | 666 | 646 | 128.7 |
| B | 0 | 197 | 67872 | 522.22 | 666 | 646 | 128.7 |
| C | 15 | 214 | 255924 | 1634.13 | 672 | 677 | 156.2 |
| C | 0 | 10 | 113491 | 722.25 | 672 | 677 | 156.2 |
| C | 14 | 67 | 48614 | 306.9 | 672 | 677 | 156.2 |
| D | 8 | 195 | 1364914 | 8246.05 | 672 | 652 | 165.4 |
| D | 10 | 199 | 149565 | 900.08 | 672 | 652 | 165.4 |
| D | 1 | 52 | 105704 | 634.97 | 672 | 652 | 165.4 |
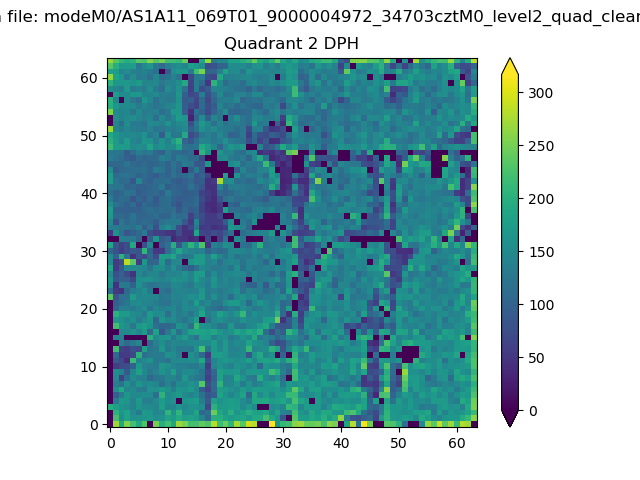
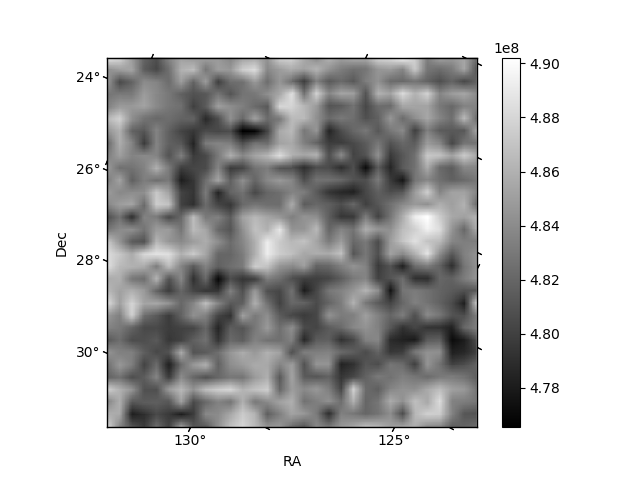
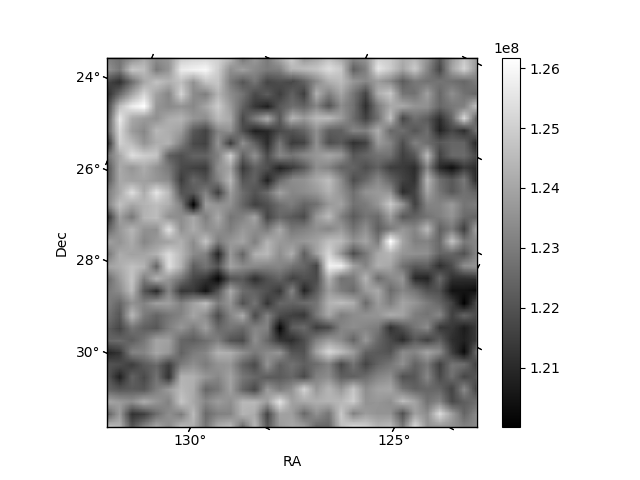
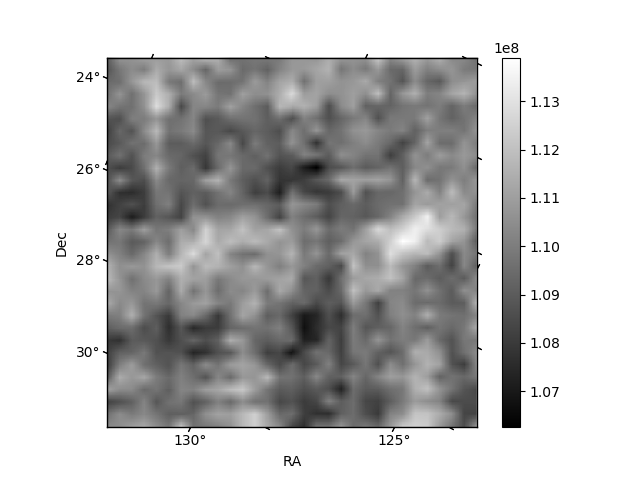
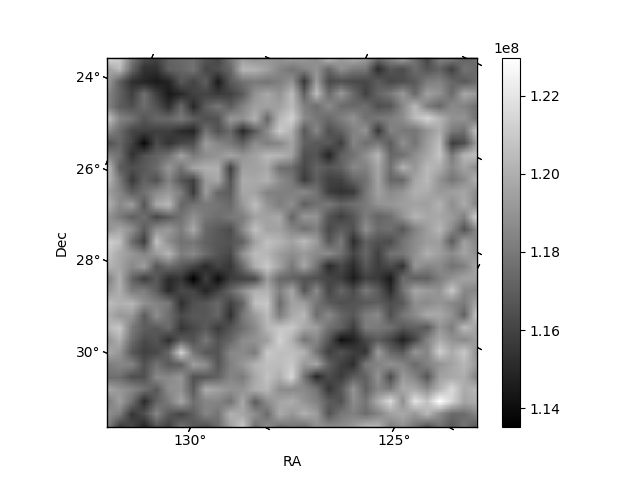
Histogram calculated using DETX and DETY for each event in the final _common_clean file
| Quadrant A | 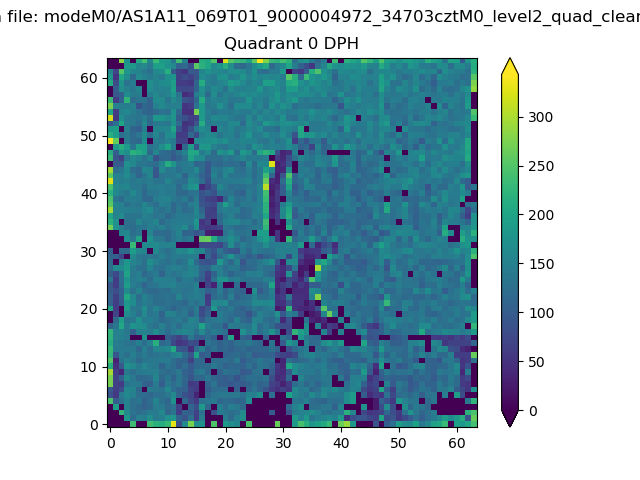 |
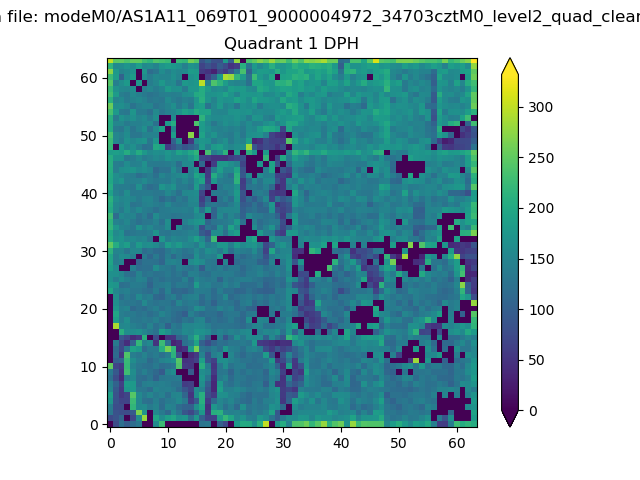 |
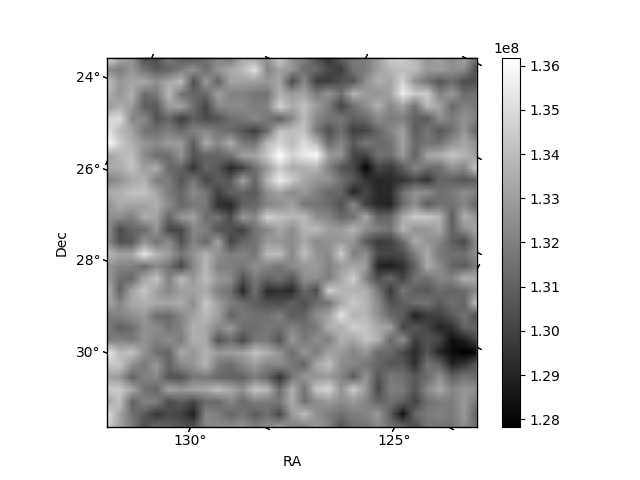
Quadrant B |
|---|---|---|---|
| Quadrant D | 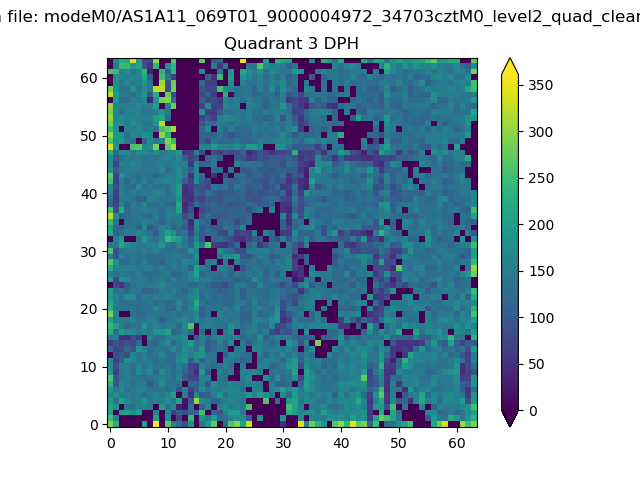 |
 |
Quadrant C |
| Plot type | Count rate plots | Images |
|---|---|---|
| Comparison with Poisson distribution Blue bars denote a histogram of data divided into 1 sec bins. Red curve is a Poisson curve with rate = median count rate of data. |
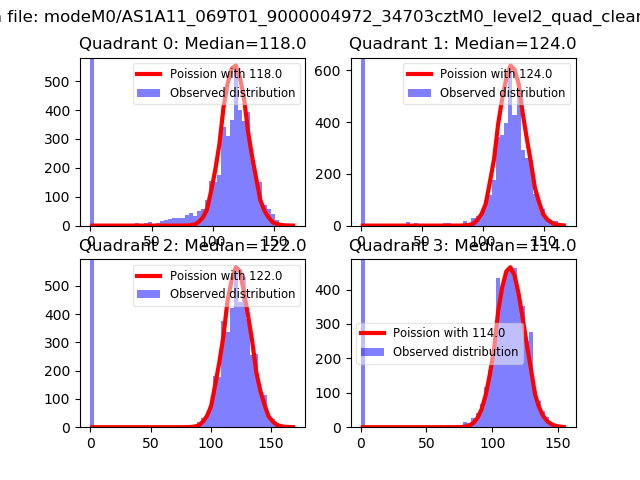 |
 |
| Quadrant-wise count rates Data is divided into 100 sec bins |
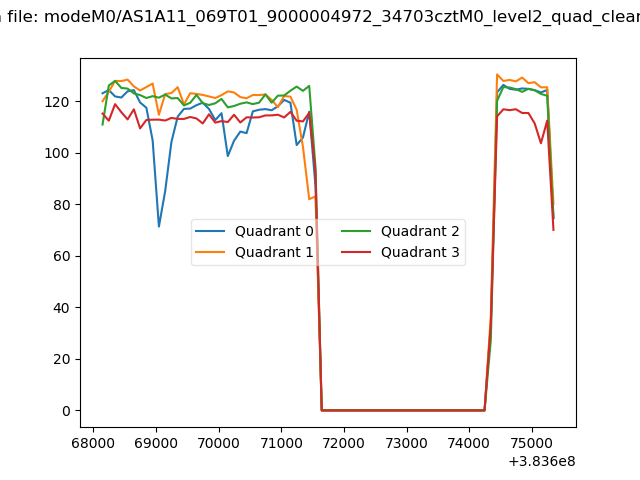 |
|
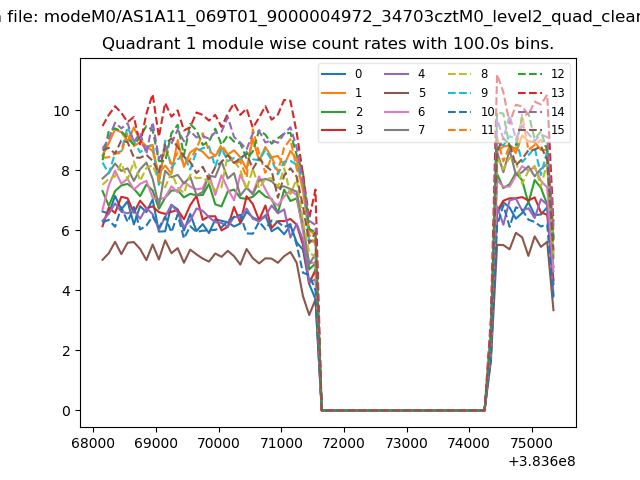
| Module-wise count rates for Quadrant A Data is divided into 100 sec bins |
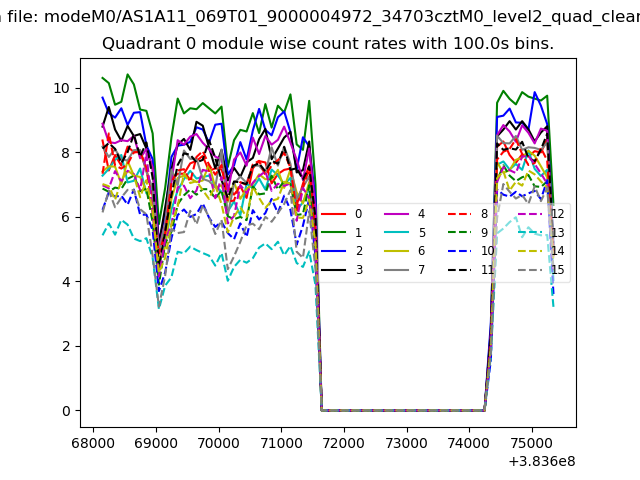 |
 |
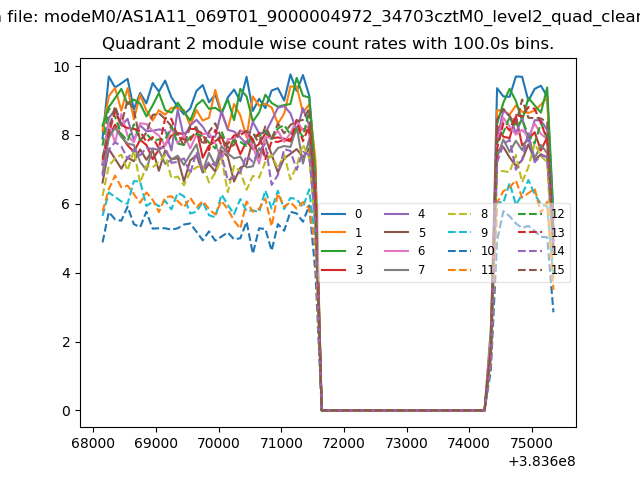
| Module-wise count rates for Quadrant B Data is divided into 100 sec bins |
 |
 |
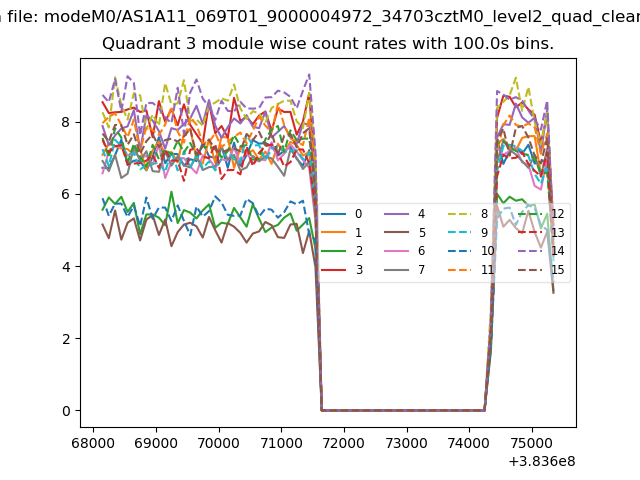
| Module-wise count rates for Quadrant C Data is divided into 100 sec bins |
 |
 |
| Module-wise count rates for Quadrant D Data is divided into 100 sec bins |
 |
 |
| Parameter | Plot |
|---|---|
| CZT HV Monitor | 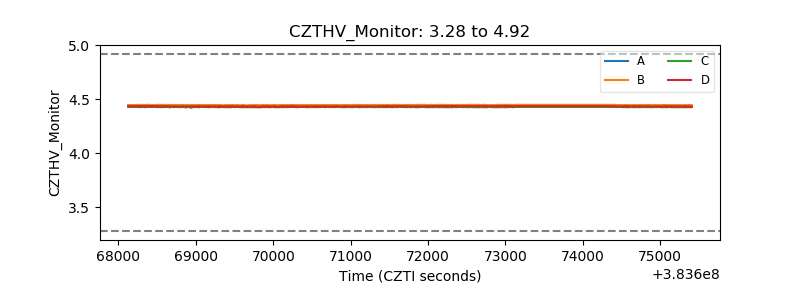 |
| D_VDD | 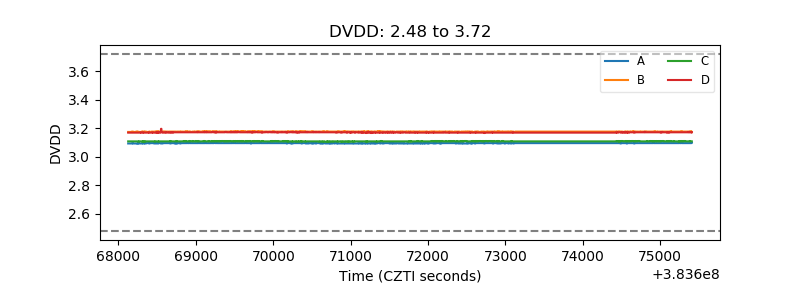 |
| Temperature 1 | 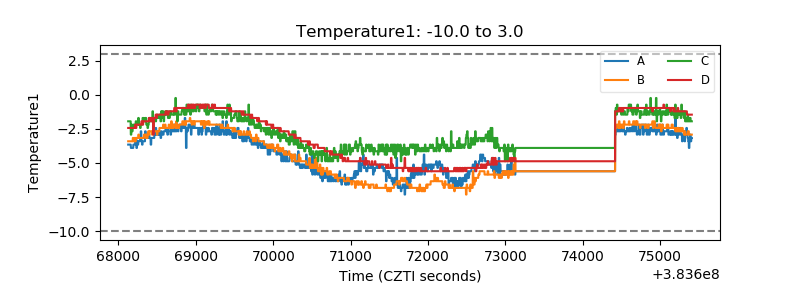 |
| Veto HV Monitor | 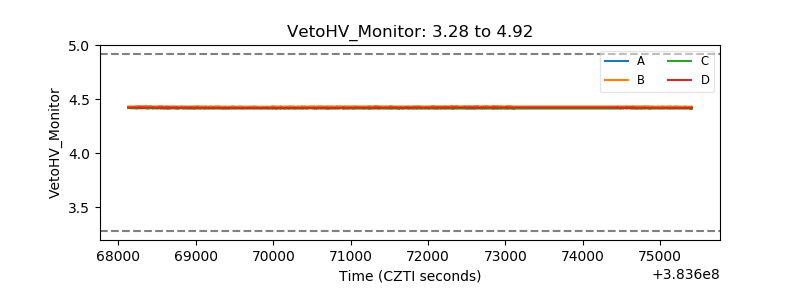 |
| Veto LLD | 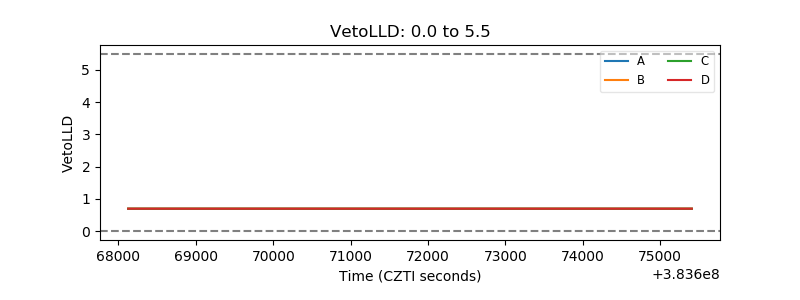 |
| Alpha Counter |  |
| _CPM_Rate | 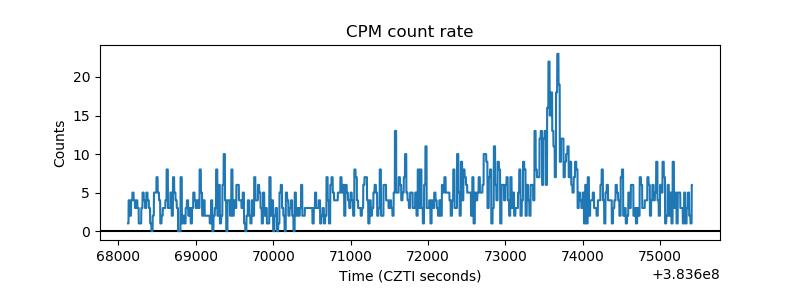 |
| CZT Counter | 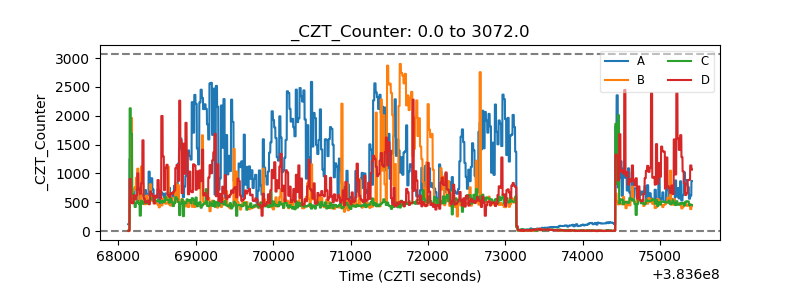 |
| +2.5 Volts monitor | 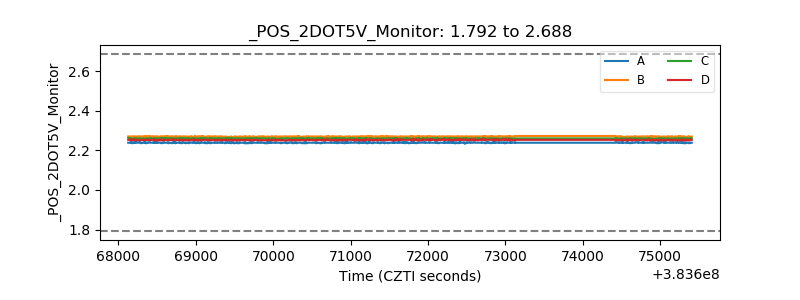 |
| +5 Volts monitor | 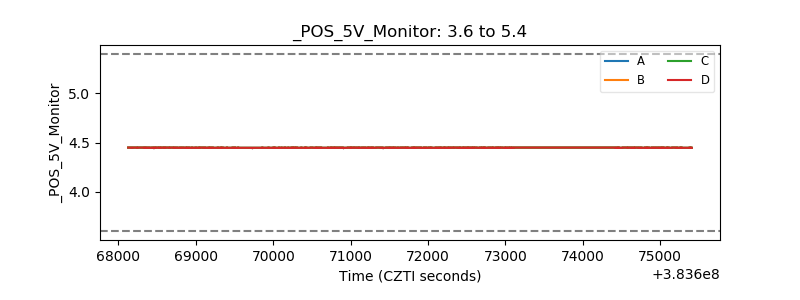 |
| _ROLL_ROT | 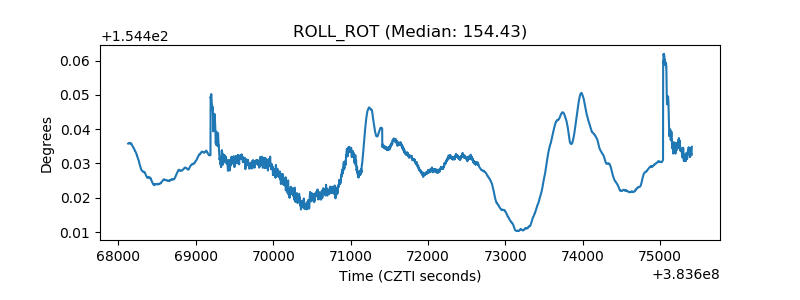 |
| _Roll_DEC | 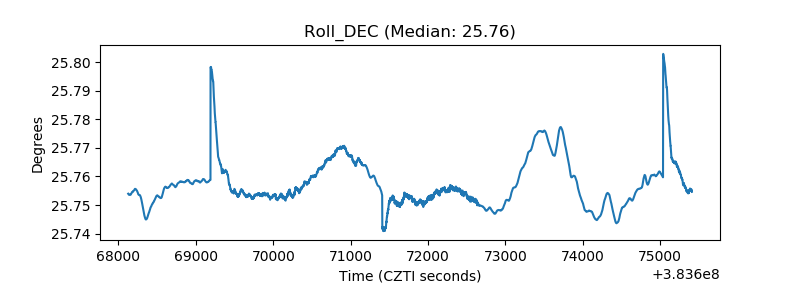 |
| _Roll_RA | 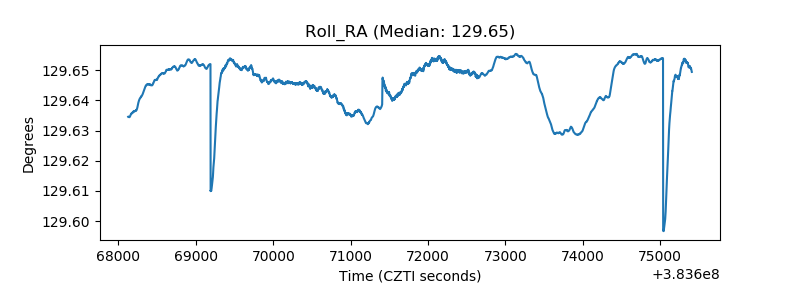 |
| Veto Counter | 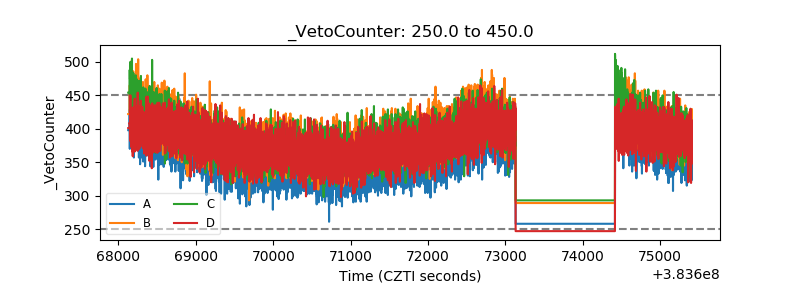 |