| Param | Original file | Final file |
|---|---|---|
| Filename | modeM0/AS1A11_069T01_9000004972_34701cztM0_level2.evt | modeM0/AS1A11_069T01_9000004972_34701cztM0_level2_quad_clean.evt |
| Size (bytes) | 71,138,880 | 12,533,760 |
| Size | 67.8 MB | 12.0 MB |
| Events in quadrant A | 502,385 | 78,450 |
| Events in quadrant B | 465,048 | 80,768 |
| Events in quadrant C | 507,766 | 78,280 |
| Events in quadrant D | 617,385 | 73,913 |
| Mode M9 | |||
|---|---|---|---|
| Quadrant | BADHDUFLAG | Total packets | Discarded packets |
| A | 0 | 12 | 0 |
| B | 0 | 12 | 0 |
| C | 0 | 12 | 0 |
| D | 0 | 12 | 0 |
| Mode SS | |||
|---|---|---|---|
| Quadrant | BADHDUFLAG | Total packets | Discarded packets |
| A | 0 | 18 | 0 |
| B | 0 | 18 | 0 |
| C | 0 | 18 | 0 |
| D | 0 | 18 | 0 |
| Mode M0 | |||
|---|---|---|---|
| Quadrant | BADHDUFLAG | Total packets | Discarded packets |
| A | 0 | 2065 | 2 |
| B | 0 | 1883 | 1 |
| C | 0 | 1971 | 1 |
| D | 0 | 2389 | 1 |
| Quadrant | Total seconds | Saturated seconds | Saturation percentage |
|---|---|---|---|
| A | 859 | 3 | 0.349243% |
| B | 859 | 15 | 1.746217% |
| C | 859 | 22 | 2.561118% |
| D | 859 | 14 | 1.629802% |
Noise dominated data is calculated using 1-second bins in cleaned event files. If a bin has >2000 counts, and if more than 50% of those come from <1% of pixels, then it is considered to be noise-dominated and hence unusable.
| Quadrant | # 1 sec bins | Bins with >0 counts | Bins with >2000 counts | High rate bins dominated by noise | Noise dominated (total time) | Noise dominated (detector-on time) | Marked lightcurve |
|---|---|---|---|---|---|---|---|
| A | 859 | 859 | 0 | 0 | 0.00% | 0.00% | 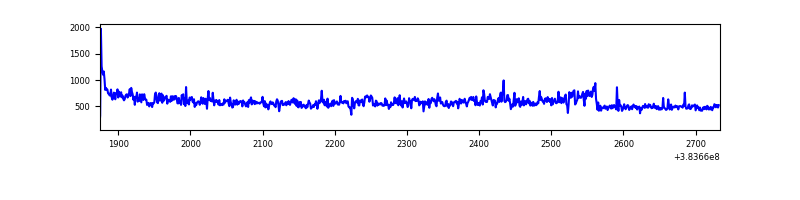 |
| B | 859 | 859 | 5 | 5 | 0.58% | 0.58% | 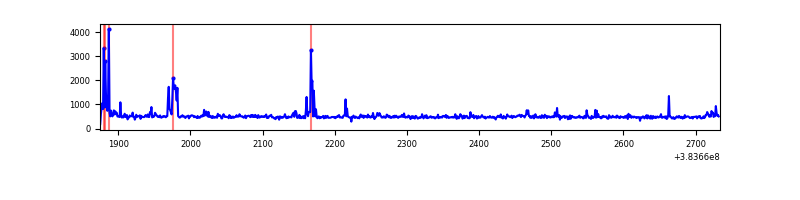 |
| C | 859 | 859 | 18 | 18 | 2.10% | 2.10% | 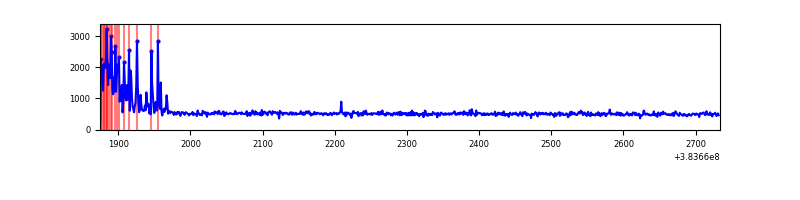 |
| D | 859 | 859 | 7 | 7 | 0.81% | 0.81% | 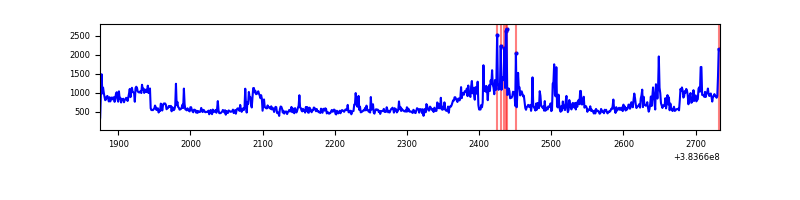 |
Top three noisy pixels from each quadrant. If the there are fewer than three noisy pixels in the level2.evt file, extra rows are filled as -1
| Pixel properties | Quadrant properties | ||||||
|---|---|---|---|---|---|---|---|
| Quadrant | DetID | PixID | Counts | Sigma | Mean | Median | Sigma |
| A | 15 | 169 | 65519 | 2743.53 | 106 | 104 | 23.8 |
| A | 10 | 83 | 19516 | 814.15 | 106 | 104 | 23.8 |
| A | 13 | 6 | 2264 | 90.59 | 106 | 104 | 23.8 |
| B | 5 | 255 | 28250 | 1244.46 | 104 | 101 | 22.6 |
| B | 15 | 201 | 17762 | 780.79 | 104 | 101 | 22.6 |
| B | 5 | 172 | 5147 | 223.08 | 104 | 101 | 22.6 |
| C | 0 | 10 | 72781 | 2863.81 | 100 | 100 | 25.4 |
| C | 15 | 214 | 41752 | 1641.19 | 100 | 100 | 25.4 |
| C | 14 | 67 | 1713 | 63.56 | 100 | 100 | 25.4 |
| D | 8 | 195 | 146430 | 5342.71 | 102 | 98 | 27.4 |
| D | 2 | 250 | 26993 | 981.96 | 102 | 98 | 27.4 |
| D | 12 | 6 | 26649 | 969.4 | 102 | 98 | 27.4 |
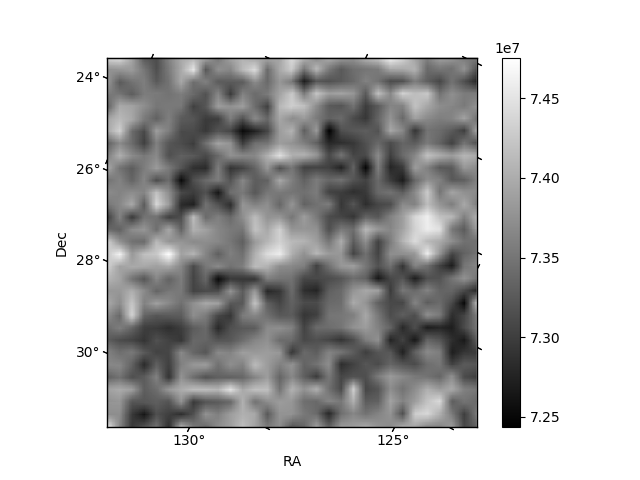
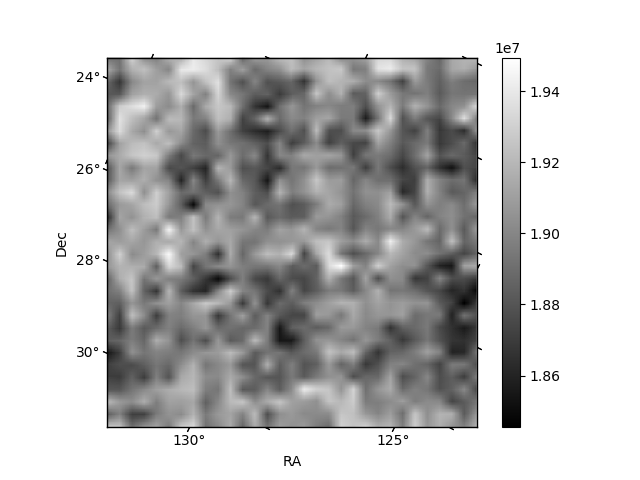
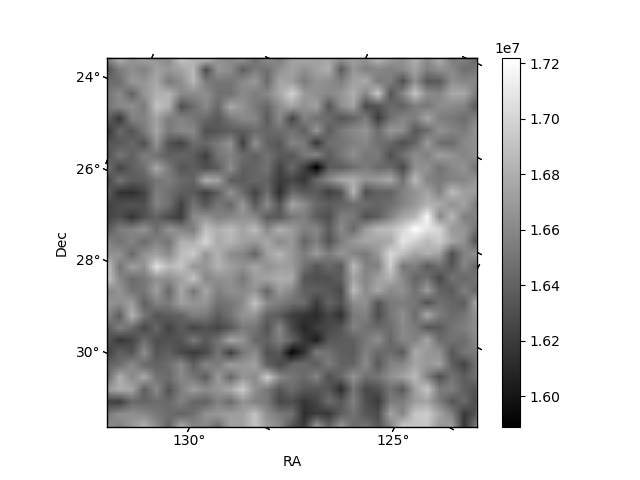
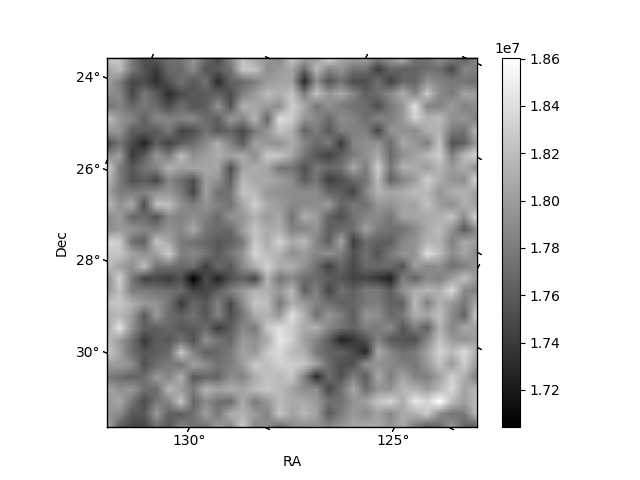
Histogram calculated using DETX and DETY for each event in the final _common_clean file
| Quadrant A | 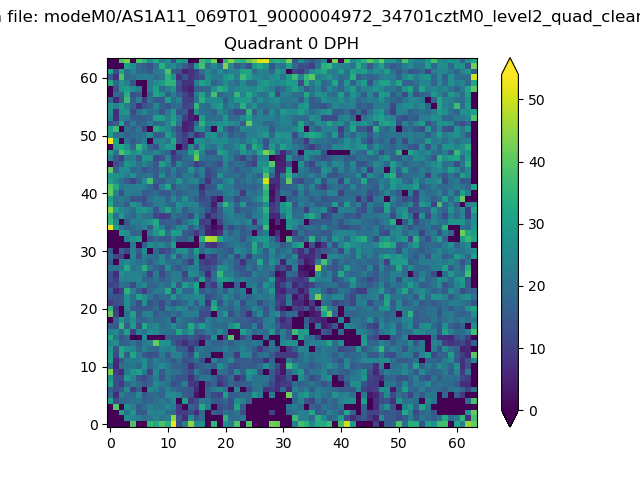 |
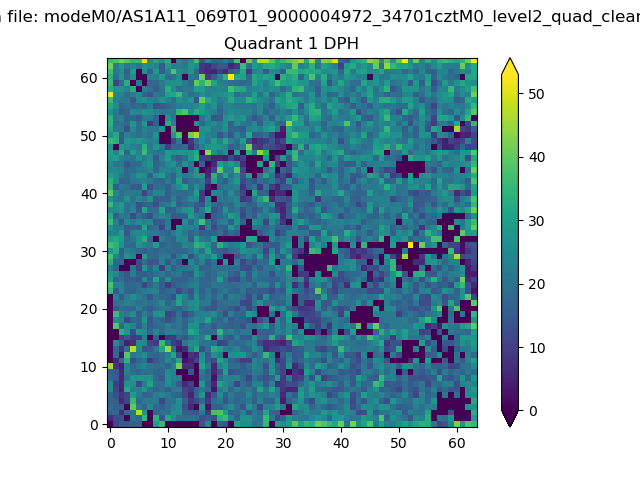 |
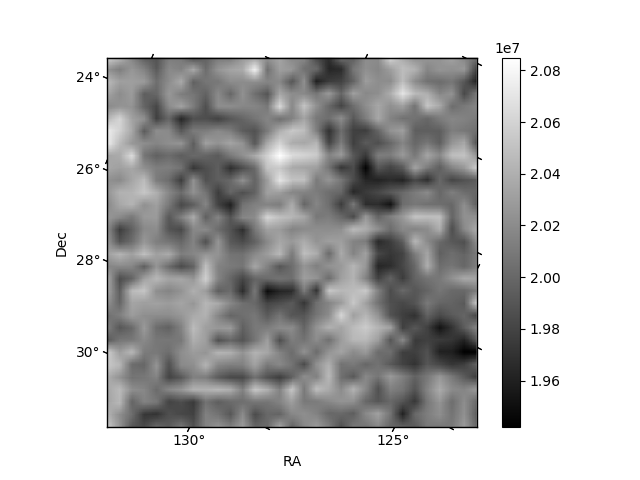
Quadrant B |
|---|---|---|---|
| Quadrant D | 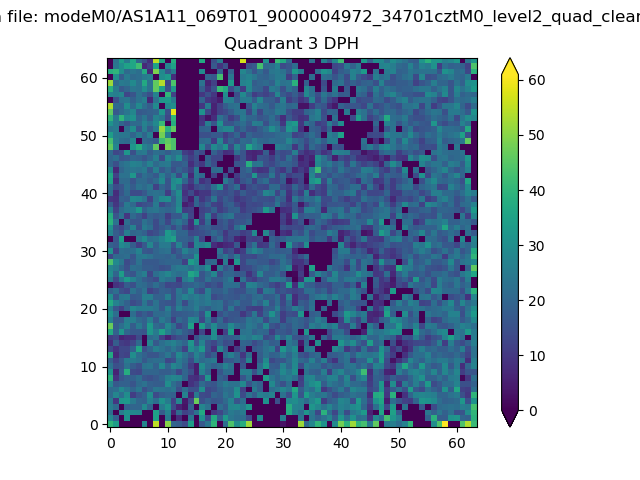 |
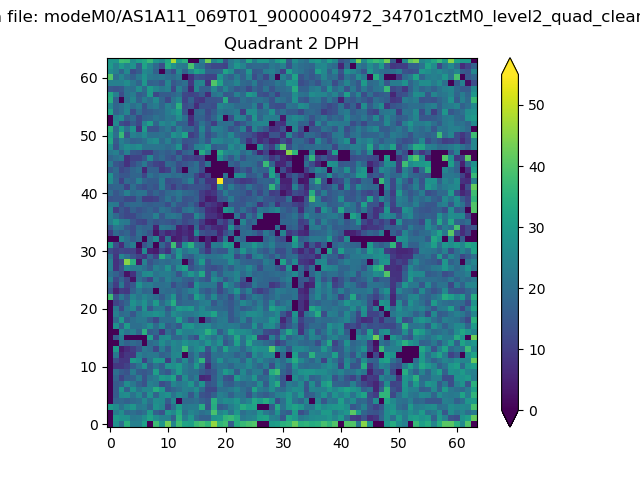 |
Quadrant C |
| Plot type | Count rate plots | Images |
|---|---|---|
| Comparison with Poisson distribution Blue bars denote a histogram of data divided into 1 sec bins. Red curve is a Poisson curve with rate = median count rate of data. |
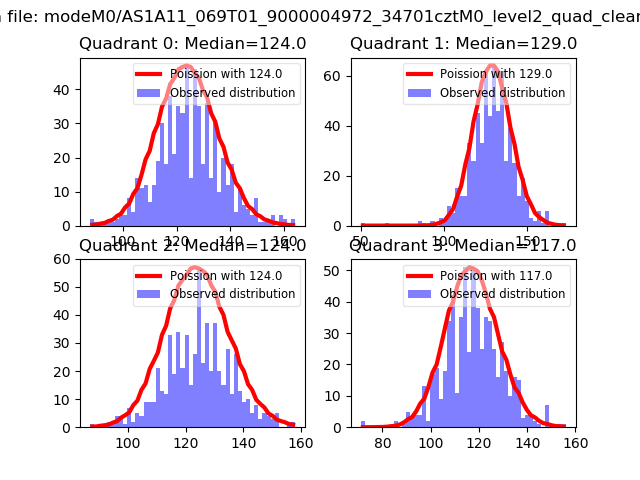 |
 |
| Quadrant-wise count rates Data is divided into 100 sec bins |
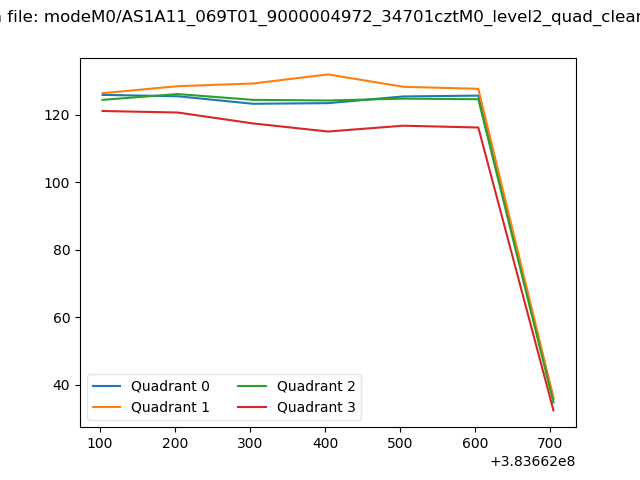 |
|
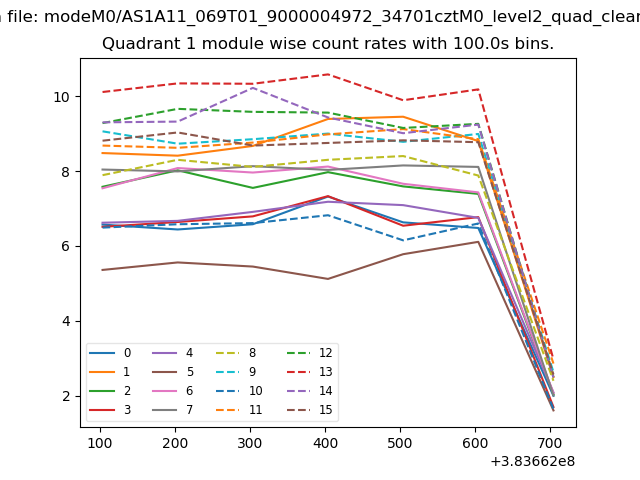
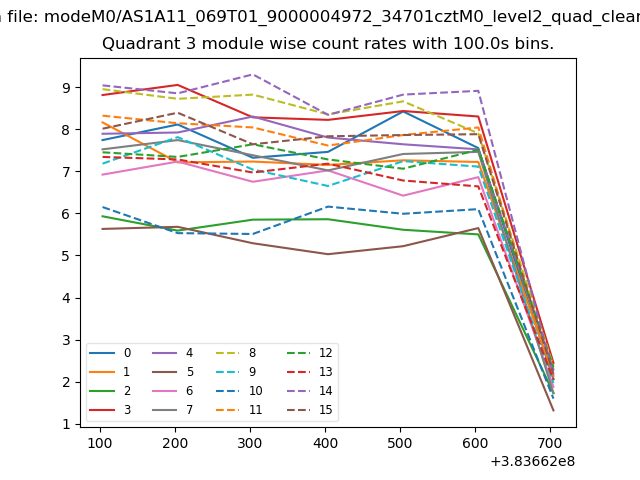
| Module-wise count rates for Quadrant A Data is divided into 100 sec bins |
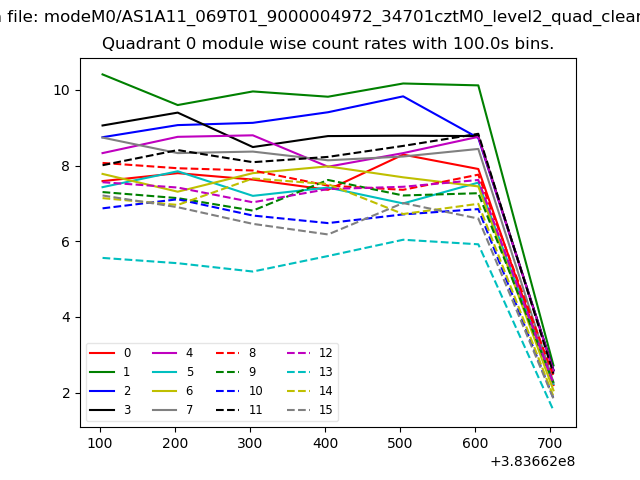 |
 |
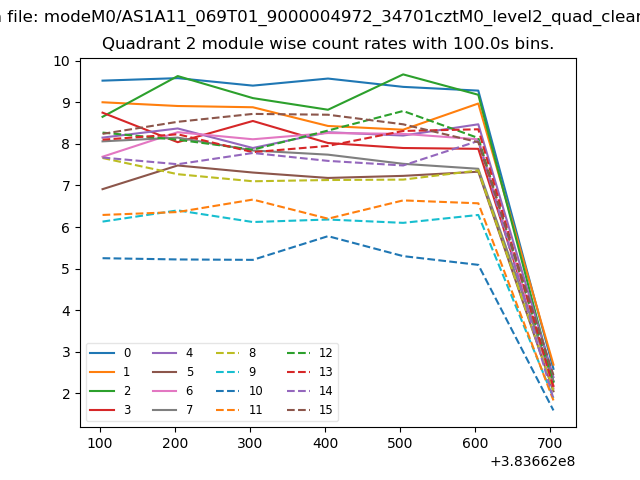
| Module-wise count rates for Quadrant B Data is divided into 100 sec bins |
 |
 |
| Module-wise count rates for Quadrant C Data is divided into 100 sec bins |
 |
 |
| Module-wise count rates for Quadrant D Data is divided into 100 sec bins |
 |
 |
| Parameter | Plot |
|---|---|
| CZT HV Monitor | 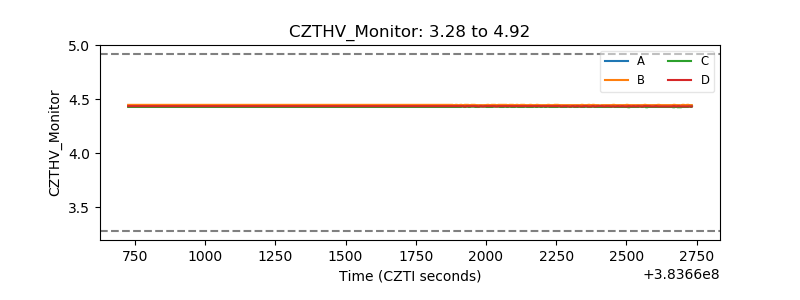 |
| D_VDD | 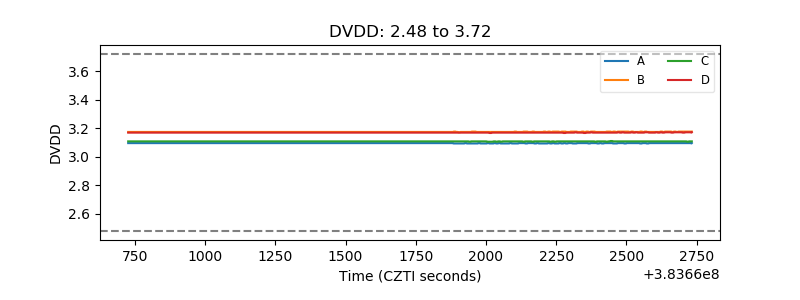 |
| Temperature 1 | 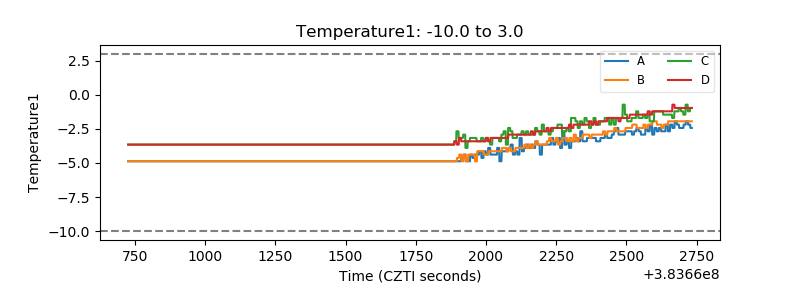 |
| Veto HV Monitor | 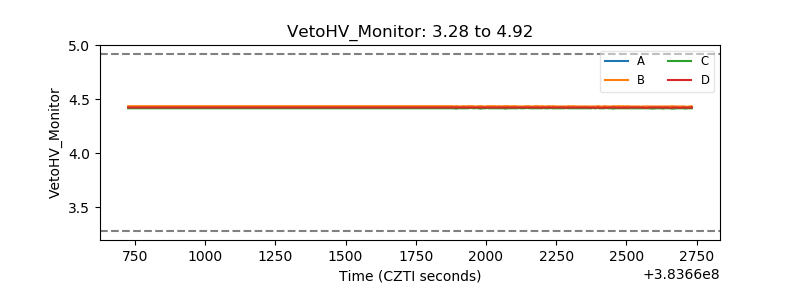 |
| Veto LLD | 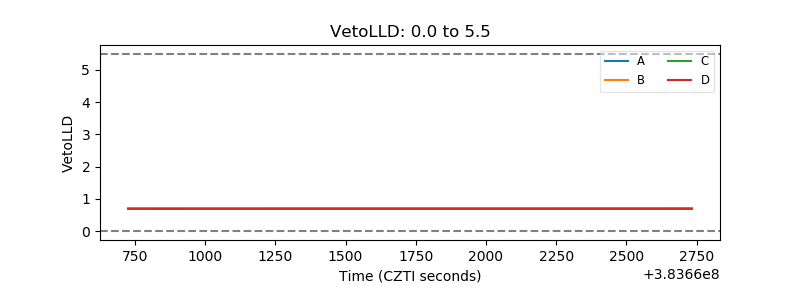 |
| Alpha Counter | 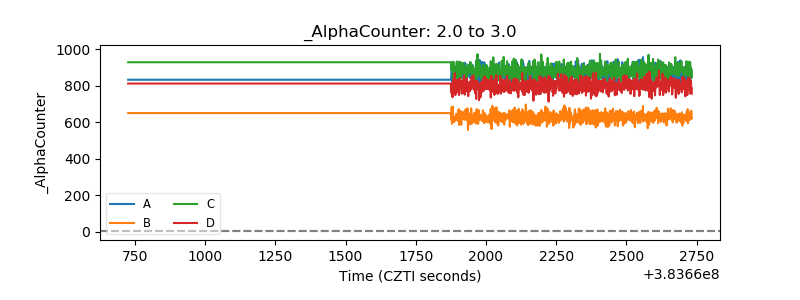 |
| _CPM_Rate | 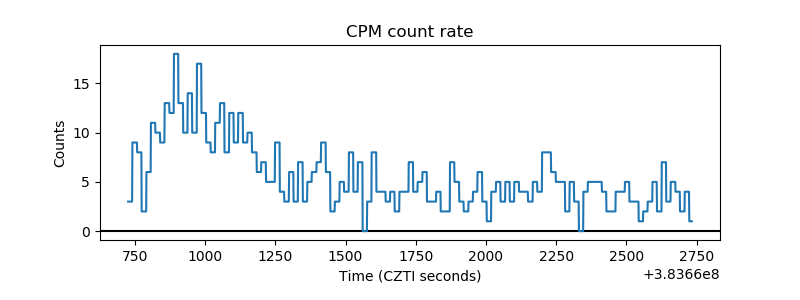 |
| CZT Counter | 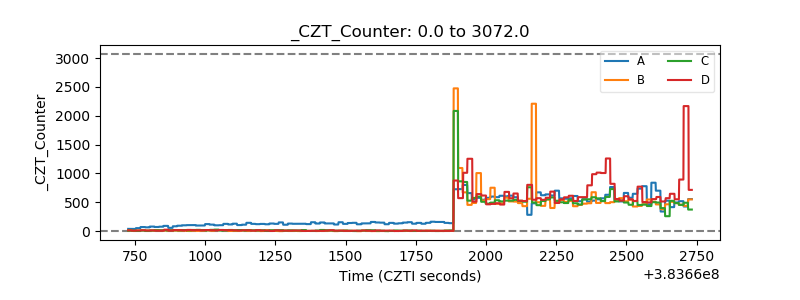 |
| +2.5 Volts monitor | 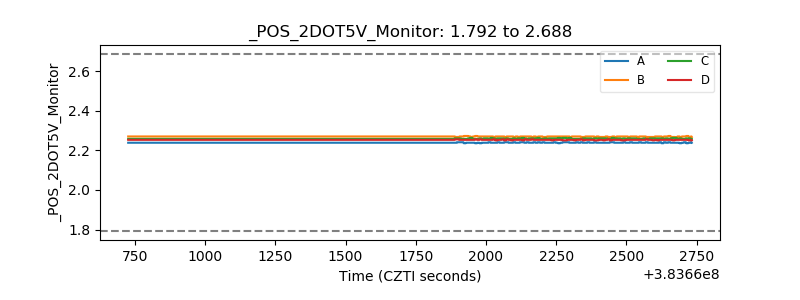 |
| +5 Volts monitor | 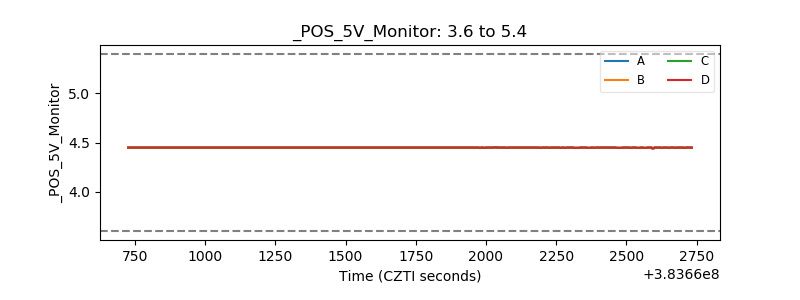 |
| _ROLL_ROT | 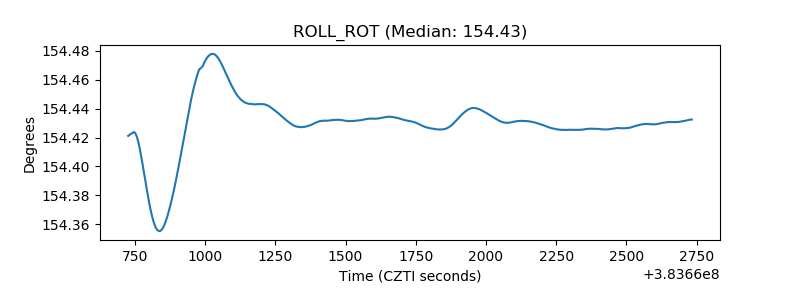 |
| _Roll_DEC | 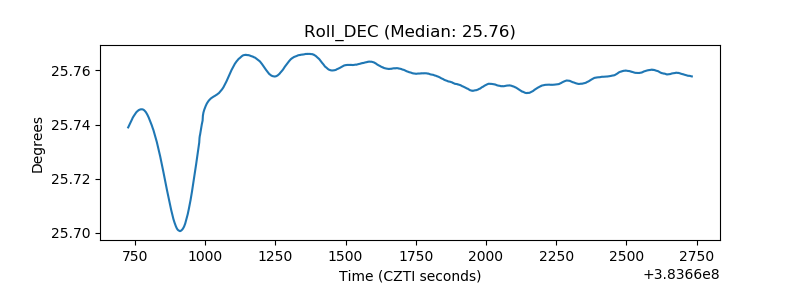 |
| _Roll_RA | 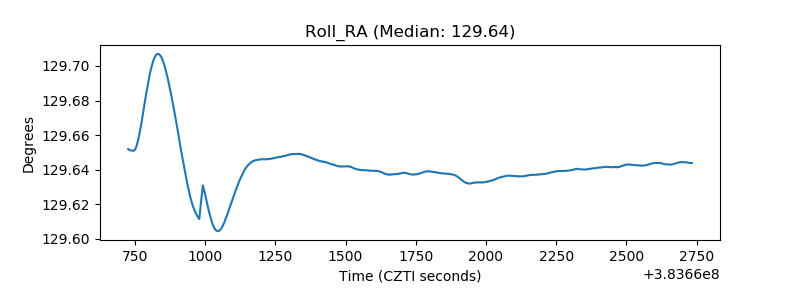 |
| Veto Counter | 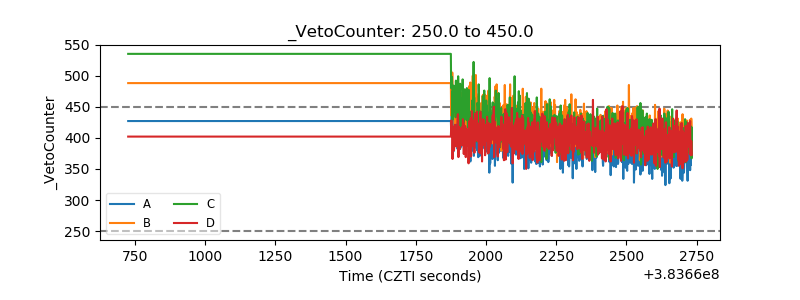 |