| Param | Original file | Final file |
|---|---|---|
| Filename | modeM0/AS1A09_038T36_9000004976_34712cztM0_level2.evt | modeM0/AS1A09_038T36_9000004976_34712cztM0_level2_quad_clean.evt |
| Size (bytes) | 387,544,320 | 84,700,800 |
| Size | 369.6 MB | 80.8 MB |
| Events in quadrant A | 2,919,351 | 553,753 |
| Events in quadrant B | 2,140,863 | 598,355 |
| Events in quadrant C | 2,148,083 | 597,811 |
| Events in quadrant D | 4,267,730 | 543,933 |
| Mode M0 | |||
|---|---|---|---|
| Quadrant | BADHDUFLAG | Total packets | Discarded packets |
| A | 0 | 10985 | 0 |
| B | 0 | 8514 | 0 |
| C | 0 | 8560 | 0 |
| D | 0 | 15408 | 0 |
| Mode SS | |||
|---|---|---|---|
| Quadrant | BADHDUFLAG | Total packets | Discarded packets |
| A | 0 | 76 | 0 |
| B | 0 | 76 | 0 |
| C | 0 | 76 | 0 |
| D | 0 | 76 | 0 |
| Quadrant | Total seconds | Saturated seconds | Saturation percentage |
|---|---|---|---|
| A | 3840 | 435 | 11.328125% |
| B | 3840 | 45 | 1.171875% |
| C | 3840 | 1 | 0.026042% |
| D | 3840 | 269 | 7.005208% |
Noise dominated data is calculated using 1-second bins in cleaned event files. If a bin has >2000 counts, and if more than 50% of those come from <1% of pixels, then it is considered to be noise-dominated and hence unusable.
| Quadrant | # 1 sec bins | Bins with >0 counts | Bins with >2000 counts | High rate bins dominated by noise | Noise dominated (total time) | Noise dominated (detector-on time) | Marked lightcurve |
|---|---|---|---|---|---|---|---|
| A | 3840 | 3840 | 329 | 329 | 8.57% | 8.57% | 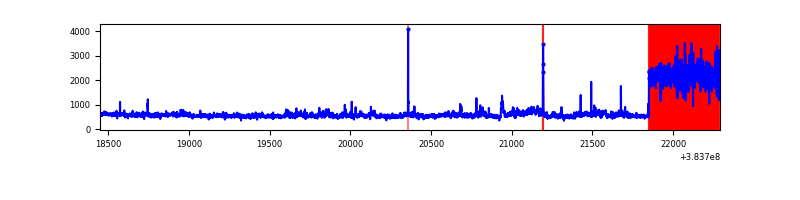 |
| B | 3840 | 3840 | 31 | 31 | 0.81% | 0.81% | 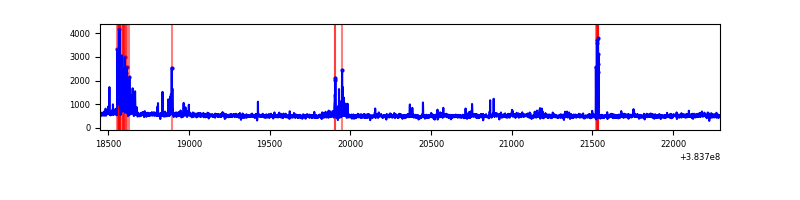 |
| C | 3840 | 3840 | 0 | 0 | 0.00% | 0.00% | 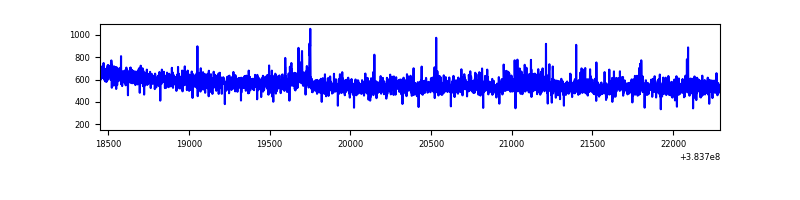 |
| D | 3840 | 3840 | 285 | 285 | 7.42% | 7.42% | 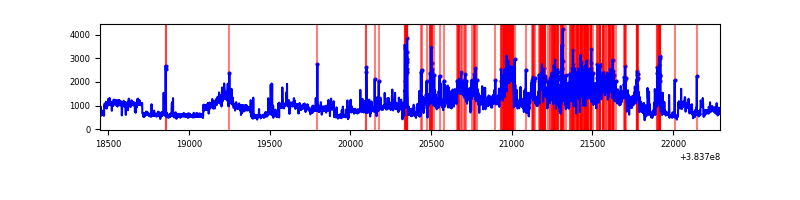 |
Top three noisy pixels from each quadrant. If the there are fewer than three noisy pixels in the level2.evt file, extra rows are filled as -1
| Pixel properties | Quadrant properties | ||||||
|---|---|---|---|---|---|---|---|
| Quadrant | DetID | PixID | Counts | Sigma | Mean | Median | Sigma |
| A | 15 | 169 | 1069709 | 11536.67 | 467 | 460 | 92.7 |
| A | 9 | 143 | 19476 | 205.17 | 467 | 460 | 92.7 |
| A | 10 | 83 | 12988 | 135.17 | 467 | 460 | 92.7 |
| B | 5 | 172 | 119637 | 1315.87 | 487 | 476 | 90.6 |
| B | 0 | 155 | 34992 | 381.15 | 487 | 476 | 90.6 |
| B | 0 | 189 | 33781 | 367.78 | 487 | 476 | 90.6 |
| C | 15 | 214 | 163478 | 1481.25 | 484 | 488 | 110.0 |
| C | 4 | 254 | 75069 | 677.79 | 484 | 488 | 110.0 |
| C | 14 | 67 | 6637 | 55.88 | 484 | 488 | 110.0 |
| D | 8 | 195 | 1382765 | 11104.74 | 473 | 462 | 124.5 |
| D | 12 | 233 | 598035 | 4800.61 | 473 | 462 | 124.5 |
| D | 14 | 52 | 136561 | 1093.35 | 473 | 462 | 124.5 |
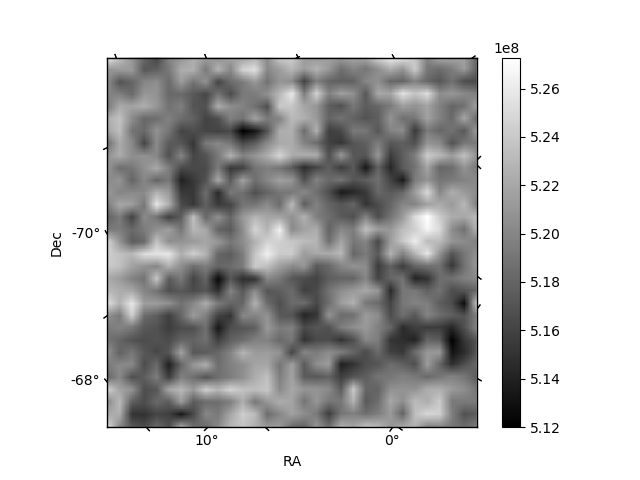
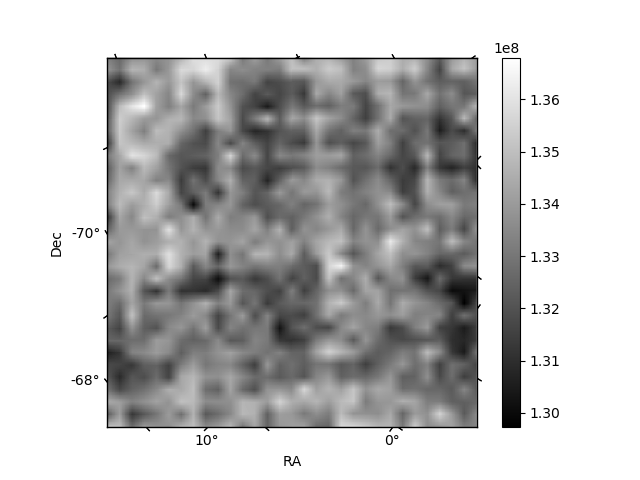
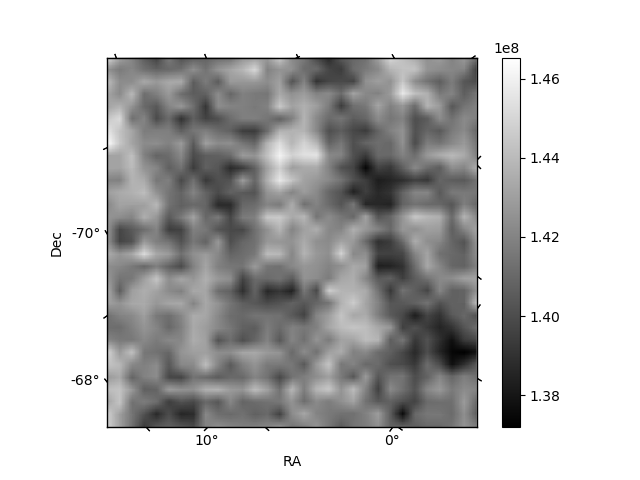
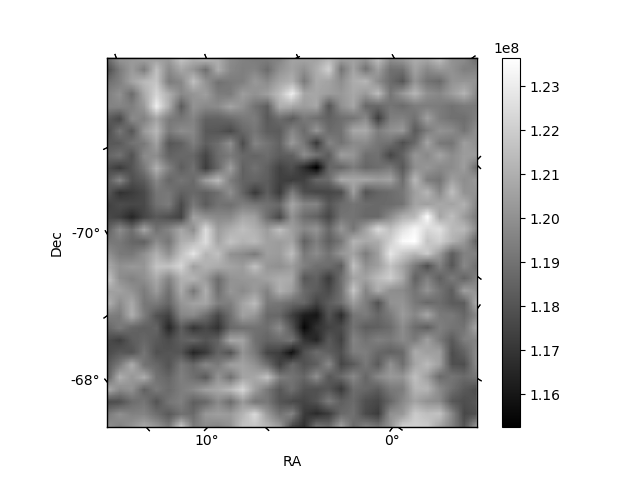
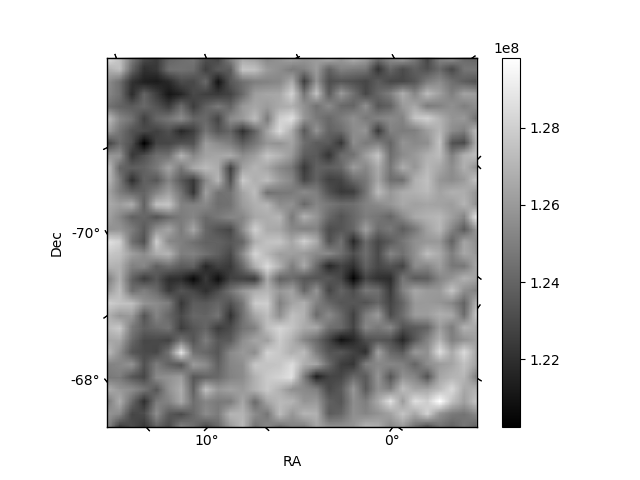
Histogram calculated using DETX and DETY for each event in the final _common_clean file
| Quadrant A | 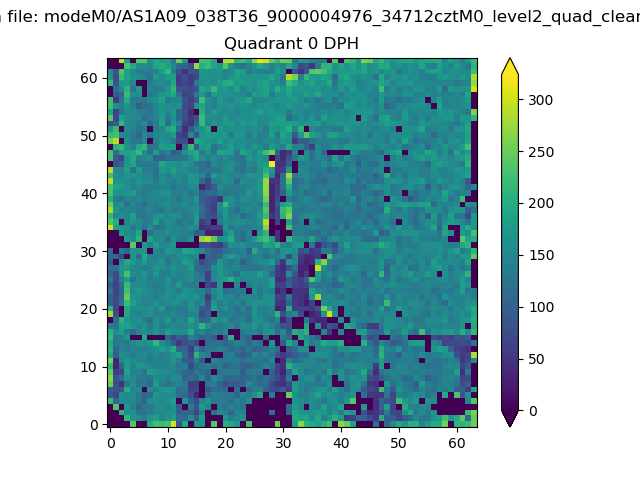 |
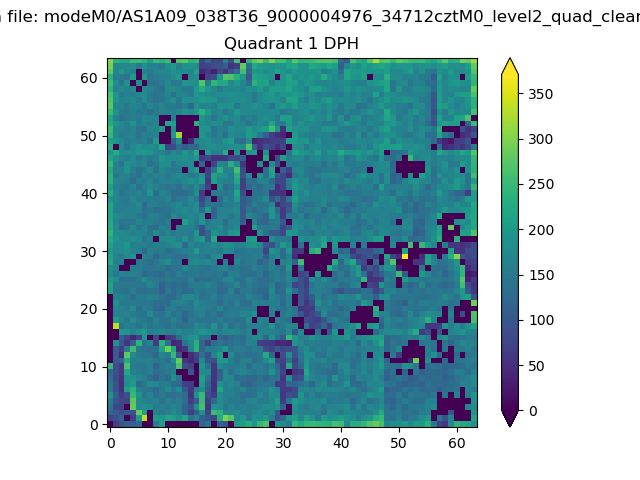 |
Quadrant B |
|---|---|---|---|
| Quadrant D | 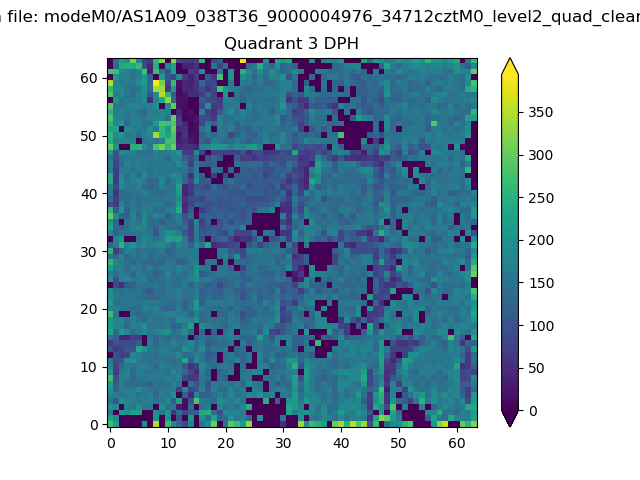 |
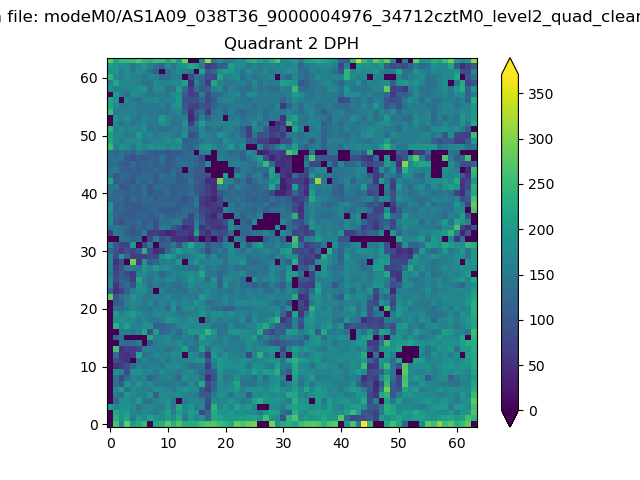 |
Quadrant C |
| Plot type | Count rate plots | Images |
|---|---|---|
| Comparison with Poisson distribution Blue bars denote a histogram of data divided into 1 sec bins. Red curve is a Poisson curve with rate = median count rate of data. |
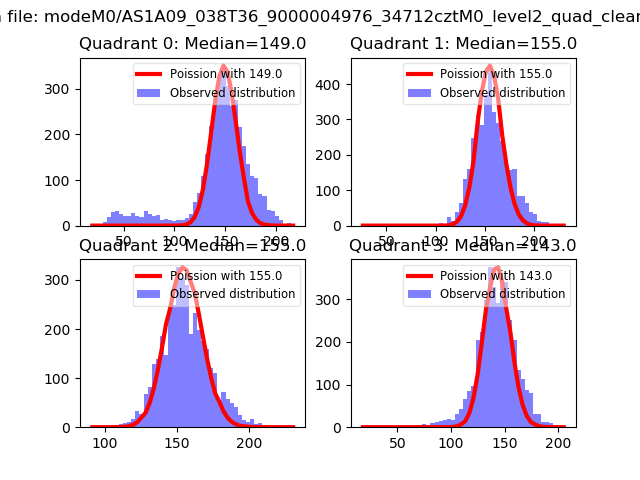 |
 |
| Quadrant-wise count rates Data is divided into 100 sec bins |
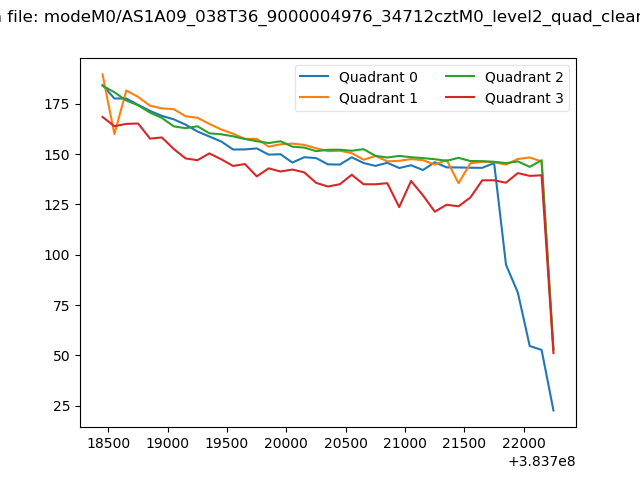 |
|
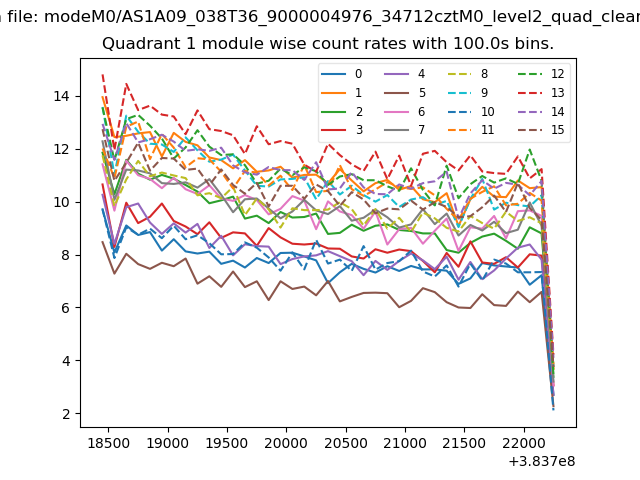
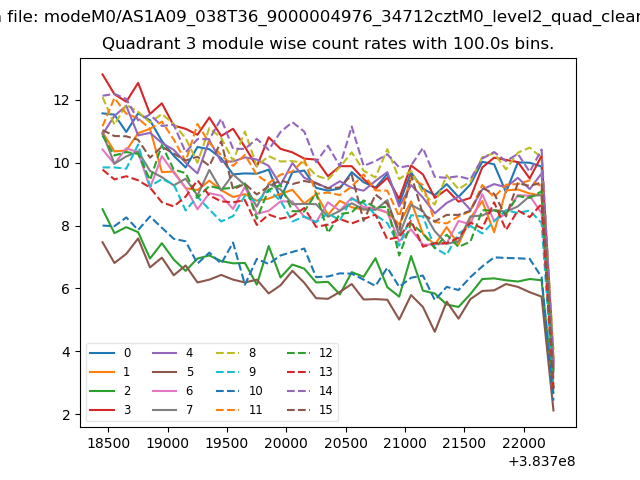
| Module-wise count rates for Quadrant A Data is divided into 100 sec bins |
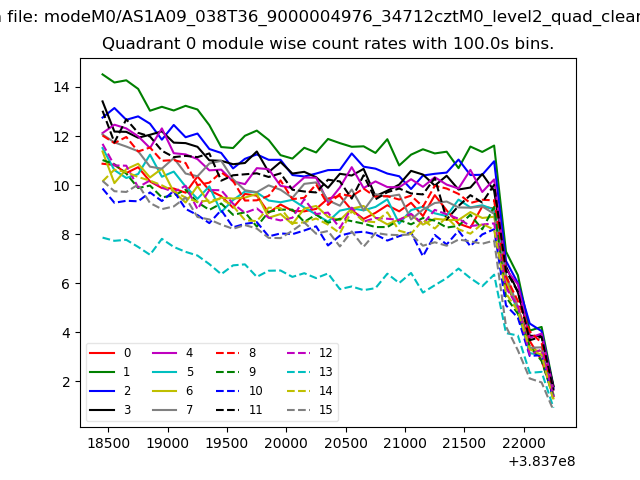 |
 |
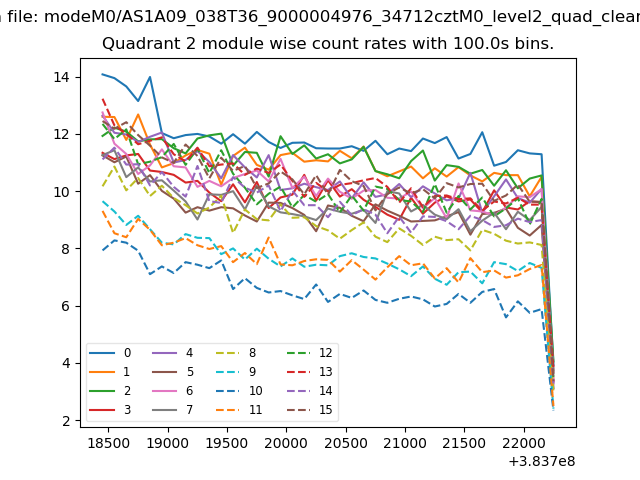
| Module-wise count rates for Quadrant B Data is divided into 100 sec bins |
 |
 |
| Module-wise count rates for Quadrant C Data is divided into 100 sec bins |
 |
 |
| Module-wise count rates for Quadrant D Data is divided into 100 sec bins |
 |
 |
| Parameter | Plot |
|---|---|
| CZT HV Monitor | 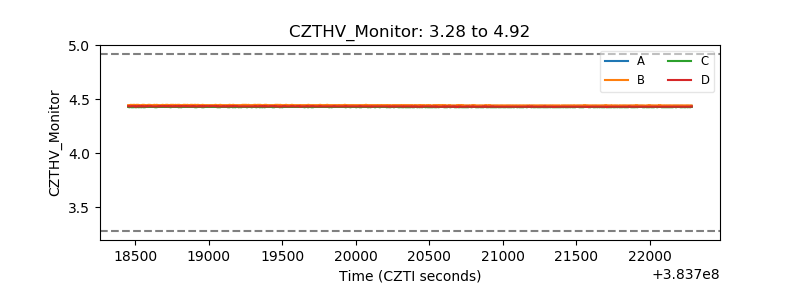 |
| D_VDD | 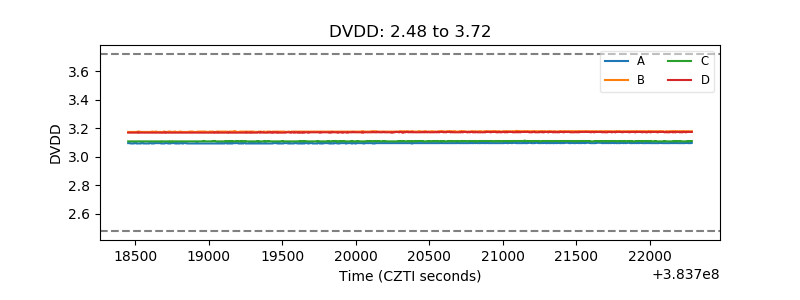 |
| Temperature 1 | 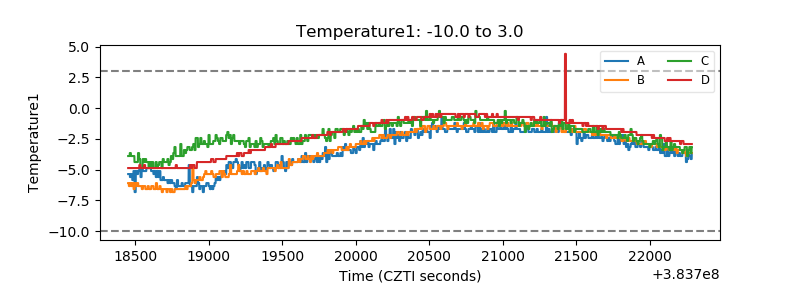 |
| Veto HV Monitor | 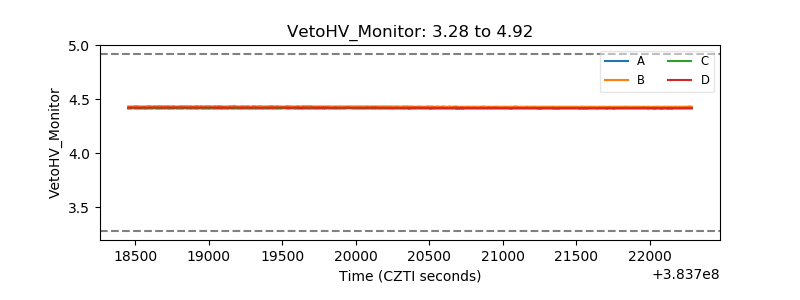 |
| Veto LLD | 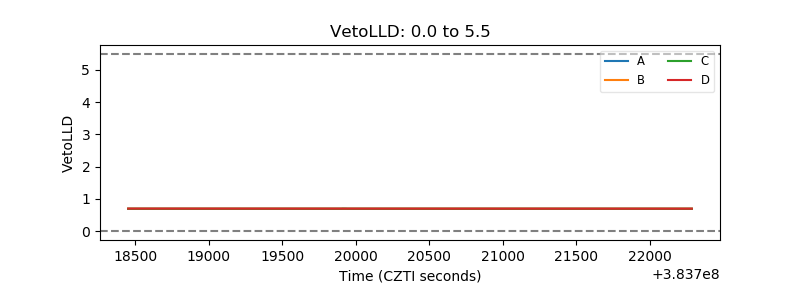 |
| Alpha Counter | 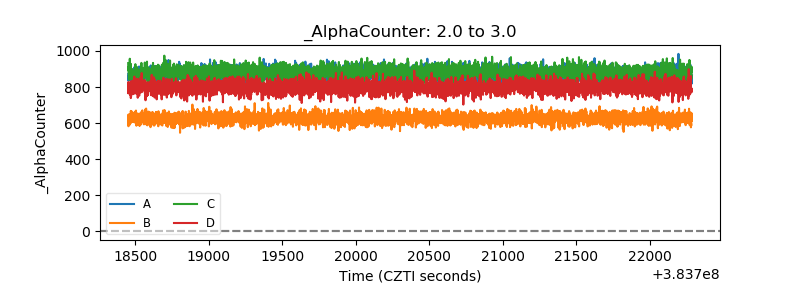 |
| _CPM_Rate | 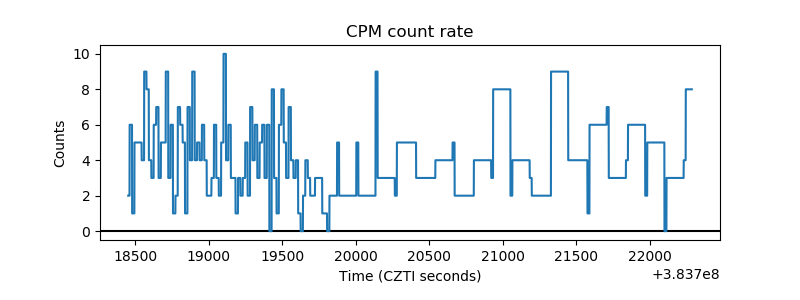 |
| CZT Counter | 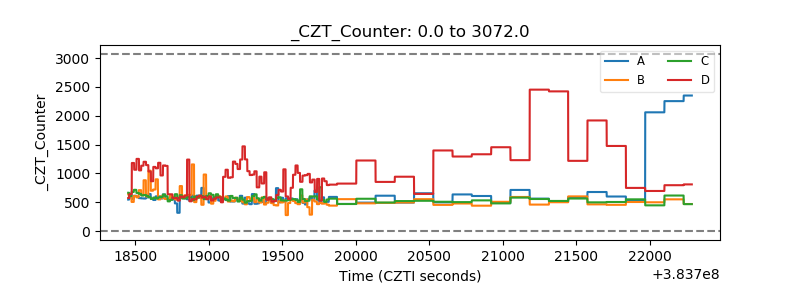 |
| +2.5 Volts monitor | 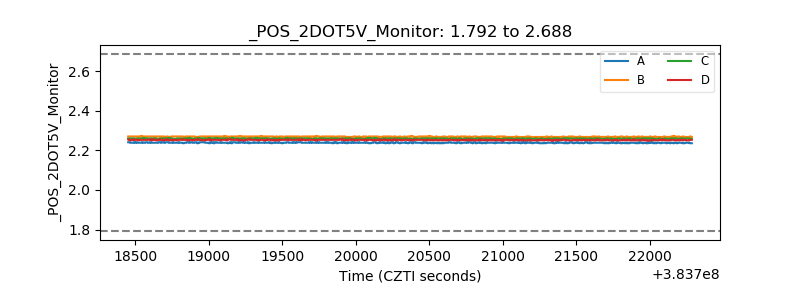 |
| +5 Volts monitor | 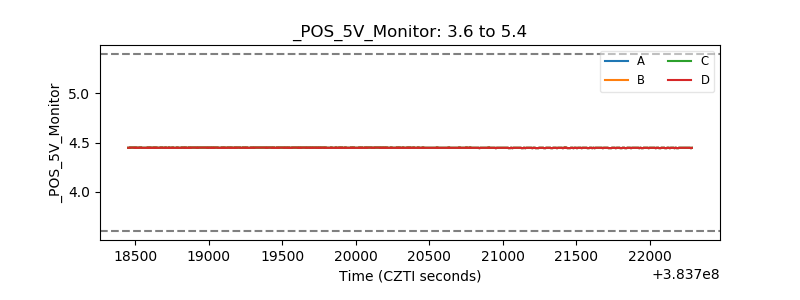 |
| _ROLL_ROT | 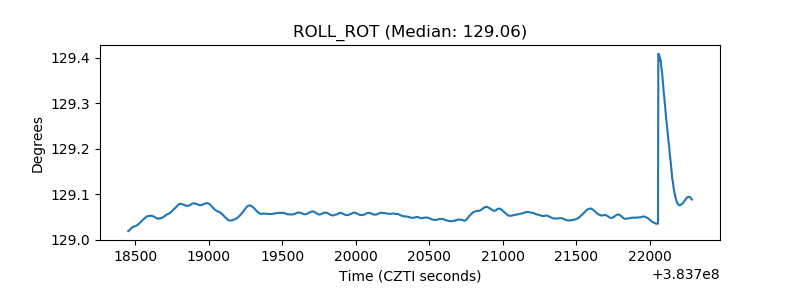 |
| _Roll_DEC | 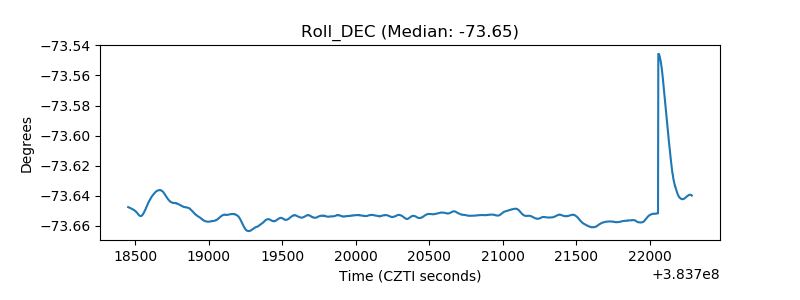 |
| _Roll_RA | 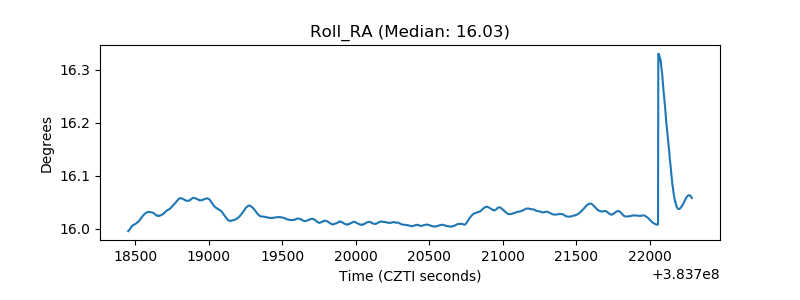 |
| Veto Counter | 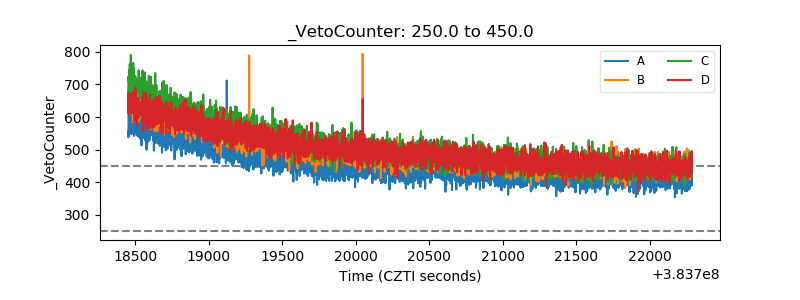 |