| Param | Original file | Final file |
|---|---|---|
| Filename | modeM0/AS1A09_038T36_9000004976_34709cztM0_level2.evt | modeM0/AS1A09_038T36_9000004976_34709cztM0_level2_quad_clean.evt |
| Size (bytes) | 567,889,920 | 104,316,480 |
| Size | 541.6 MB | 99.5 MB |
| Events in quadrant A | 6,345,977 | 676,907 |
| Events in quadrant B | 2,770,847 | 738,272 |
| Events in quadrant C | 2,821,444 | 715,604 |
| Events in quadrant D | 4,903,442 | 658,326 |
| Mode M9 | |||
|---|---|---|---|
| Quadrant | BADHDUFLAG | Total packets | Discarded packets |
| A | 0 | 26 | 0 |
| B | 0 | 26 | 0 |
| C | 0 | 26 | 0 |
| D | 0 | 27 | 0 |
| Mode M0 | |||
|---|---|---|---|
| Quadrant | BADHDUFLAG | Total packets | Discarded packets |
| A | 0 | 22509 | 3 |
| B | 0 | 11507 | 2 |
| C | 0 | 11367 | 2 |
| D | 0 | 18278 | 2 |
| Mode SS | |||
|---|---|---|---|
| Quadrant | BADHDUFLAG | Total packets | Discarded packets |
| A | 0 | 108 | 0 |
| B | 0 | 108 | 0 |
| C | 0 | 108 | 0 |
| D | 0 | 108 | 0 |
| Quadrant | Total seconds | Saturated seconds | Saturation percentage |
|---|---|---|---|
| A | 5281 | 599 | 11.342549% |
| B | 5281 | 55 | 1.041469% |
| C | 5281 | 50 | 0.946790% |
| D | 5281 | 269 | 5.093732% |
Noise dominated data is calculated using 1-second bins in cleaned event files. If a bin has >2000 counts, and if more than 50% of those come from <1% of pixels, then it is considered to be noise-dominated and hence unusable.
| Quadrant | # 1 sec bins | Bins with >0 counts | Bins with >2000 counts | High rate bins dominated by noise | Noise dominated (total time) | Noise dominated (detector-on time) | Marked lightcurve |
|---|---|---|---|---|---|---|---|
| A | 7104 | 5282 | 413 | 413 | 5.81% | 7.82% | 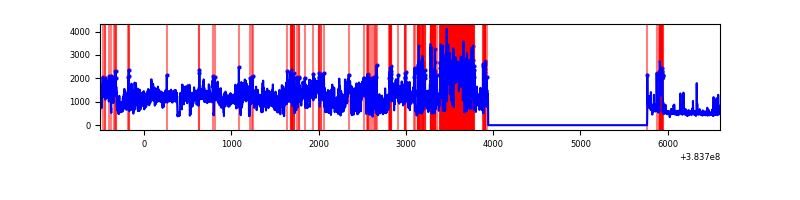 |
| B | 7104 | 5282 | 23 | 23 | 0.32% | 0.44% | 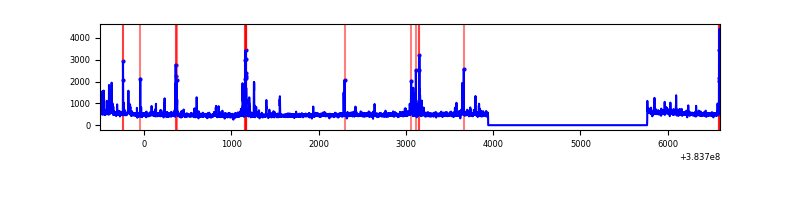 |
| C | 7104 | 5282 | 29 | 29 | 0.41% | 0.55% | 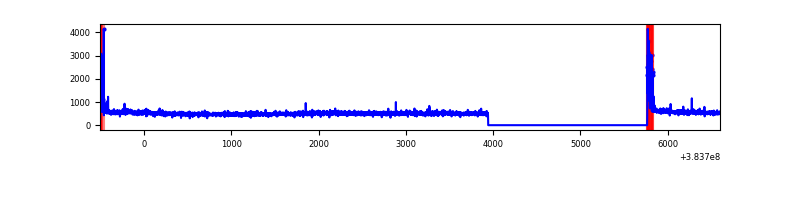 |
| D | 7104 | 5282 | 216 | 216 | 3.04% | 4.09% | 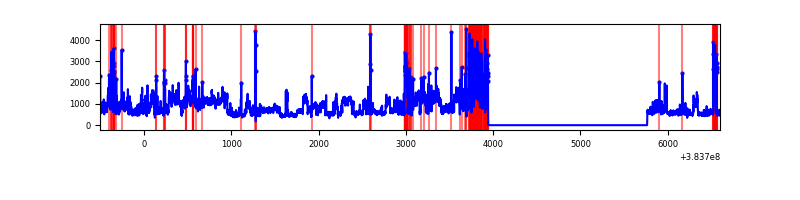 |
Top three noisy pixels from each quadrant. If the there are fewer than three noisy pixels in the level2.evt file, extra rows are filled as -1
| Pixel properties | Quadrant properties | ||||||
|---|---|---|---|---|---|---|---|
| Quadrant | DetID | PixID | Counts | Sigma | Mean | Median | Sigma |
| A | 15 | 169 | 3893582 | 32434.76 | 607 | 595 | 120.0 |
| A | 10 | 83 | 46614 | 383.41 | 607 | 595 | 120.0 |
| A | 9 | 143 | 28808 | 235.06 | 607 | 595 | 120.0 |
| B | 5 | 172 | 105374 | 882.5 | 631 | 615 | 118.7 |
| B | 0 | 155 | 46760 | 388.73 | 631 | 615 | 118.7 |
| B | 5 | 255 | 27404 | 225.67 | 631 | 615 | 118.7 |
| C | 15 | 214 | 225410 | 1584.55 | 620 | 623 | 141.9 |
| C | 0 | 10 | 131087 | 919.66 | 620 | 623 | 141.9 |
| C | 15 | 159 | 20352 | 139.07 | 620 | 623 | 141.9 |
| D | 8 | 195 | 1421246 | 8802.78 | 598 | 586 | 161.4 |
| D | 12 | 233 | 320080 | 1979.67 | 598 | 586 | 161.4 |
| D | 13 | 249 | 186124 | 1149.64 | 598 | 586 | 161.4 |
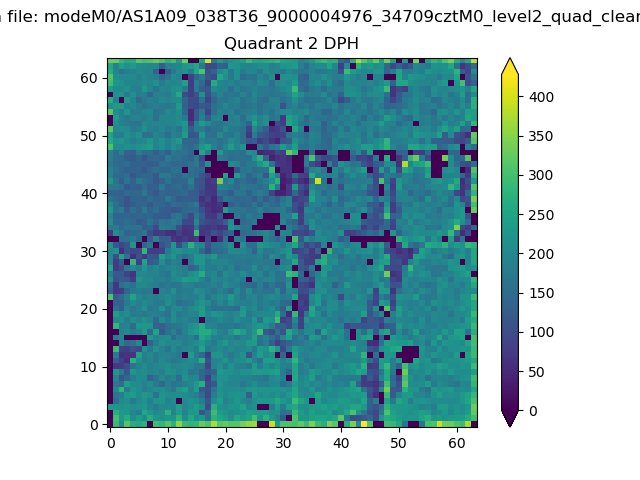
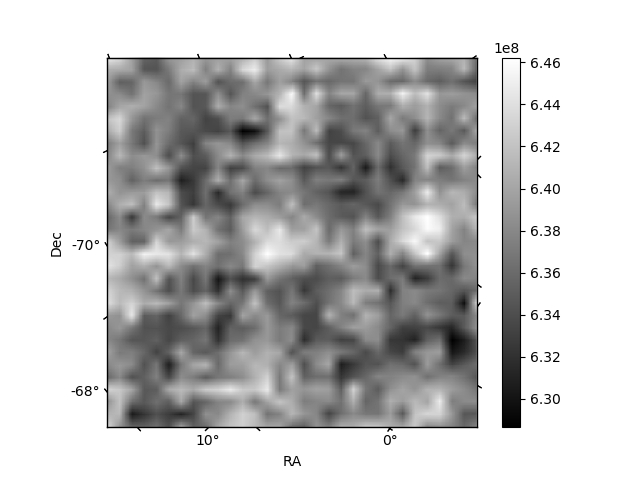
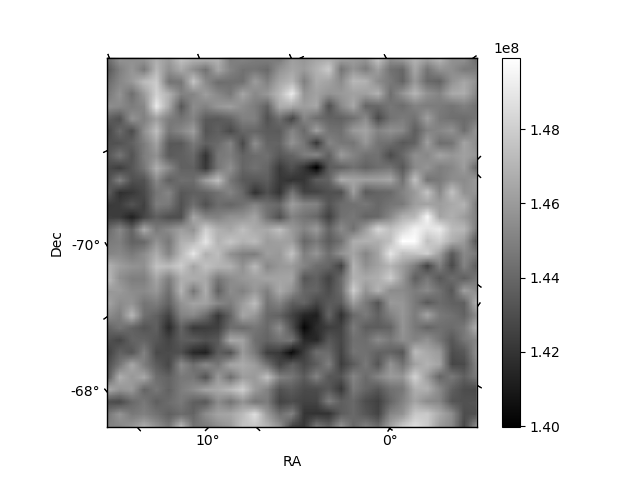
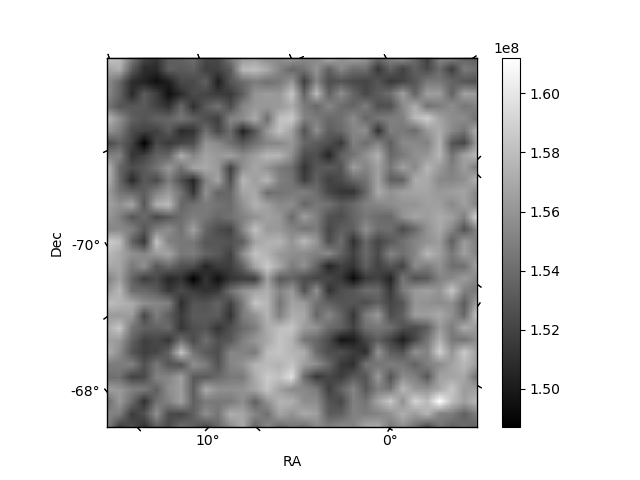
Histogram calculated using DETX and DETY for each event in the final _common_clean file
| Quadrant A | 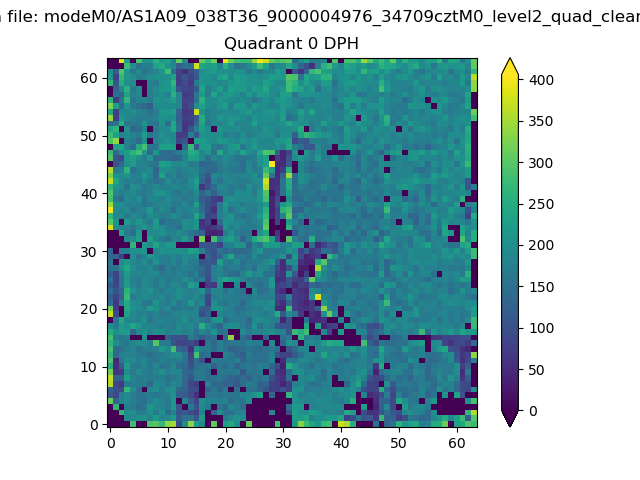 |
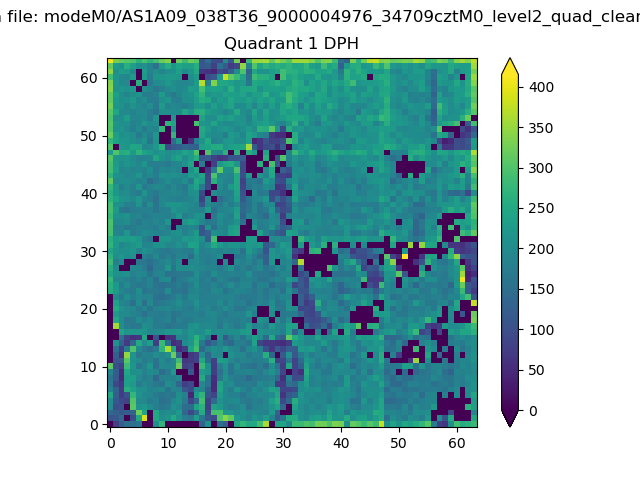 |
Quadrant B |
|---|---|---|---|
| Quadrant D | 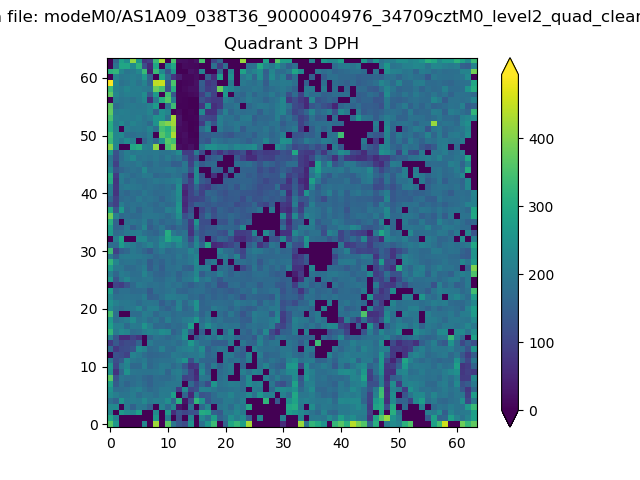 |
 |
Quadrant C |
| Plot type | Count rate plots | Images |
|---|---|---|
| Comparison with Poisson distribution Blue bars denote a histogram of data divided into 1 sec bins. Red curve is a Poisson curve with rate = median count rate of data. |
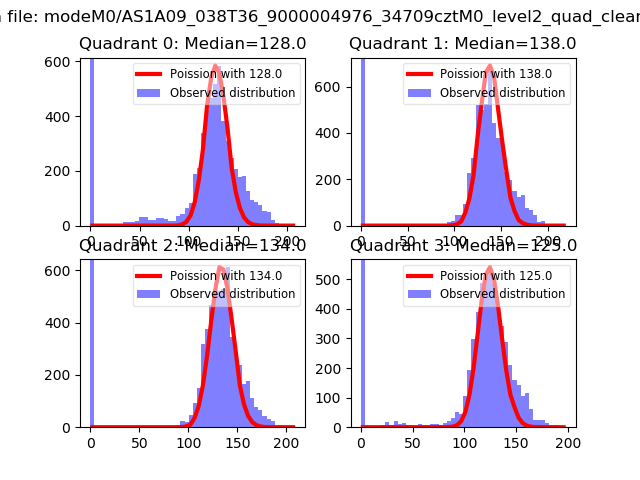 |
 |
| Quadrant-wise count rates Data is divided into 100 sec bins |
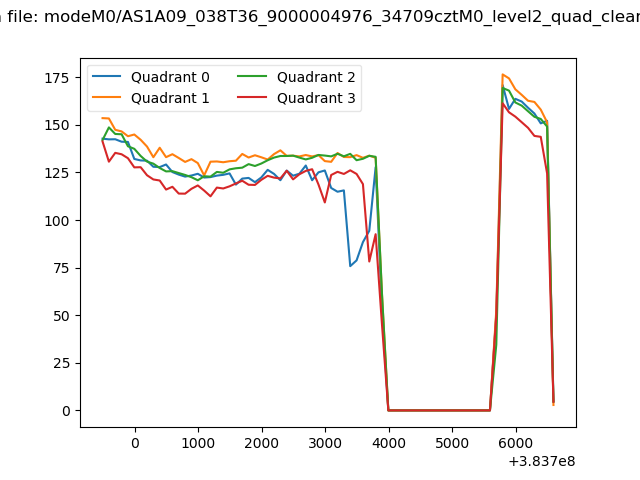 |
|
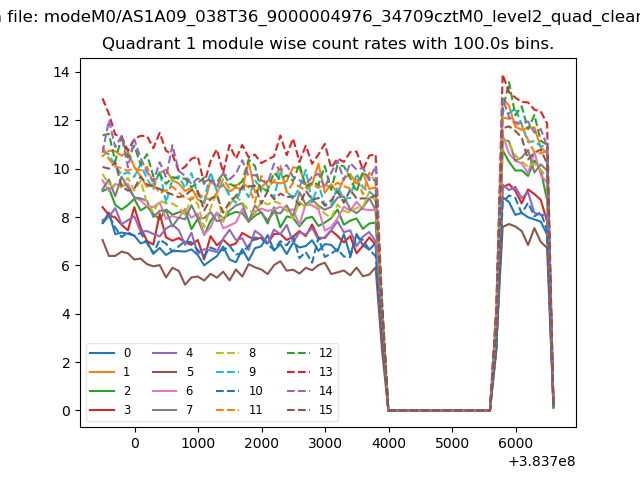
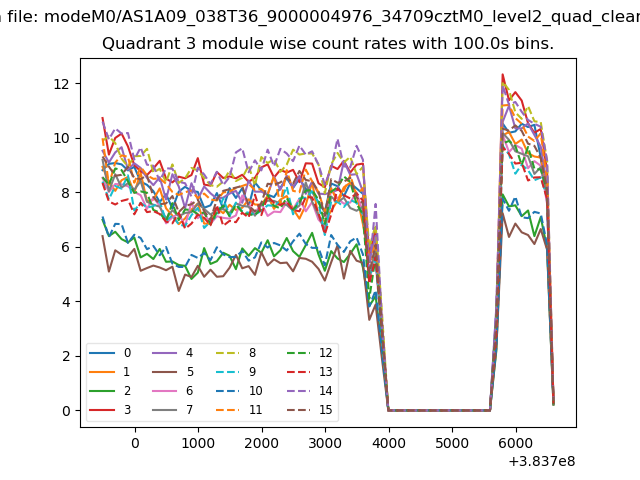
| Module-wise count rates for Quadrant A Data is divided into 100 sec bins |
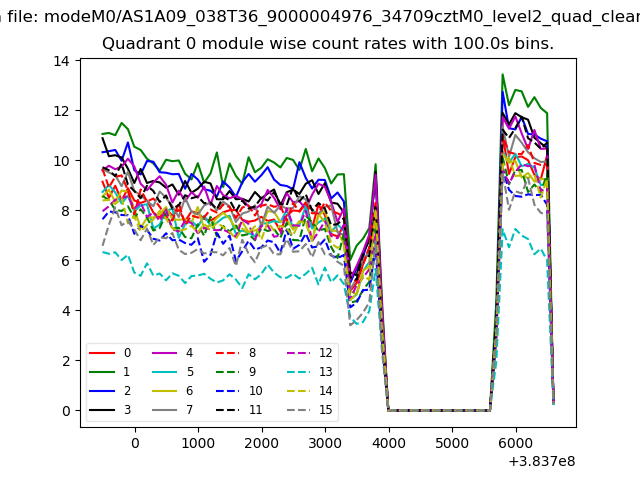 |
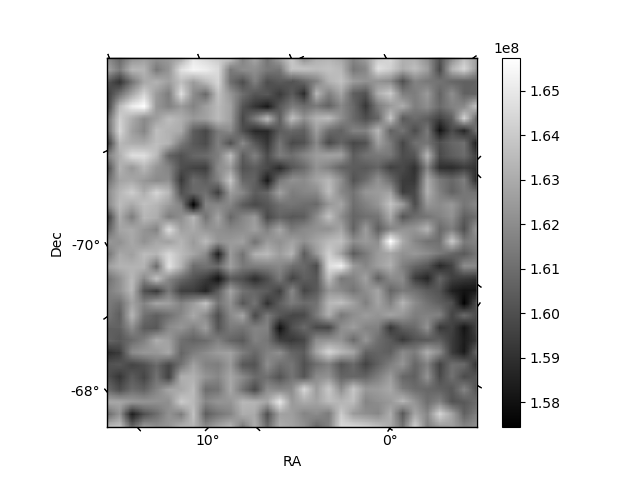 |
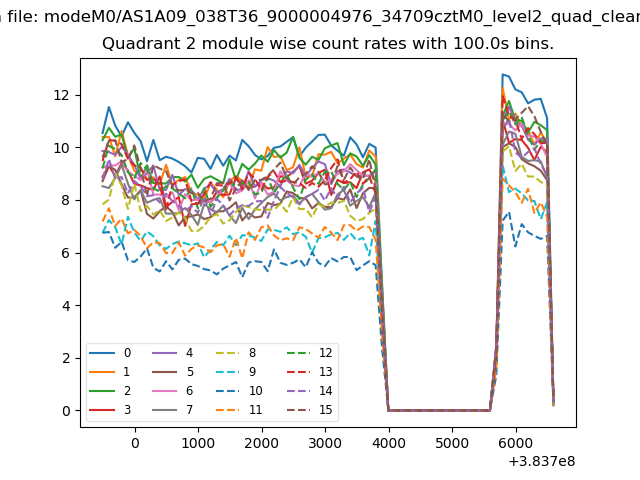
| Module-wise count rates for Quadrant B Data is divided into 100 sec bins |
 |
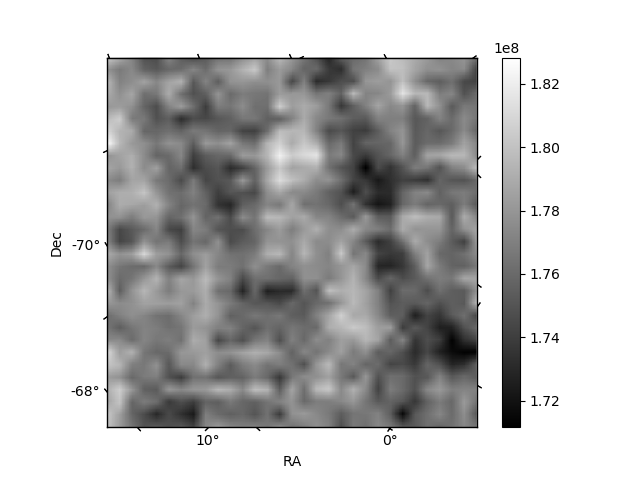 |
| Module-wise count rates for Quadrant C Data is divided into 100 sec bins |
 |
 |
| Module-wise count rates for Quadrant D Data is divided into 100 sec bins |
 |
 |
| Parameter | Plot |
|---|---|
| CZT HV Monitor | 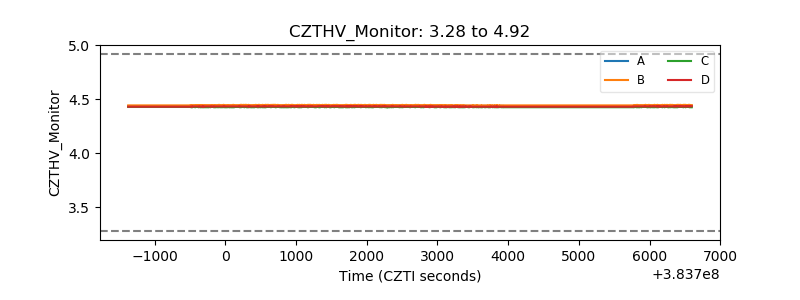 |
| D_VDD | 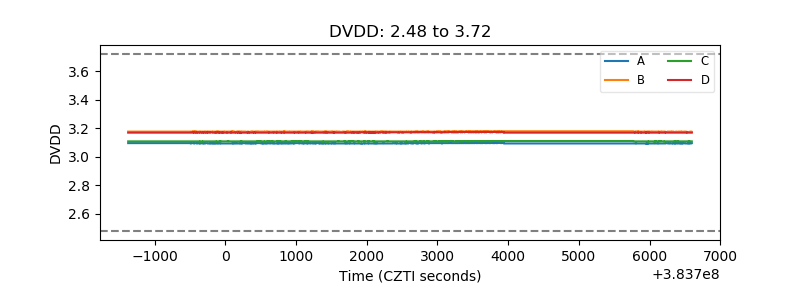 |
| Temperature 1 | 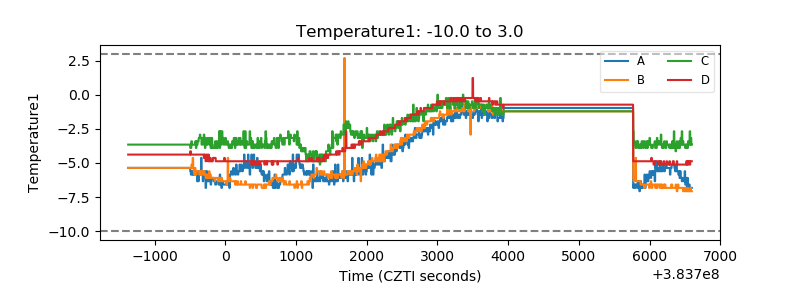 |
| Veto HV Monitor | 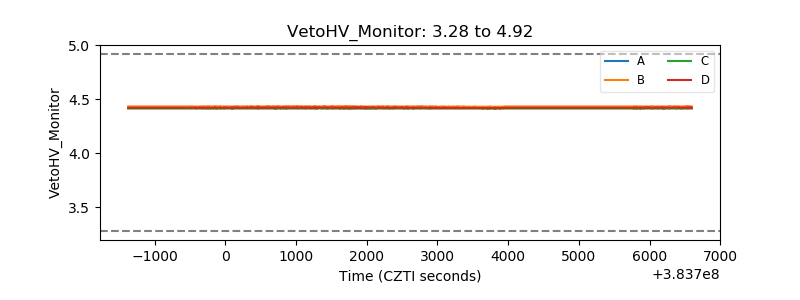 |
| Veto LLD | 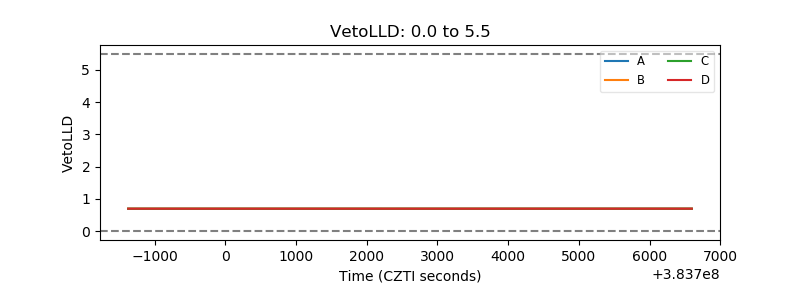 |
| Alpha Counter | 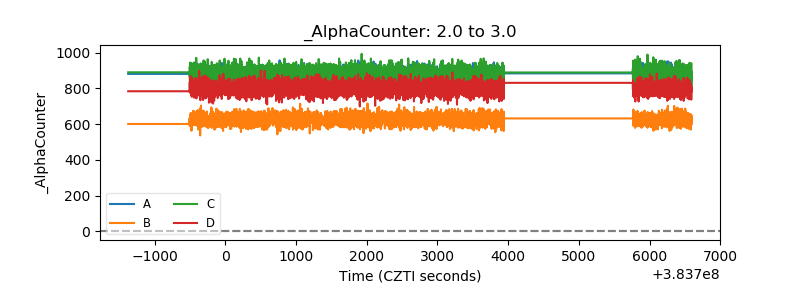 |
| _CPM_Rate | 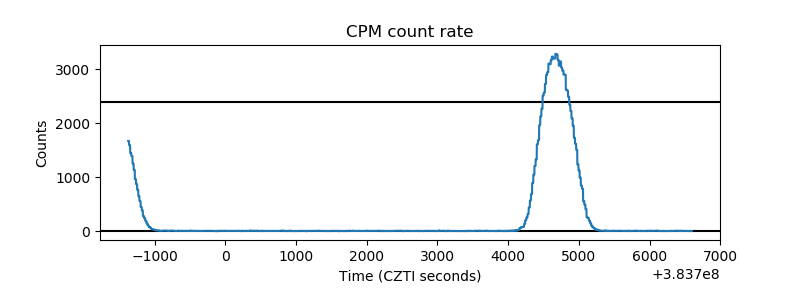 |
| CZT Counter | 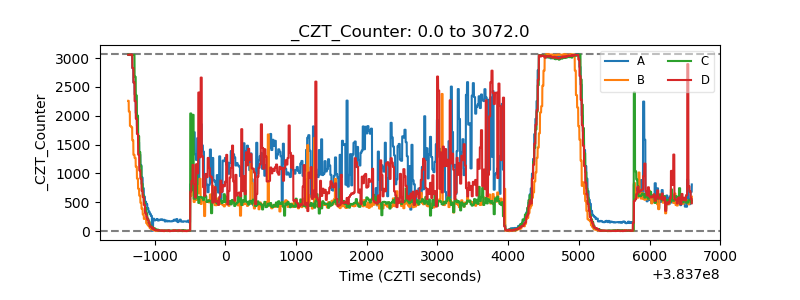 |
| +2.5 Volts monitor | 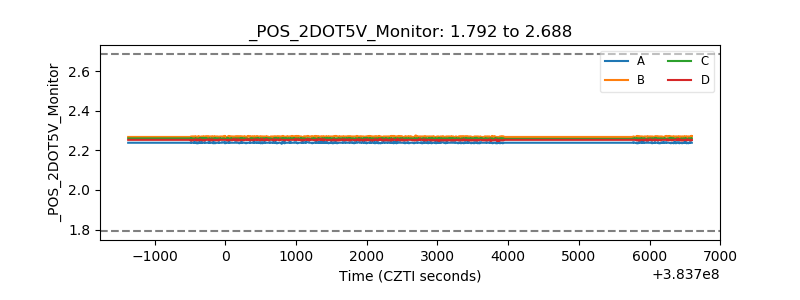 |
| +5 Volts monitor | 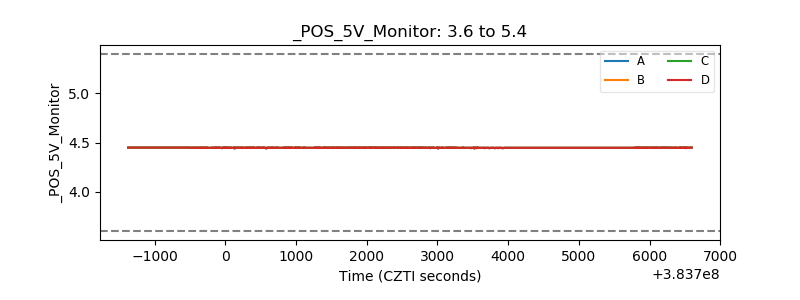 |
| _ROLL_ROT | 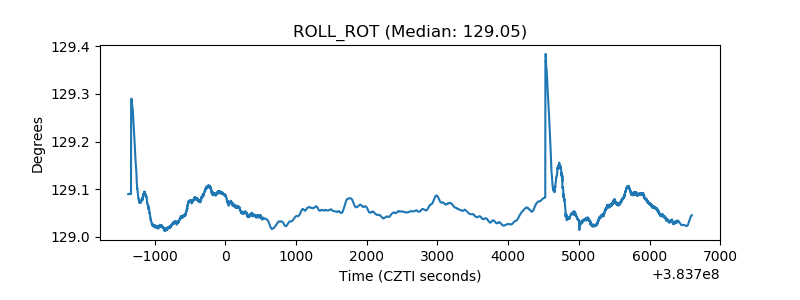 |
| _Roll_DEC | 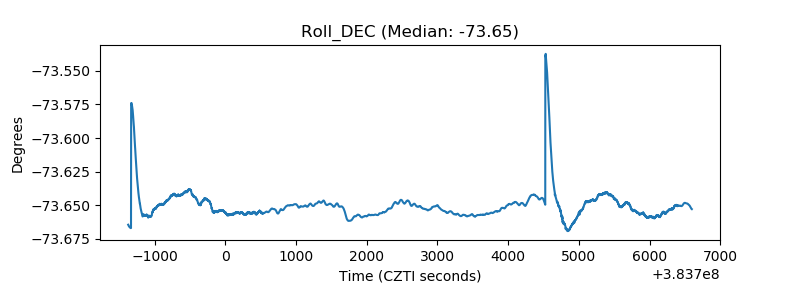 |
| _Roll_RA | 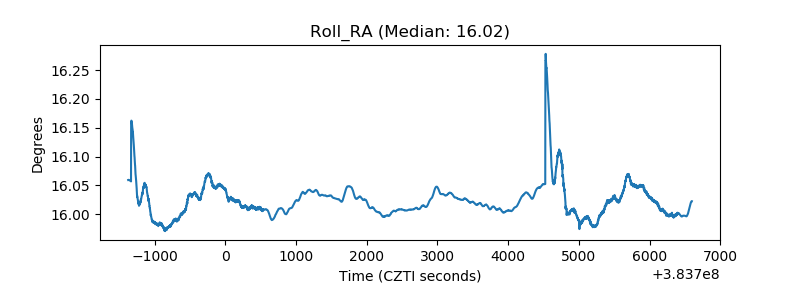 |
| Veto Counter | 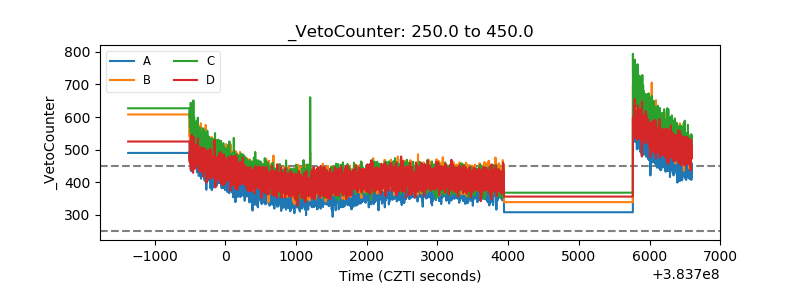 |