| Param | Original file | Final file |
|---|---|---|
| Filename | modeM0/AS1A09_038T36_9000004976_34707cztM0_level2.evt | modeM0/AS1A09_038T36_9000004976_34707cztM0_level2_quad_clean.evt |
| Size (bytes) | 390,366,720 | 78,681,600 |
| Size | 372.3 MB | 75.0 MB |
| Events in quadrant A | 2,670,875 | 533,142 |
| Events in quadrant B | 2,628,388 | 534,586 |
| Events in quadrant C | 2,111,828 | 531,361 |
| Events in quadrant D | 4,128,831 | 490,626 |
| Mode M9 | |||
|---|---|---|---|
| Quadrant | BADHDUFLAG | Total packets | Discarded packets |
| A | 0 | 17 | 0 |
| B | 0 | 17 | 0 |
| C | 0 | 17 | 0 |
| D | 0 | 17 | 0 |
| Mode M0 | |||
|---|---|---|---|
| Quadrant | BADHDUFLAG | Total packets | Discarded packets |
| A | 0 | 10648 | 2 |
| B | 0 | 10512 | 1 |
| C | 0 | 8642 | 1 |
| D | 0 | 15236 | 1 |
| Mode SS | |||
|---|---|---|---|
| Quadrant | BADHDUFLAG | Total packets | Discarded packets |
| A | 0 | 84 | 0 |
| B | 0 | 84 | 0 |
| C | 0 | 84 | 0 |
| D | 0 | 84 | 0 |
| Quadrant | Total seconds | Saturated seconds | Saturation percentage |
|---|---|---|---|
| A | 4161 | 37 | 0.889209% |
| B | 4161 | 188 | 4.518145% |
| C | 4161 | 16 | 0.384523% |
| D | 4161 | 142 | 3.412641% |
Noise dominated data is calculated using 1-second bins in cleaned event files. If a bin has >2000 counts, and if more than 50% of those come from <1% of pixels, then it is considered to be noise-dominated and hence unusable.
| Quadrant | # 1 sec bins | Bins with >0 counts | Bins with >2000 counts | High rate bins dominated by noise | Noise dominated (total time) | Noise dominated (detector-on time) | Marked lightcurve |
|---|---|---|---|---|---|---|---|
| A | 5833 | 4162 | 13 | 13 | 0.22% | 0.31% | 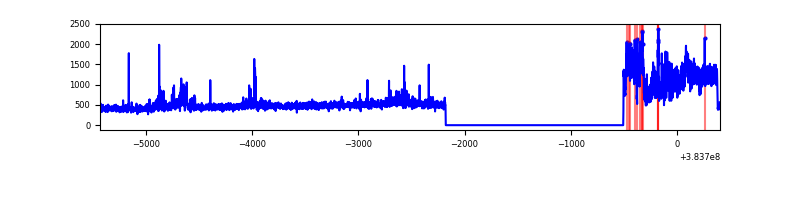 |
| B | 5833 | 4162 | 126 | 126 | 2.16% | 3.03% | 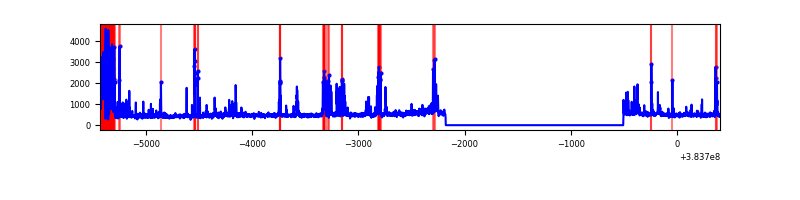 |
| C | 5833 | 4162 | 8 | 8 | 0.14% | 0.19% | 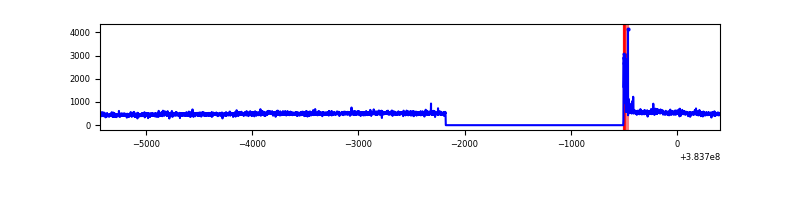 |
| D | 5833 | 4162 | 108 | 108 | 1.85% | 2.59% | 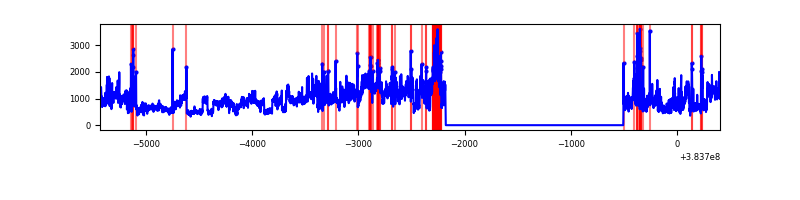 |
Top three noisy pixels from each quadrant. If the there are fewer than three noisy pixels in the level2.evt file, extra rows are filled as -1
| Pixel properties | Quadrant properties | ||||||
|---|---|---|---|---|---|---|---|
| Quadrant | DetID | PixID | Counts | Sigma | Mean | Median | Sigma |
| A | 15 | 169 | 747129 | 7680.05 | 484 | 475 | 97.2 |
| A | 10 | 83 | 27128 | 274.15 | 484 | 475 | 97.2 |
| A | 9 | 143 | 14347 | 142.69 | 484 | 475 | 97.2 |
| B | 5 | 255 | 338634 | 3733.38 | 474 | 460 | 90.6 |
| B | 5 | 172 | 205321 | 2261.63 | 474 | 460 | 90.6 |
| B | 4 | 171 | 69735 | 764.78 | 474 | 460 | 90.6 |
| C | 15 | 214 | 175136 | 1593.61 | 474 | 477 | 109.6 |
| C | 0 | 10 | 46647 | 421.26 | 474 | 477 | 109.6 |
| C | 15 | 159 | 17755 | 157.65 | 474 | 477 | 109.6 |
| D | 8 | 195 | 1512650 | 12156.79 | 463 | 451 | 124.4 |
| D | 12 | 227 | 369420 | 2966.2 | 463 | 451 | 124.4 |
| D | 2 | 250 | 131185 | 1050.99 | 463 | 451 | 124.4 |
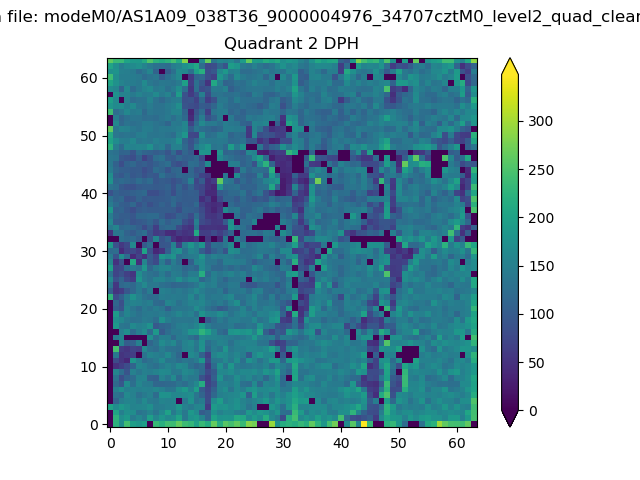
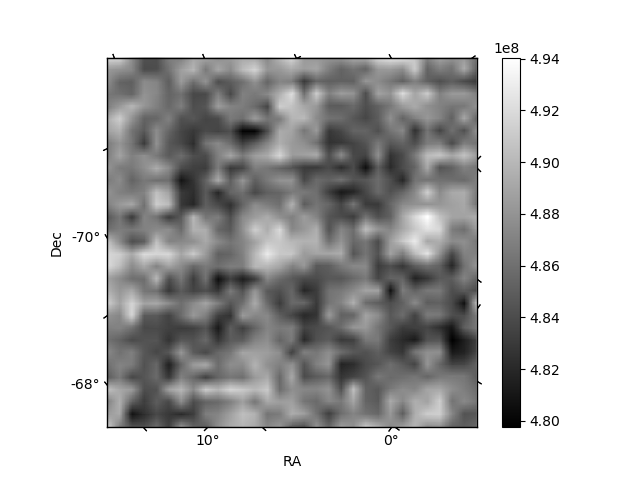
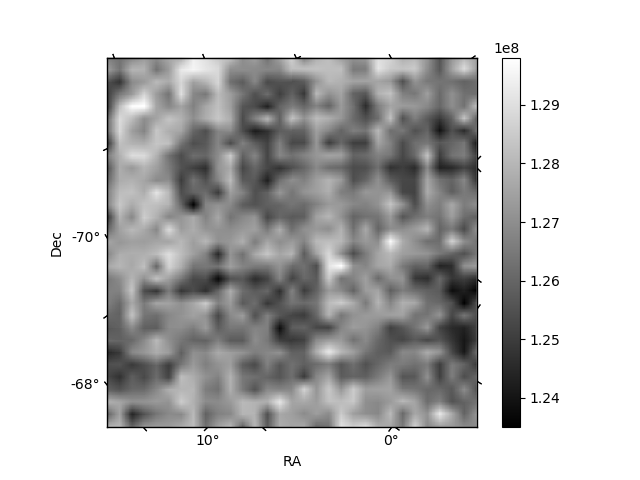
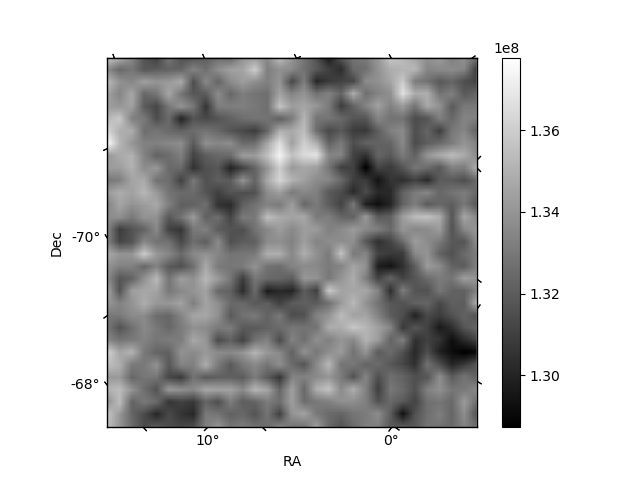
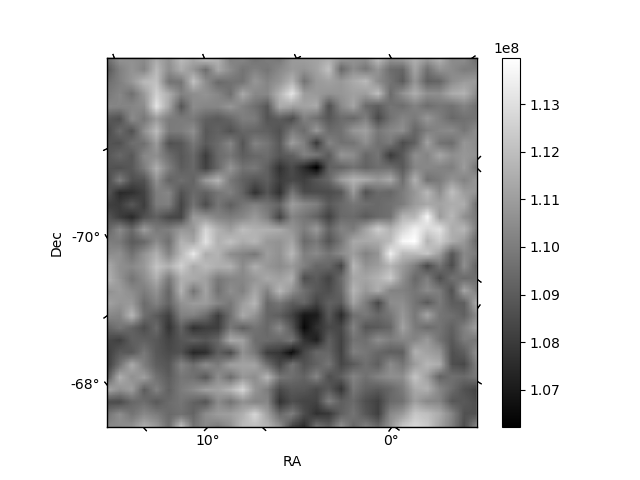
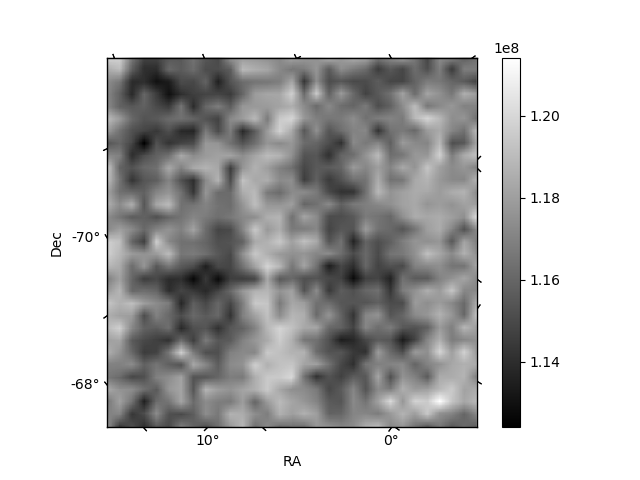
Histogram calculated using DETX and DETY for each event in the final _common_clean file
| Quadrant A | 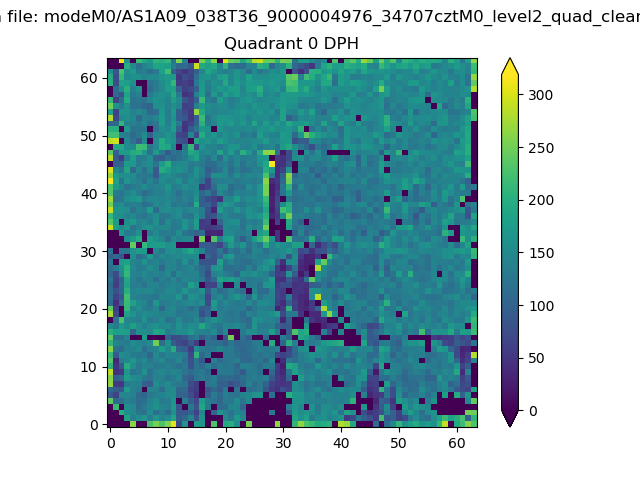 |
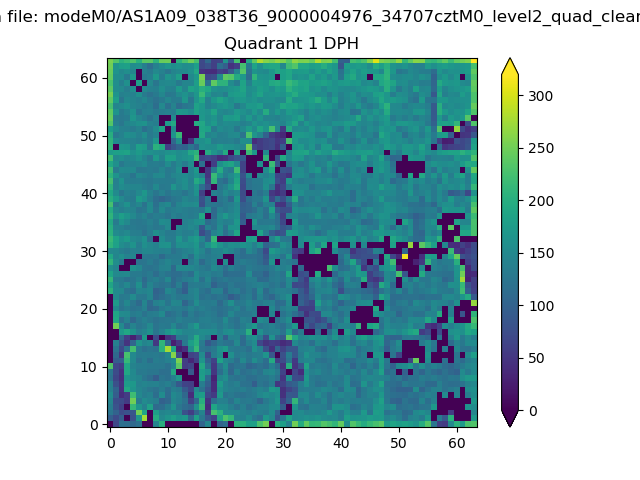 |
Quadrant B |
|---|---|---|---|
| Quadrant D | 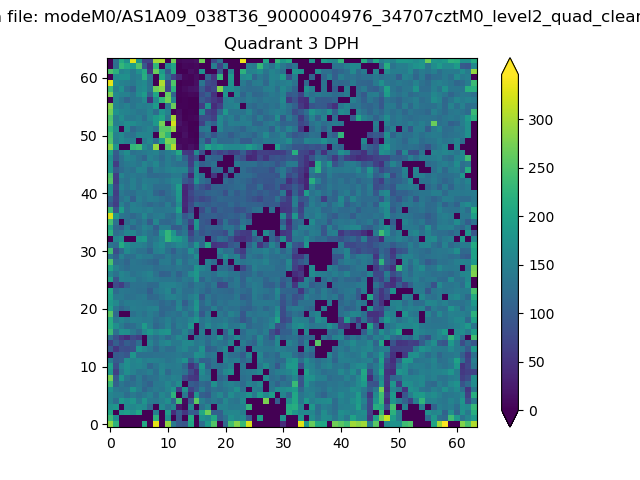 |
 |
Quadrant C |
| Plot type | Count rate plots | Images |
|---|---|---|
| Comparison with Poisson distribution Blue bars denote a histogram of data divided into 1 sec bins. Red curve is a Poisson curve with rate = median count rate of data. |
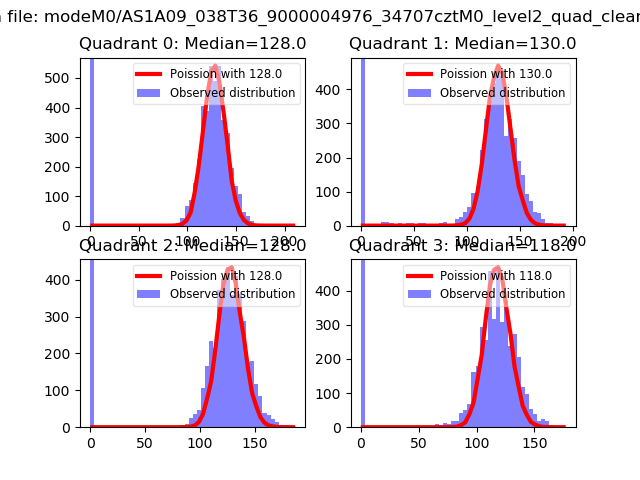 |
 |
| Quadrant-wise count rates Data is divided into 100 sec bins |
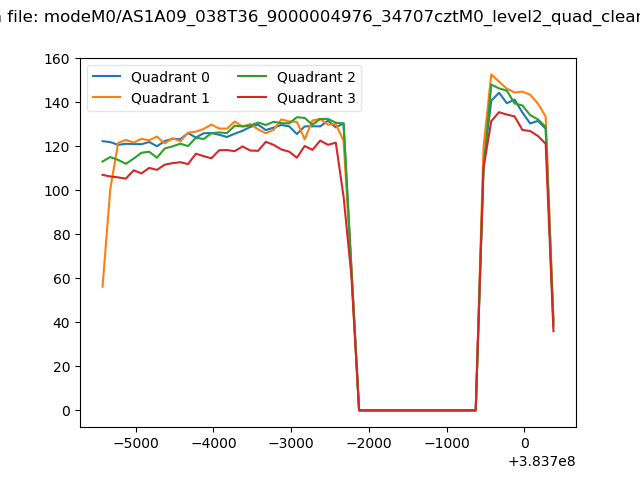 |
|
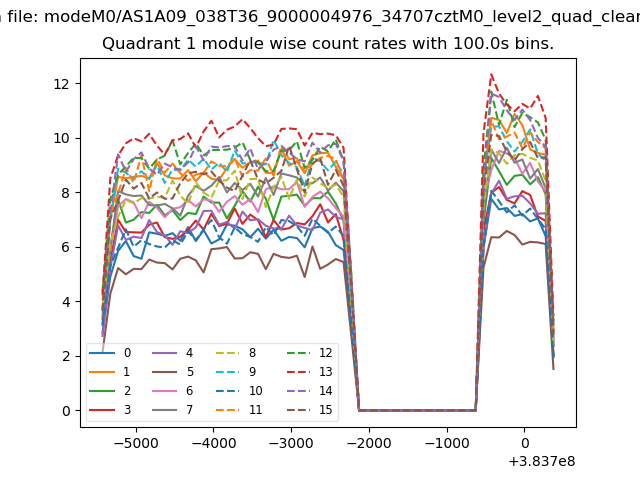
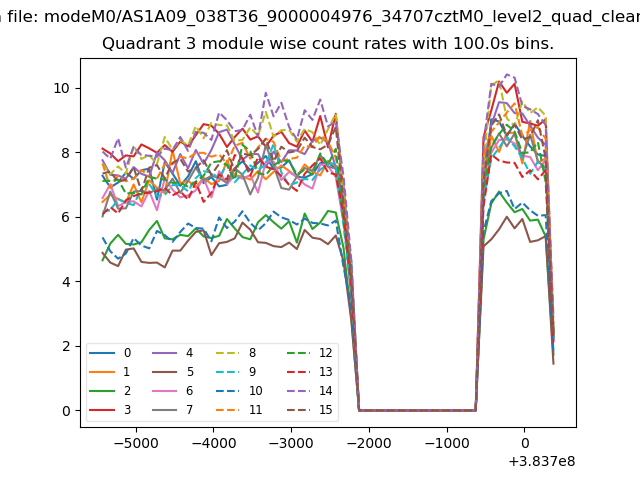
| Module-wise count rates for Quadrant A Data is divided into 100 sec bins |
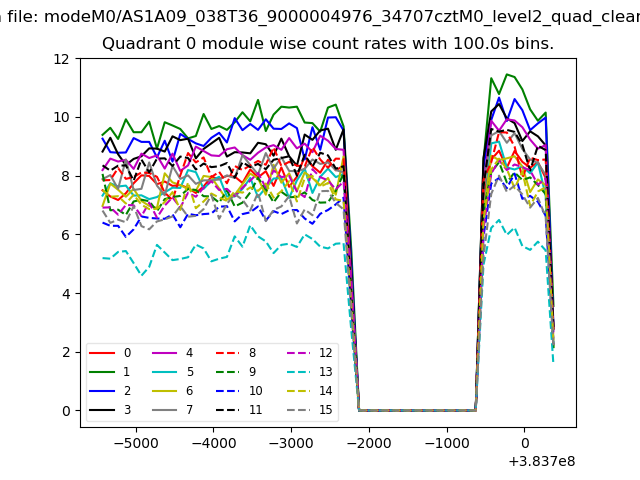 |
 |
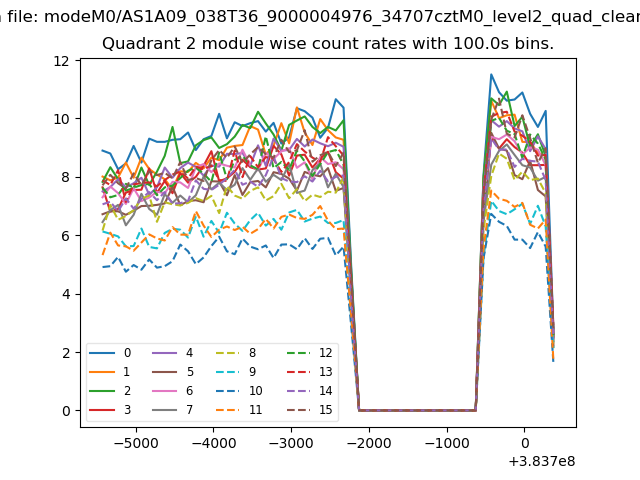
| Module-wise count rates for Quadrant B Data is divided into 100 sec bins |
 |
 |
| Module-wise count rates for Quadrant C Data is divided into 100 sec bins |
 |
 |
| Module-wise count rates for Quadrant D Data is divided into 100 sec bins |
 |
 |
| Parameter | Plot |
|---|---|
| CZT HV Monitor |  |
| D_VDD | 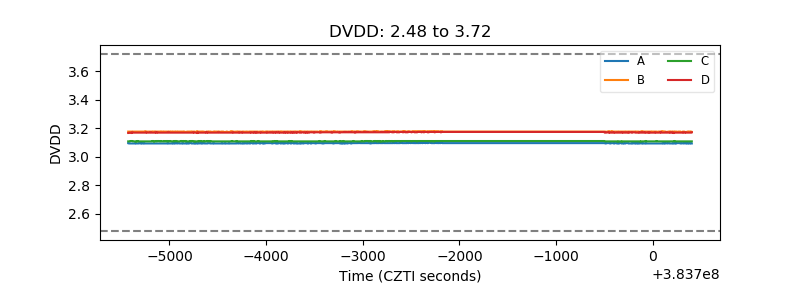 |
| Temperature 1 | 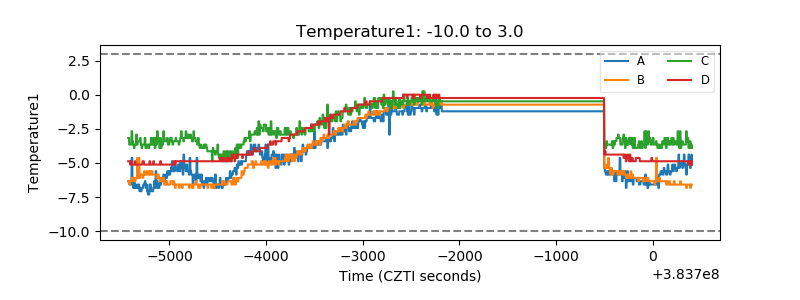 |
| Veto HV Monitor | 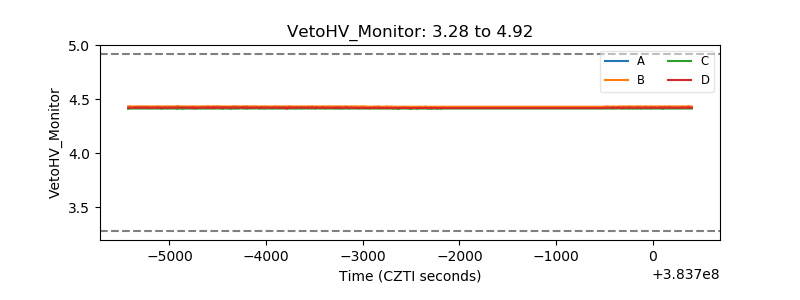 |
| Veto LLD | 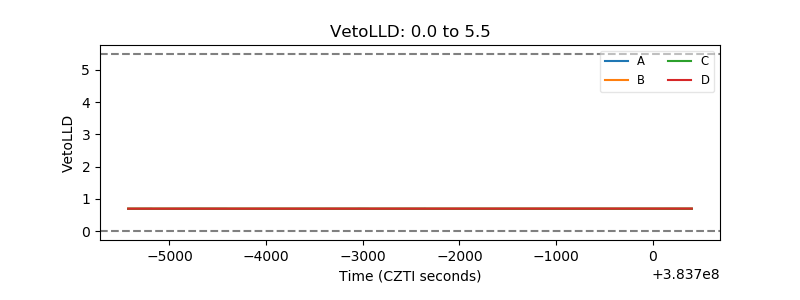 |
| Alpha Counter | 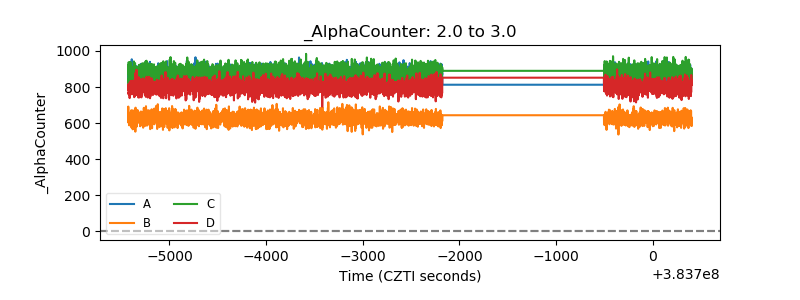 |
| _CPM_Rate | 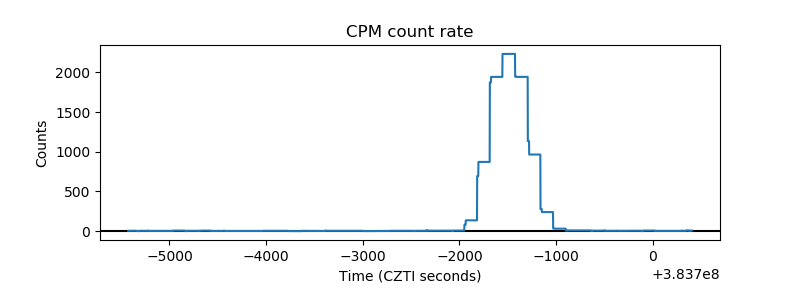 |
| CZT Counter | 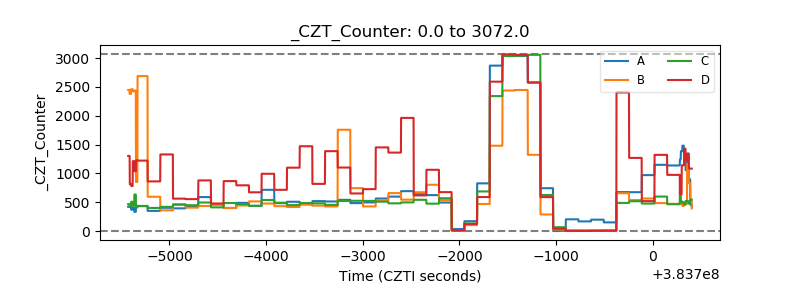 |
| +2.5 Volts monitor | 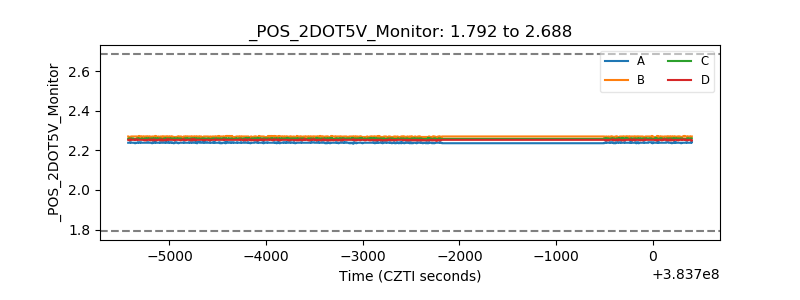 |
| +5 Volts monitor | 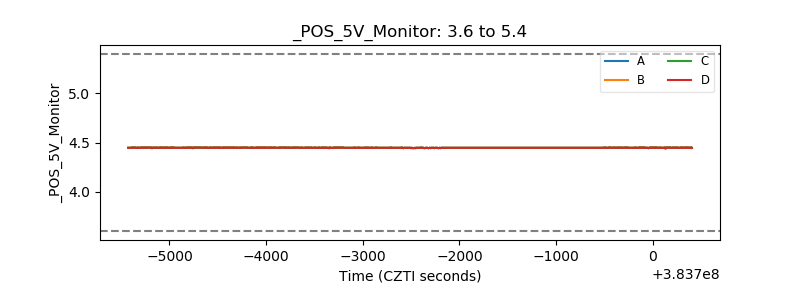 |
| _ROLL_ROT |  |
| _Roll_DEC | 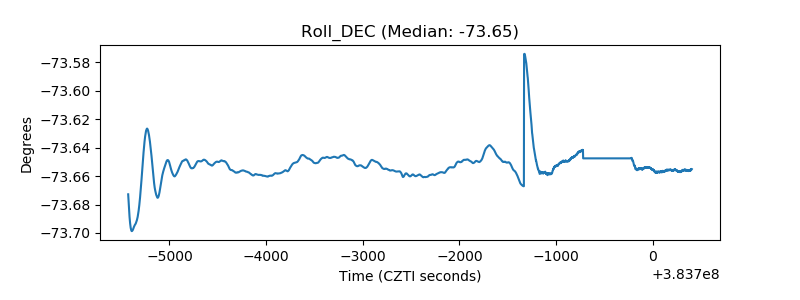 |
| _Roll_RA | 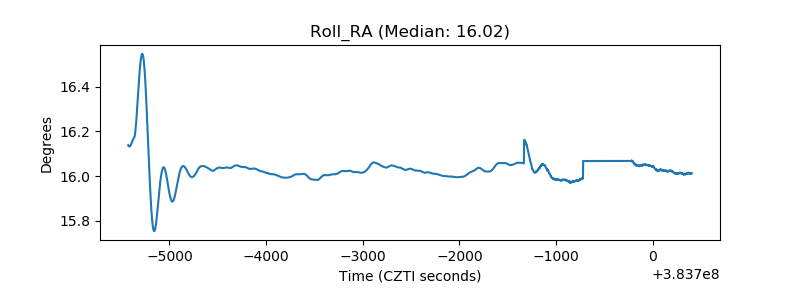 |
| Veto Counter | 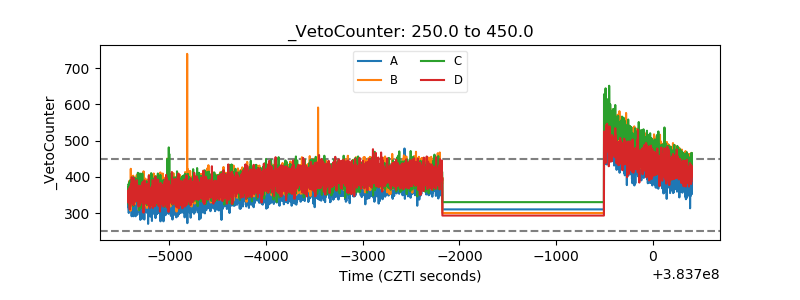 |