| Param | Original file | Final file |
|---|---|---|
| Filename | modeM0/AS1A09_038T30_9000004974_34707cztM0_level2.evt | modeM0/AS1A09_038T30_9000004974_34707cztM0_level2_quad_clean.evt |
| Size (bytes) | 350,383,680 | 69,485,760 |
| Size | 334.2 MB | 66.3 MB |
| Events in quadrant A | 3,104,721 | 439,141 |
| Events in quadrant B | 2,130,686 | 484,596 |
| Events in quadrant C | 1,901,301 | 474,384 |
| Events in quadrant D | 3,216,618 | 438,152 |
| Mode SS | |||
|---|---|---|---|
| Quadrant | BADHDUFLAG | Total packets | Discarded packets |
| A | 0 | 78 | 0 |
| B | 0 | 78 | 0 |
| C | 0 | 78 | 0 |
| D | 0 | 78 | 0 |
| Mode M0 | |||
|---|---|---|---|
| Quadrant | BADHDUFLAG | Total packets | Discarded packets |
| A | 0 | 11566 | 0 |
| B | 0 | 8738 | 0 |
| C | 0 | 7778 | 0 |
| D | 0 | 12112 | 0 |
| Mode M9 | |||
|---|---|---|---|
| Quadrant | BADHDUFLAG | Total packets | Discarded packets |
| A | 0 | 16 | 0 |
| B | 0 | 16 | 0 |
| C | 0 | 16 | 0 |
| D | 0 | 16 | 0 |
| Quadrant | Total seconds | Saturated seconds | Saturation percentage |
|---|---|---|---|
| A | 3787 | 504 | 13.308688% |
| B | 3787 | 42 | 1.109057% |
| C | 3787 | 12 | 0.316874% |
| D | 3787 | 228 | 6.020597% |
Noise dominated data is calculated using 1-second bins in cleaned event files. If a bin has >2000 counts, and if more than 50% of those come from <1% of pixels, then it is considered to be noise-dominated and hence unusable.
| Quadrant | # 1 sec bins | Bins with >0 counts | Bins with >2000 counts | High rate bins dominated by noise | Noise dominated (total time) | Noise dominated (detector-on time) | Marked lightcurve |
|---|---|---|---|---|---|---|---|
| A | 5341 | 3788 | 464 | 464 | 8.69% | 12.25% | 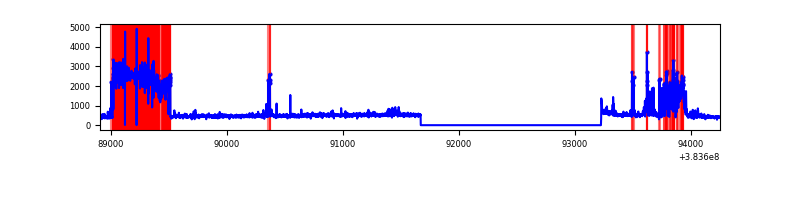 |
| B | 5341 | 3788 | 18 | 18 | 0.34% | 0.48% | 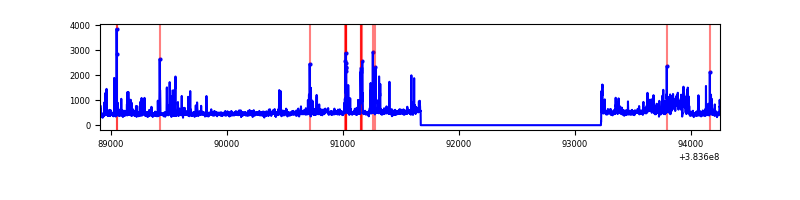 |
| C | 5341 | 3788 | 9 | 9 | 0.17% | 0.24% | 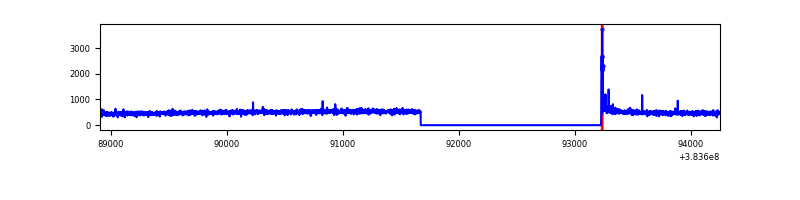 |
| D | 5341 | 3787 | 175 | 175 | 3.28% | 4.62% | 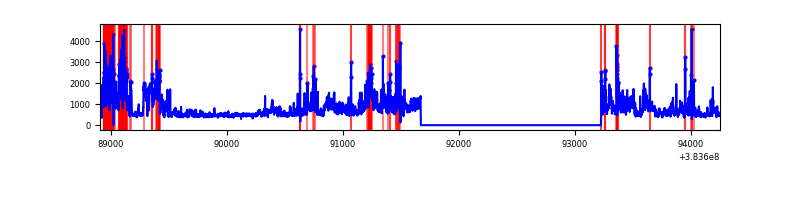 |
Top three noisy pixels from each quadrant. If the there are fewer than three noisy pixels in the level2.evt file, extra rows are filled as -1
| Pixel properties | Quadrant properties | ||||||
|---|---|---|---|---|---|---|---|
| Quadrant | DetID | PixID | Counts | Sigma | Mean | Median | Sigma |
| A | 15 | 174 | 1078994 | 12950.64 | 411 | 402 | 83.3 |
| A | 15 | 169 | 355978 | 4269.4 | 411 | 402 | 83.3 |
| A | 9 | 143 | 36661 | 435.36 | 411 | 402 | 83.3 |
| B | 4 | 232 | 120620 | 1413.75 | 440 | 427 | 85.0 |
| B | 5 | 172 | 89958 | 1053.09 | 440 | 427 | 85.0 |
| B | 5 | 255 | 68759 | 803.74 | 440 | 427 | 85.0 |
| C | 15 | 214 | 159565 | 1577.97 | 433 | 436 | 100.8 |
| C | 0 | 10 | 34613 | 338.91 | 433 | 436 | 100.8 |
| C | 14 | 67 | 11169 | 106.43 | 433 | 436 | 100.8 |
| D | 8 | 195 | 655928 | 5725.04 | 419 | 411 | 114.5 |
| D | 13 | 249 | 339670 | 2962.96 | 419 | 411 | 114.5 |
| D | 2 | 250 | 242508 | 2114.38 | 419 | 411 | 114.5 |
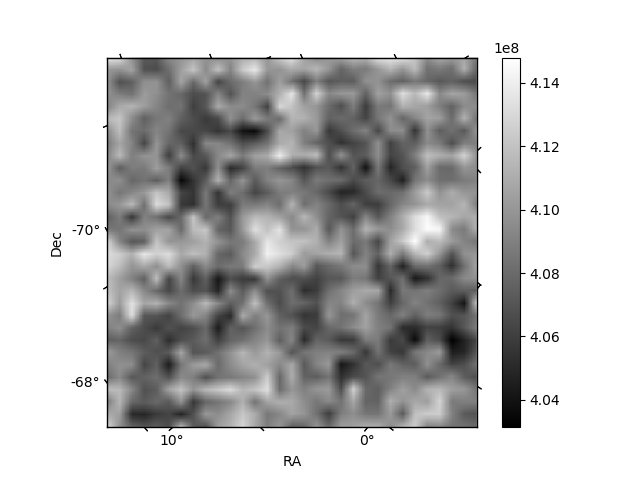
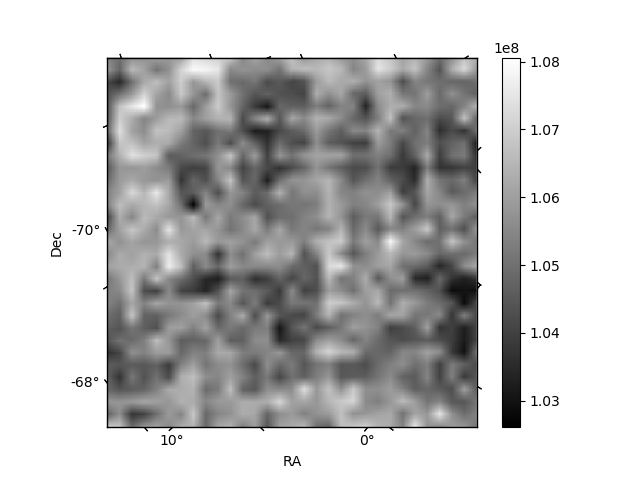
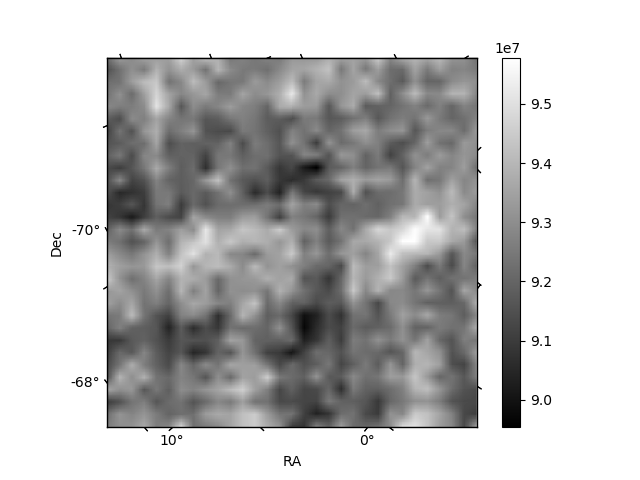
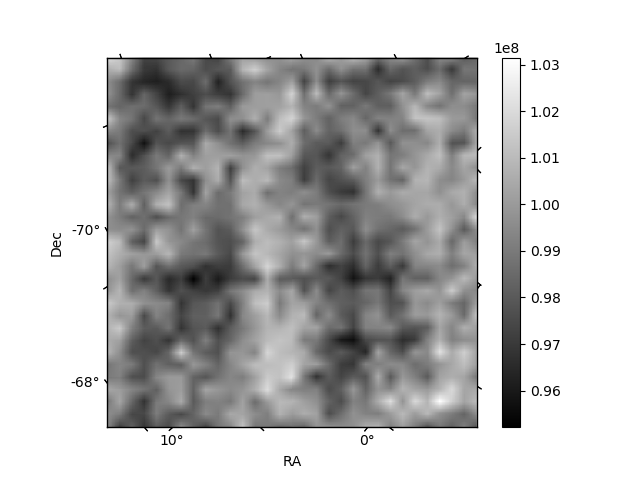
Histogram calculated using DETX and DETY for each event in the final _common_clean file
| Quadrant A | 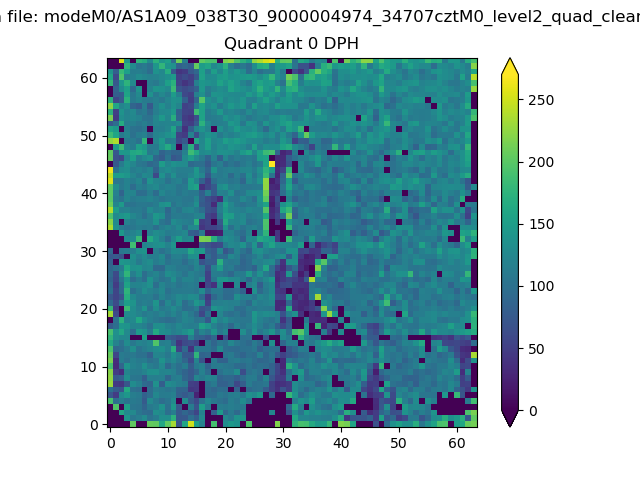 |
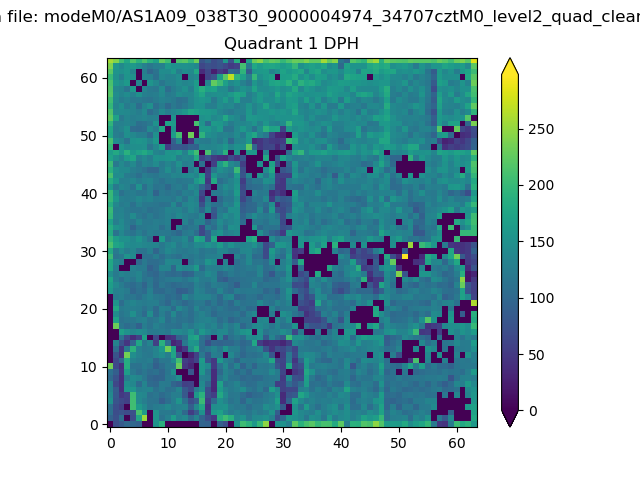 |
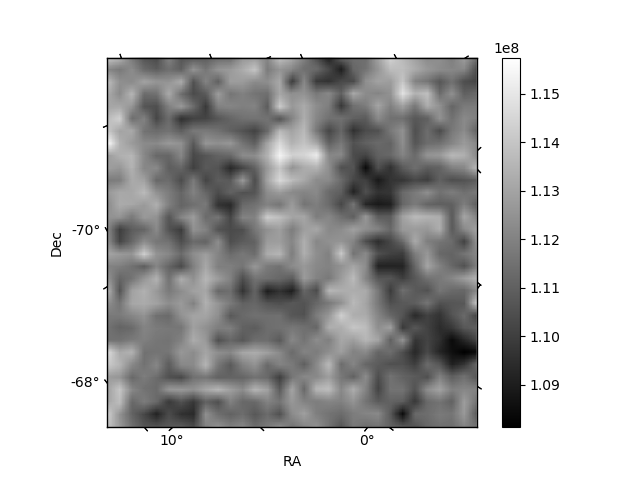
Quadrant B |
|---|---|---|---|
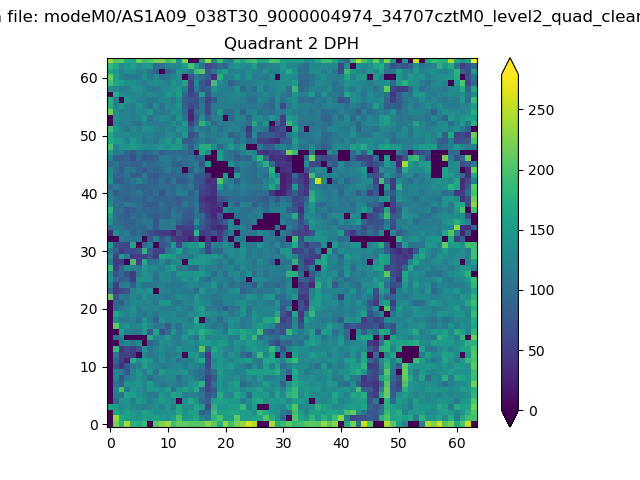
| Quadrant D | 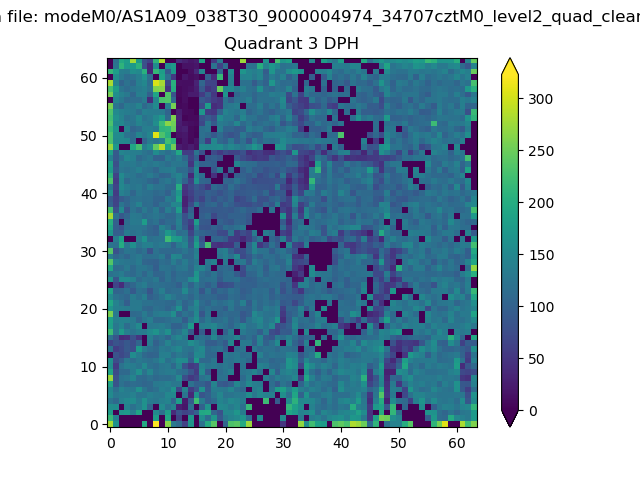 |
 |
Quadrant C |
| Plot type | Count rate plots | Images |
|---|---|---|
| Comparison with Poisson distribution Blue bars denote a histogram of data divided into 1 sec bins. Red curve is a Poisson curve with rate = median count rate of data. |
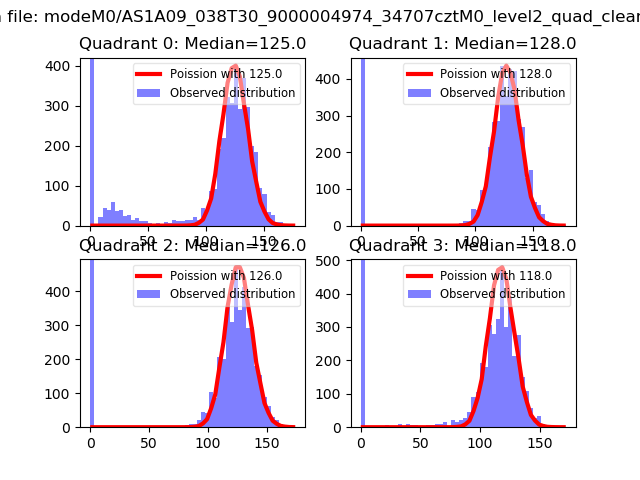 |
 |
| Quadrant-wise count rates Data is divided into 100 sec bins |
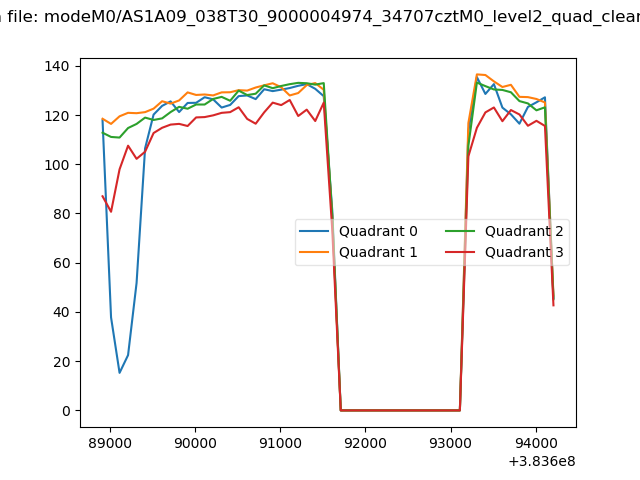 |
|
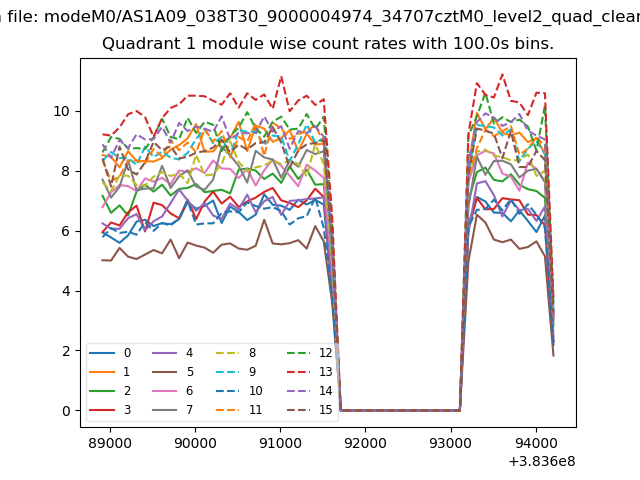
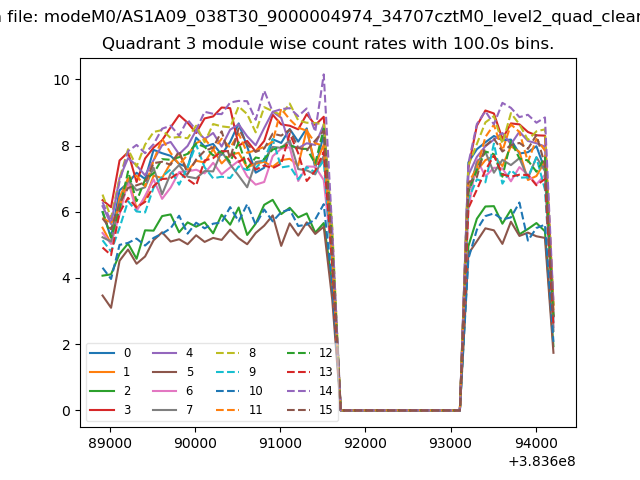
| Module-wise count rates for Quadrant A Data is divided into 100 sec bins |
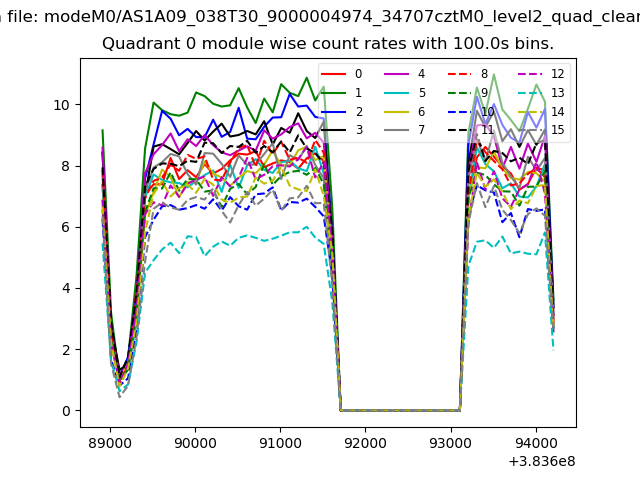 |
 |
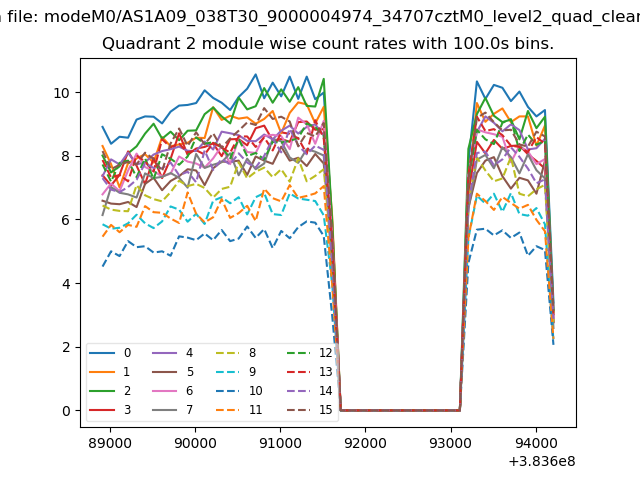
| Module-wise count rates for Quadrant B Data is divided into 100 sec bins |
 |
 |
| Module-wise count rates for Quadrant C Data is divided into 100 sec bins |
 |
 |
| Module-wise count rates for Quadrant D Data is divided into 100 sec bins |
 |
 |
| Parameter | Plot |
|---|---|
| CZT HV Monitor | 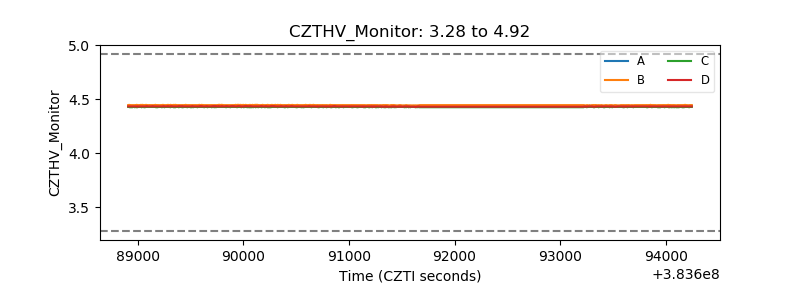 |
| D_VDD | 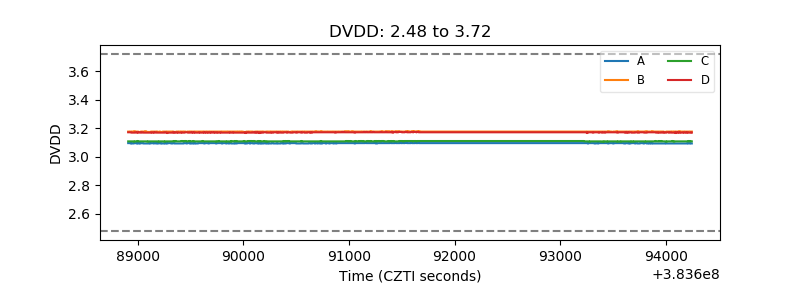 |
| Temperature 1 | 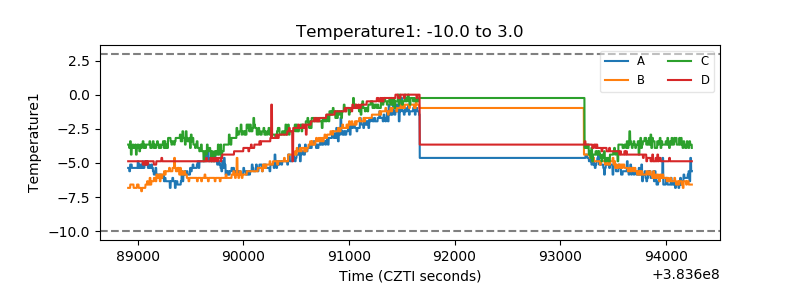 |
| Veto HV Monitor | 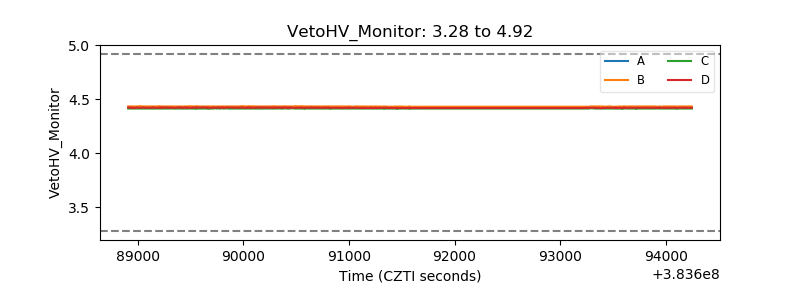 |
| Veto LLD | 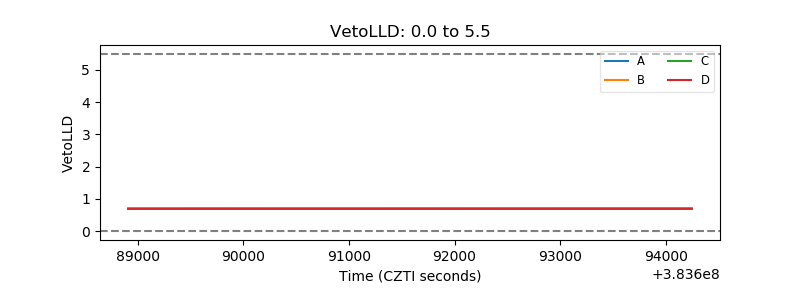 |
| Alpha Counter | 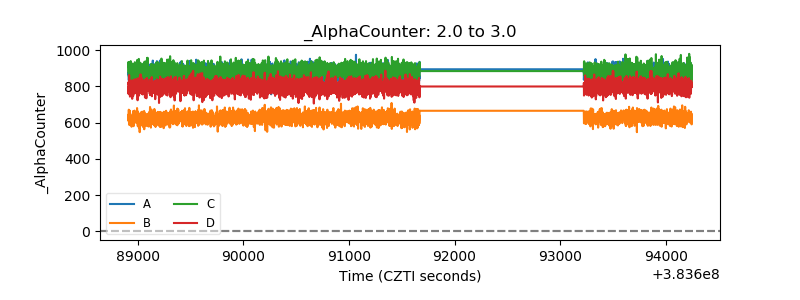 |
| _CPM_Rate | 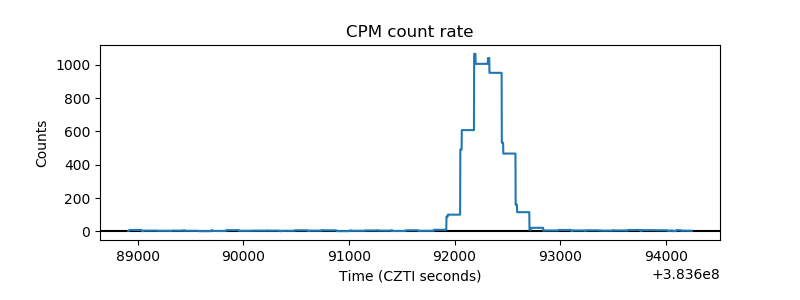 |
| CZT Counter | 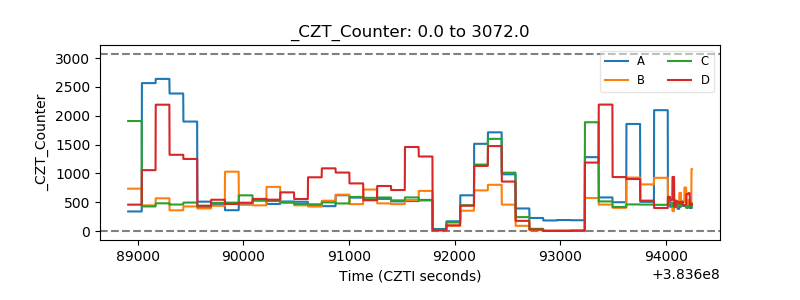 |
| +2.5 Volts monitor | 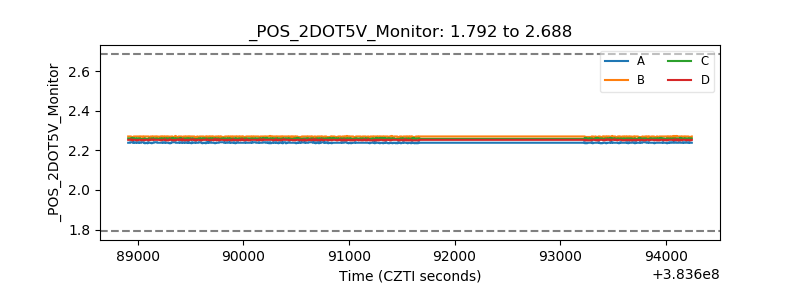 |
| +5 Volts monitor | 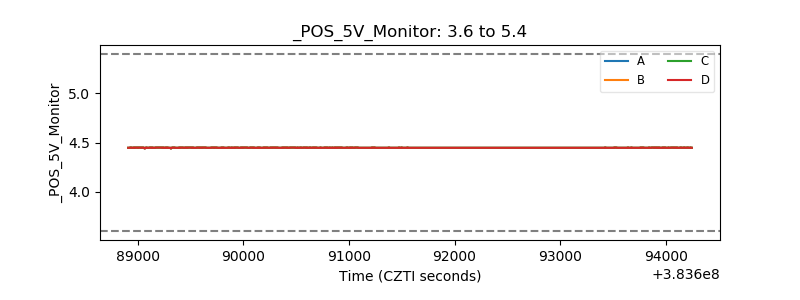 |
| _ROLL_ROT | 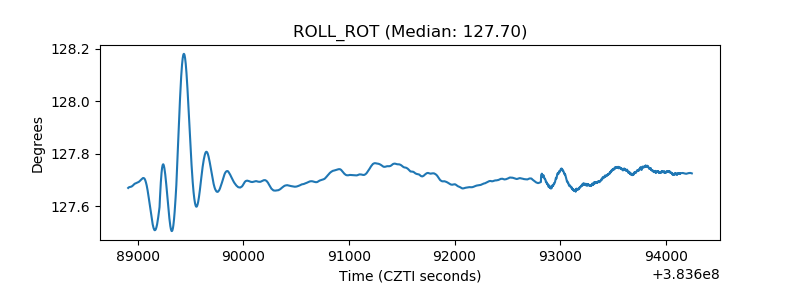 |
| _Roll_DEC | 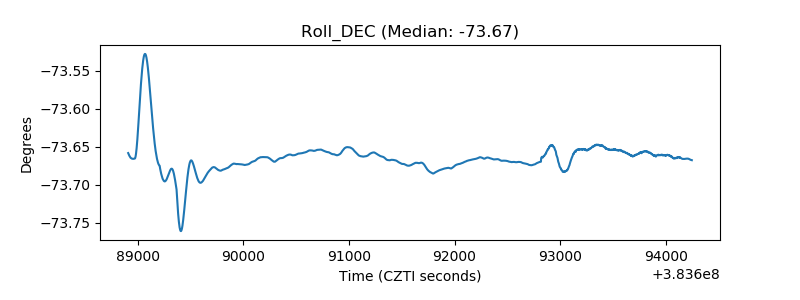 |
| _Roll_RA | 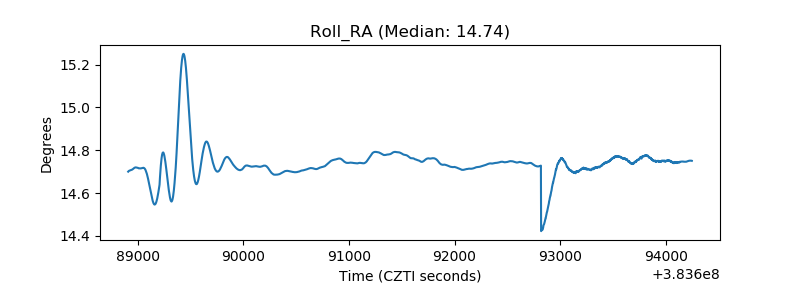 |
| Veto Counter | 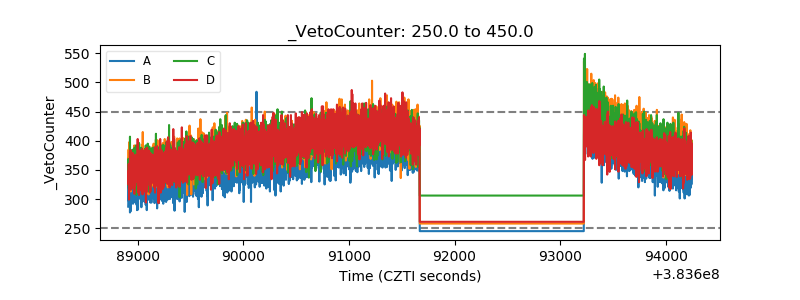 |