| Param | Original file | Final file |
|---|---|---|
| Filename | modeM0/AS1A07_138T08_9000004970_34700cztM0_level2.evt | modeM0/AS1A07_138T08_9000004970_34700cztM0_level2_quad_clean.evt |
| Size (bytes) | 450,270,720 | 61,983,360 |
| Size | 429.4 MB | 59.1 MB |
| Events in quadrant A | 2,454,812 | 389,396 |
| Events in quadrant B | 2,953,986 | 391,372 |
| Events in quadrant C | 2,627,176 | 387,322 |
| Events in quadrant D | 5,260,277 | 356,856 |
| Mode M0 | |||
|---|---|---|---|
| Quadrant | BADHDUFLAG | Total packets | Discarded packets |
| A | 0 | 10391 | 3 |
| B | 0 | 11890 | 2 |
| C | 0 | 10548 | 2 |
| D | 0 | 19109 | 2 |
| Mode M9 | |||
|---|---|---|---|
| Quadrant | BADHDUFLAG | Total packets | Discarded packets |
| A | 0 | 20 | 0 |
| B | 0 | 20 | 0 |
| C | 0 | 20 | 0 |
| D | 0 | 21 | 0 |
| Mode SS | |||
|---|---|---|---|
| Quadrant | BADHDUFLAG | Total packets | Discarded packets |
| A | 0 | 102 | 0 |
| B | 0 | 102 | 0 |
| C | 0 | 102 | 0 |
| D | 0 | 102 | 0 |
| Quadrant | Total seconds | Saturated seconds | Saturation percentage |
|---|---|---|---|
| A | 5018 | 21 | 0.418493% |
| B | 5018 | 101 | 2.012754% |
| C | 5018 | 26 | 0.518135% |
| D | 5018 | 247 | 4.922280% |
Noise dominated data is calculated using 1-second bins in cleaned event files. If a bin has >2000 counts, and if more than 50% of those come from <1% of pixels, then it is considered to be noise-dominated and hence unusable.
| Quadrant | # 1 sec bins | Bins with >0 counts | Bins with >2000 counts | High rate bins dominated by noise | Noise dominated (total time) | Noise dominated (detector-on time) | Marked lightcurve |
|---|---|---|---|---|---|---|---|
| A | 6932 | 5019 | 9 | 9 | 0.13% | 0.18% | 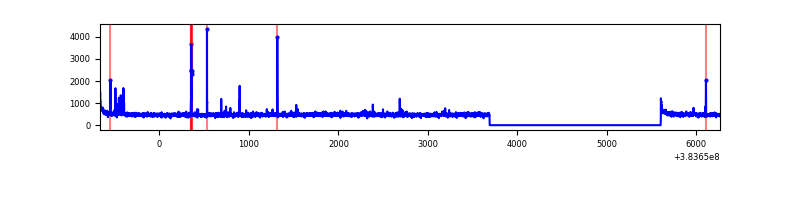 |
| B | 6932 | 5019 | 67 | 67 | 0.97% | 1.33% | 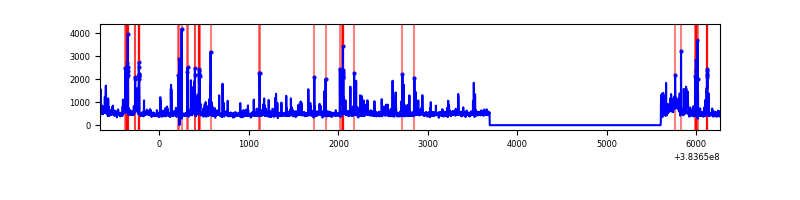 |
| C | 6932 | 5019 | 18 | 18 | 0.26% | 0.36% | 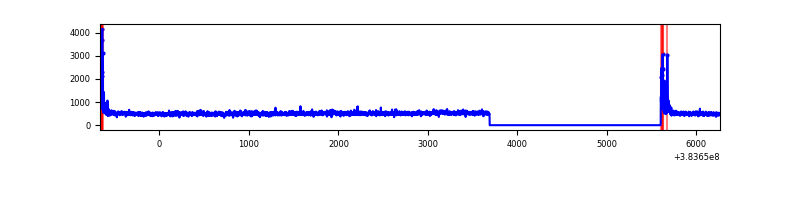 |
| D | 6932 | 5019 | 181 | 181 | 2.61% | 3.61% | 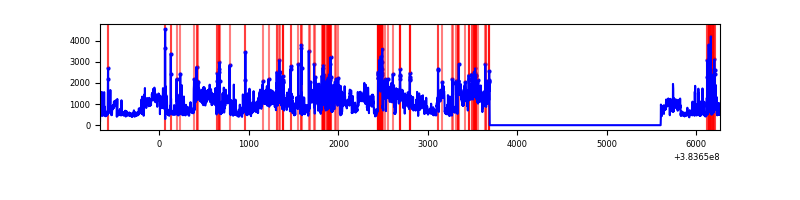 |
Top three noisy pixels from each quadrant. If the there are fewer than three noisy pixels in the level2.evt file, extra rows are filled as -1
| Pixel properties | Quadrant properties | ||||||
|---|---|---|---|---|---|---|---|
| Quadrant | DetID | PixID | Counts | Sigma | Mean | Median | Sigma |
| A | 9 | 143 | 59838 | 499.4 | 592 | 581 | 118.7 |
| A | 10 | 83 | 47197 | 392.87 | 592 | 581 | 118.7 |
| A | 7 | 48 | 22933 | 188.38 | 592 | 581 | 118.7 |
| B | 5 | 172 | 283414 | 2566.19 | 584 | 570 | 110.2 |
| B | 5 | 255 | 115439 | 1042.19 | 584 | 570 | 110.2 |
| B | 4 | 171 | 93619 | 844.22 | 584 | 570 | 110.2 |
| C | 15 | 214 | 219429 | 1659.21 | 571 | 574 | 131.9 |
| C | 0 | 10 | 116994 | 882.62 | 571 | 574 | 131.9 |
| C | 14 | 67 | 46860 | 350.91 | 571 | 574 | 131.9 |
| D | 8 | 195 | 2201102 | 15660.78 | 566 | 550 | 140.5 |
| D | 2 | 250 | 173611 | 1231.63 | 566 | 550 | 140.5 |
| D | 2 | 207 | 165273 | 1172.29 | 566 | 550 | 140.5 |
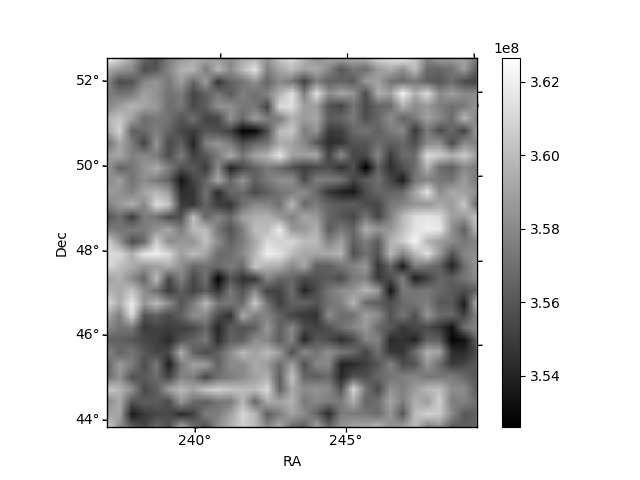
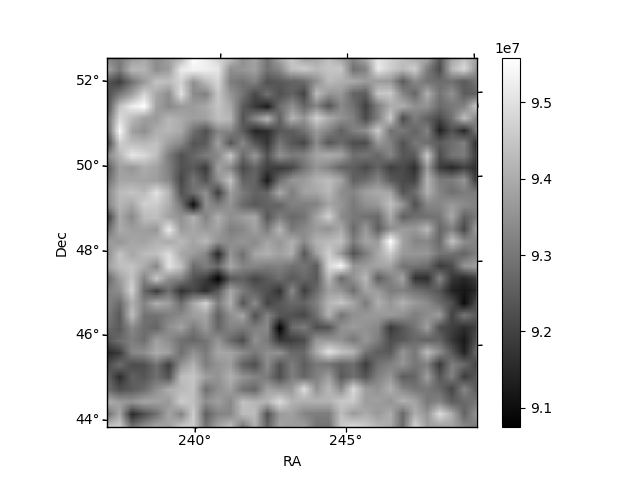
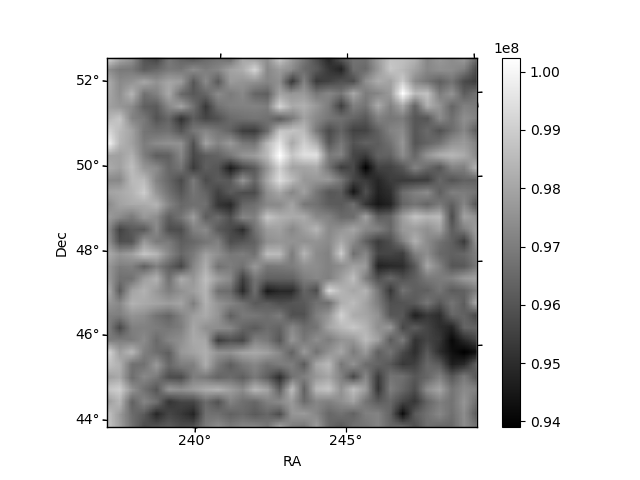
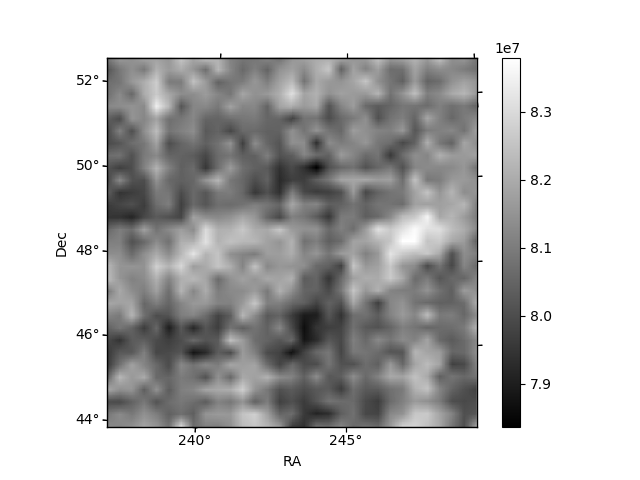
Histogram calculated using DETX and DETY for each event in the final _common_clean file
| Quadrant A | 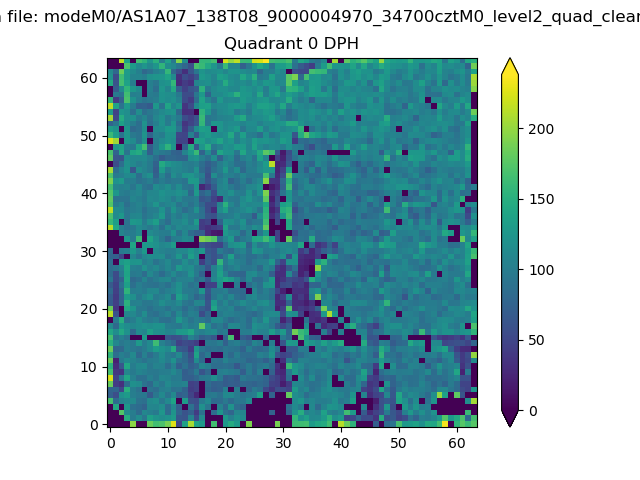 |
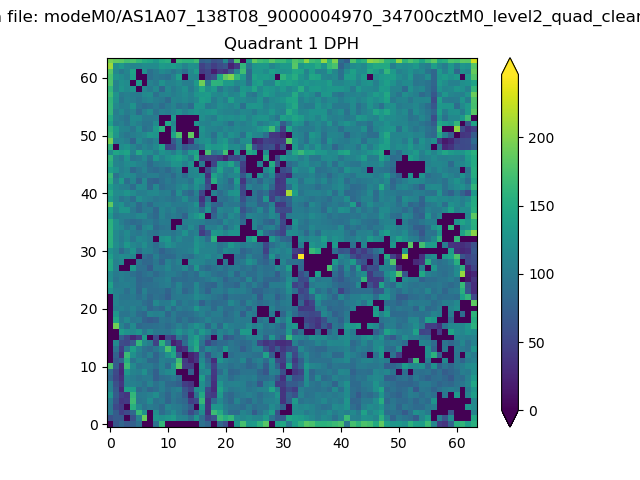 |
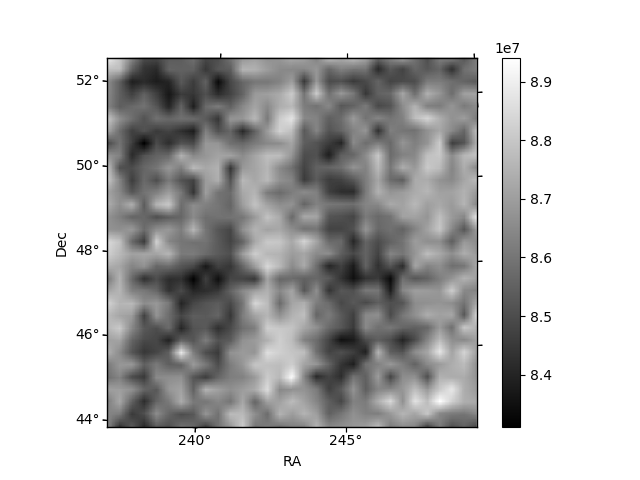
Quadrant B |
|---|---|---|---|
| Quadrant D | 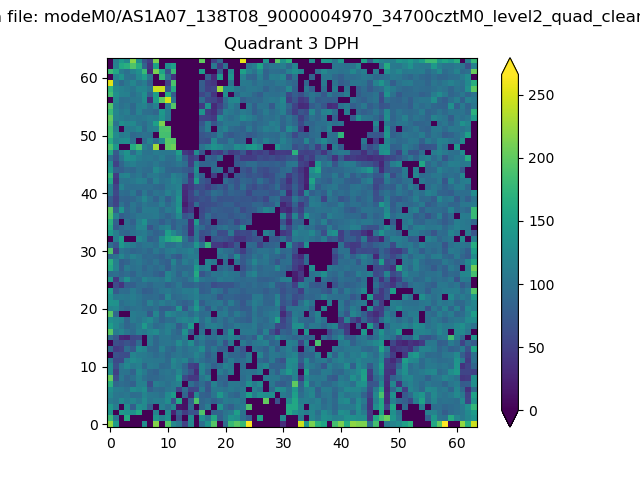 |
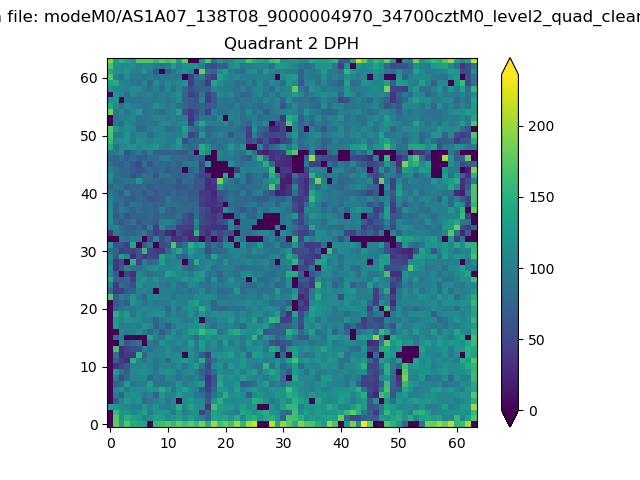 |
Quadrant C |
| Plot type | Count rate plots | Images |
|---|---|---|
| Comparison with Poisson distribution Blue bars denote a histogram of data divided into 1 sec bins. Red curve is a Poisson curve with rate = median count rate of data. |
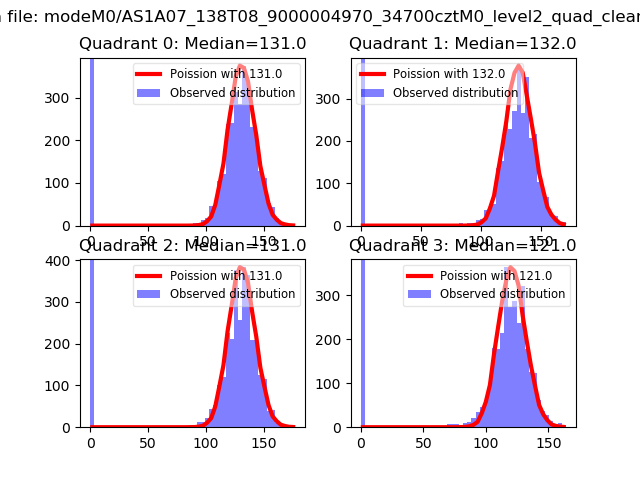 |
 |
| Quadrant-wise count rates Data is divided into 100 sec bins |
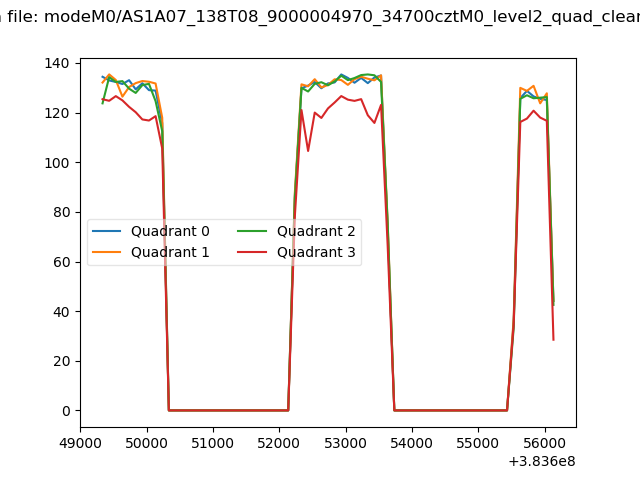 |
|
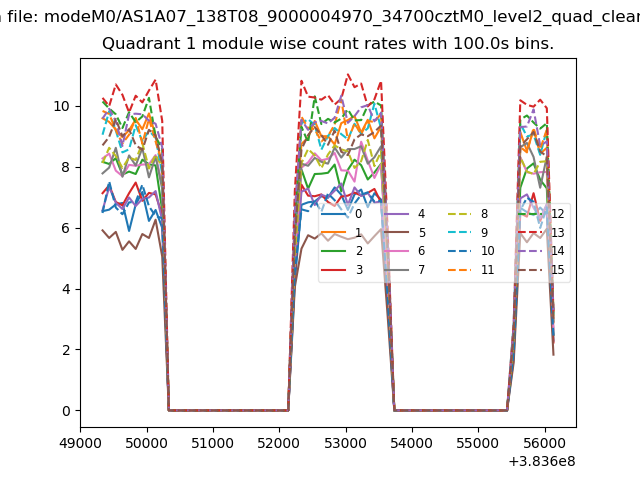
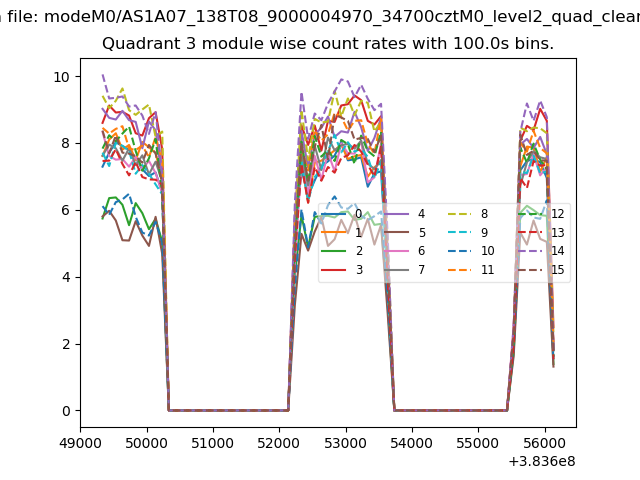
| Module-wise count rates for Quadrant A Data is divided into 100 sec bins |
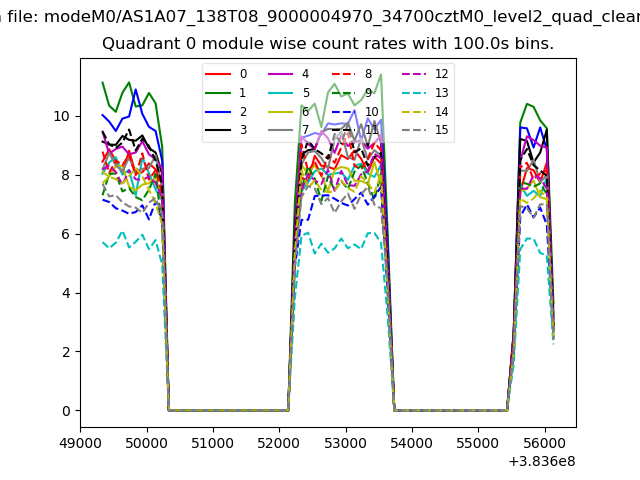 |
 |
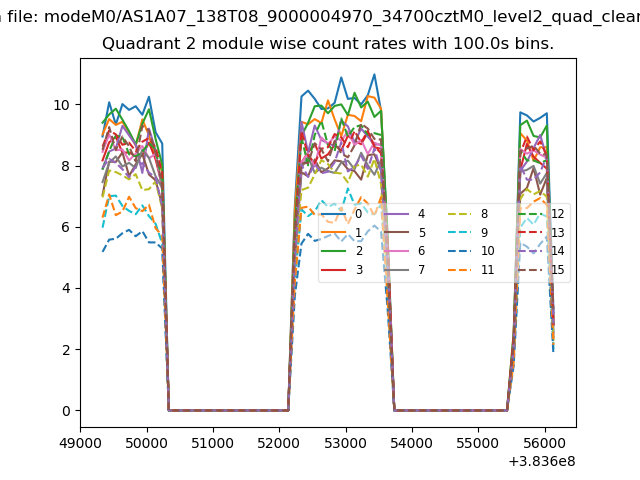
| Module-wise count rates for Quadrant B Data is divided into 100 sec bins |
 |
 |
| Module-wise count rates for Quadrant C Data is divided into 100 sec bins |
 |
 |
| Module-wise count rates for Quadrant D Data is divided into 100 sec bins |
 |
 |
| Parameter | Plot |
|---|---|
| CZT HV Monitor | 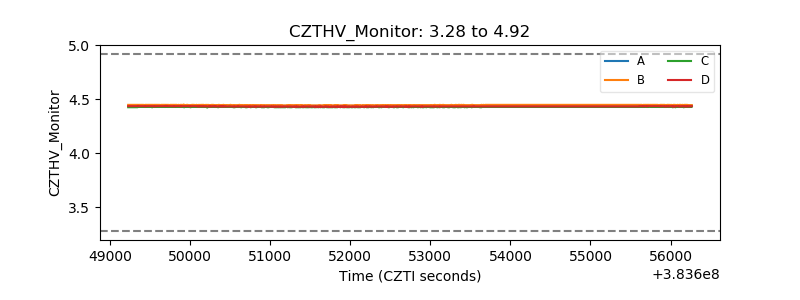 |
| D_VDD | 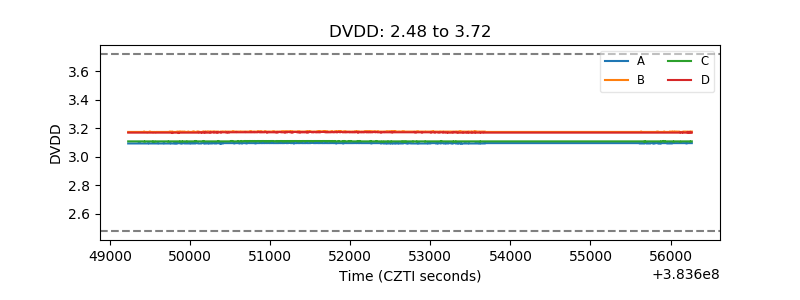 |
| Temperature 1 | 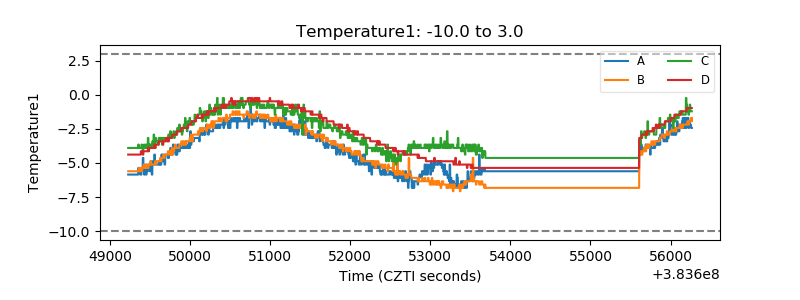 |
| Veto HV Monitor | 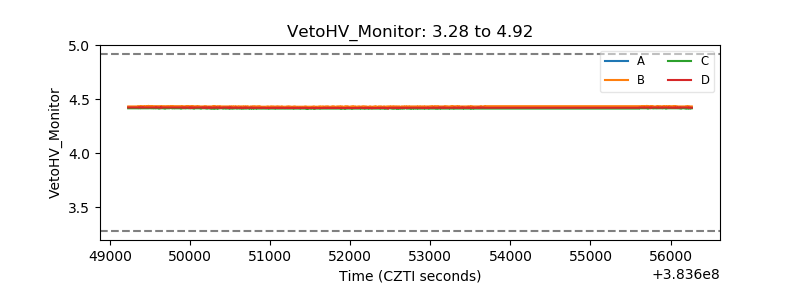 |
| Veto LLD | 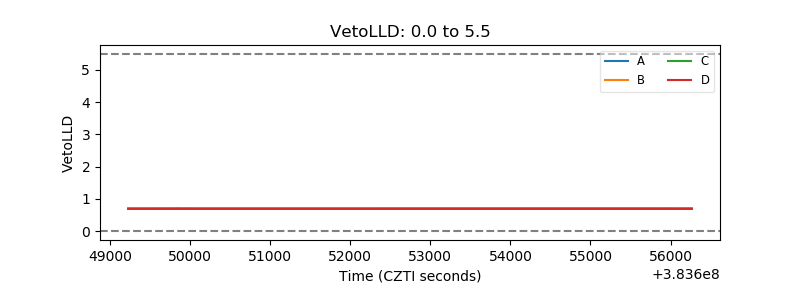 |
| Alpha Counter | 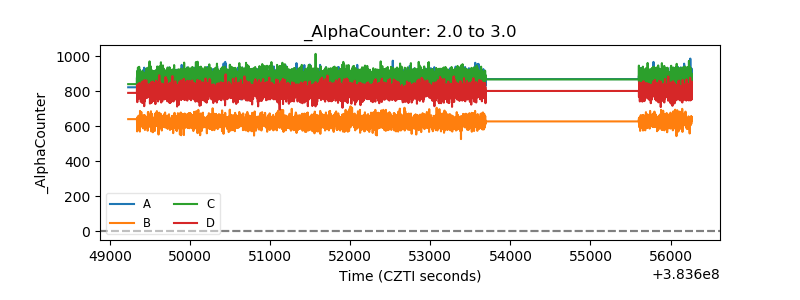 |
| _CPM_Rate | 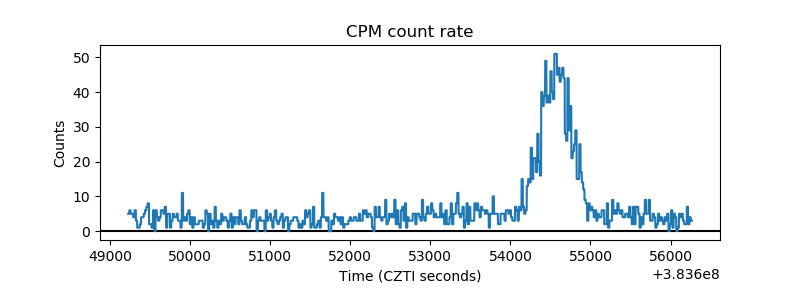 |
| CZT Counter | 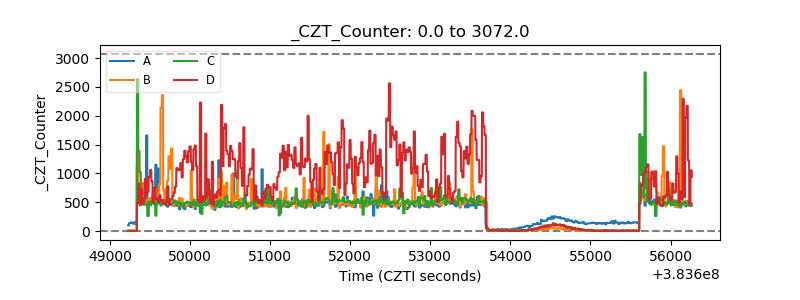 |
| +2.5 Volts monitor | 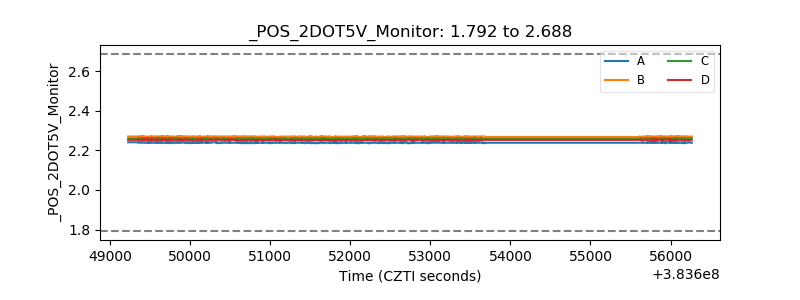 |
| +5 Volts monitor | 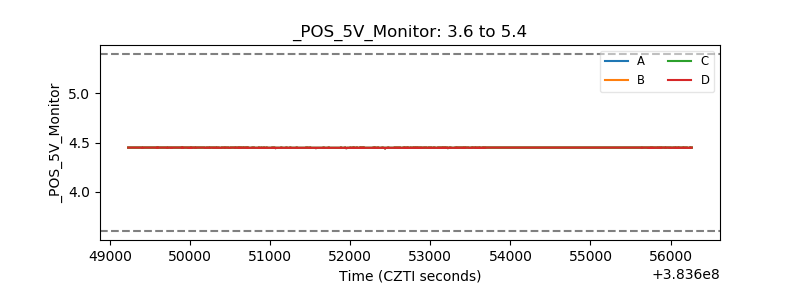 |
| _ROLL_ROT |  |
| _Roll_DEC | 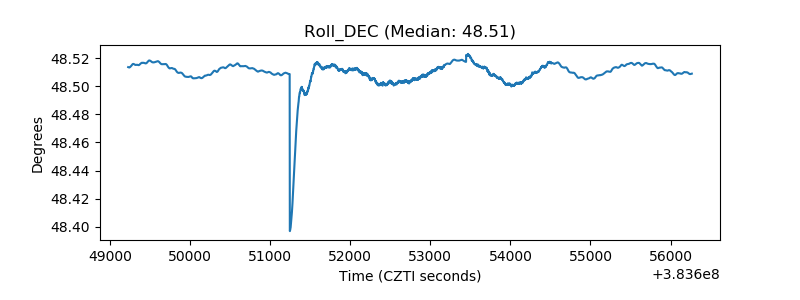 |
| _Roll_RA | 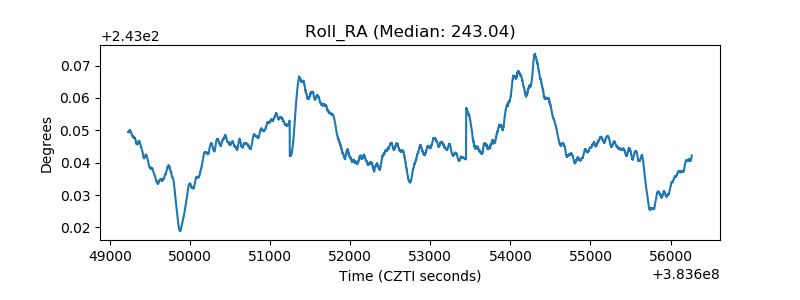 |
| Veto Counter | 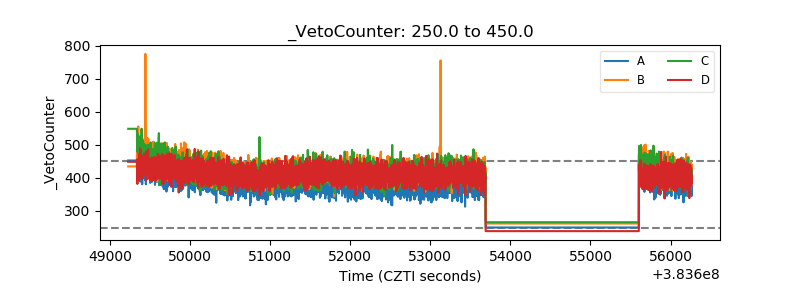 |