| Param | Original file | Final file |
|---|---|---|
| Filename | modeM0/AS1A07_138T08_9000004970_34699cztM0_level2.evt | modeM0/AS1A07_138T08_9000004970_34699cztM0_level2_quad_clean.evt |
| Size (bytes) | 432,046,080 | 65,554,560 |
| Size | 412.0 MB | 62.5 MB |
| Events in quadrant A | 2,618,769 | 420,515 |
| Events in quadrant B | 3,398,887 | 410,565 |
| Events in quadrant C | 2,678,033 | 413,988 |
| Events in quadrant D | 4,049,154 | 388,642 |
| Mode M0 | |||
|---|---|---|---|
| Quadrant | BADHDUFLAG | Total packets | Discarded packets |
| A | 0 | 10729 | 3 |
| B | 0 | 13174 | 2 |
| C | 0 | 10696 | 2 |
| D | 0 | 15545 | 2 |
| Mode M9 | |||
|---|---|---|---|
| Quadrant | BADHDUFLAG | Total packets | Discarded packets |
| A | 0 | 26 | 0 |
| B | 0 | 26 | 0 |
| C | 0 | 26 | 0 |
| D | 0 | 27 | 0 |
| Mode SS | |||
|---|---|---|---|
| Quadrant | BADHDUFLAG | Total packets | Discarded packets |
| A | 0 | 102 | 0 |
| B | 0 | 102 | 0 |
| C | 0 | 102 | 0 |
| D | 0 | 102 | 0 |
| Quadrant | Total seconds | Saturated seconds | Saturation percentage |
|---|---|---|---|
| A | 5007 | 21 | 0.419413% |
| B | 5007 | 306 | 6.111444% |
| C | 5007 | 40 | 0.798882% |
| D | 5007 | 105 | 2.097064% |
Noise dominated data is calculated using 1-second bins in cleaned event files. If a bin has >2000 counts, and if more than 50% of those come from <1% of pixels, then it is considered to be noise-dominated and hence unusable.
| Quadrant | # 1 sec bins | Bins with >0 counts | Bins with >2000 counts | High rate bins dominated by noise | Noise dominated (total time) | Noise dominated (detector-on time) | Marked lightcurve |
|---|---|---|---|---|---|---|---|
| A | 7100 | 5008 | 10 | 10 | 0.14% | 0.20% | 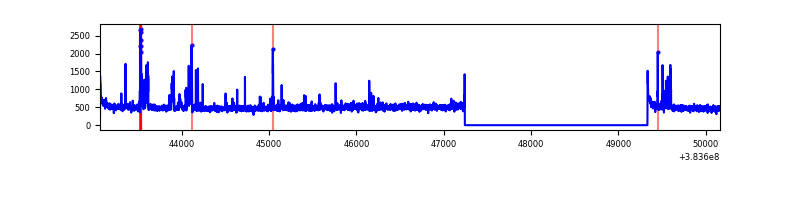 |
| B | 7100 | 5008 | 211 | 211 | 2.97% | 4.21% | 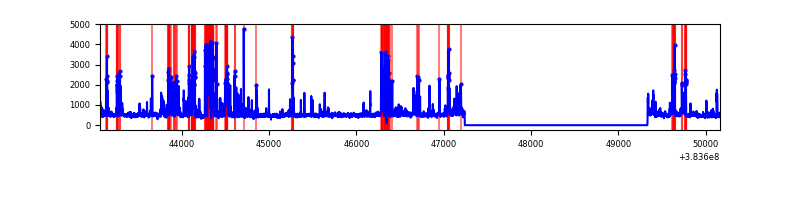 |
| C | 7100 | 5008 | 32 | 32 | 0.45% | 0.64% | 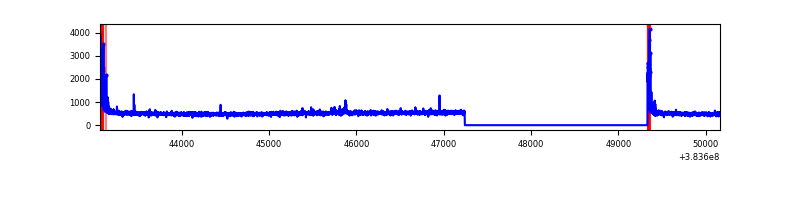 |
| D | 7100 | 5008 | 72 | 72 | 1.01% | 1.44% | 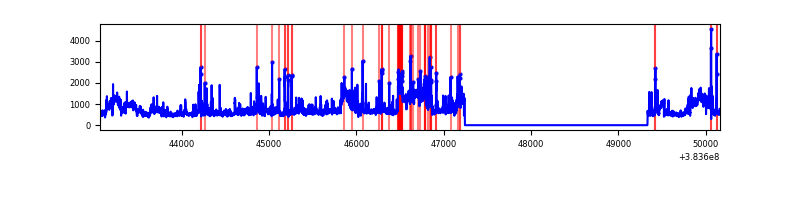 |
Top three noisy pixels from each quadrant. If the there are fewer than three noisy pixels in the level2.evt file, extra rows are filled as -1
| Pixel properties | Quadrant properties | ||||||
|---|---|---|---|---|---|---|---|
| Quadrant | DetID | PixID | Counts | Sigma | Mean | Median | Sigma |
| A | 15 | 174 | 132030 | 1078.59 | 610 | 598 | 121.9 |
| A | 9 | 143 | 47308 | 383.32 | 610 | 598 | 121.9 |
| A | 10 | 83 | 46870 | 379.73 | 610 | 598 | 121.9 |
| B | 5 | 255 | 623624 | 5690.62 | 584 | 569 | 109.5 |
| B | 5 | 172 | 329695 | 3006.04 | 584 | 569 | 109.5 |
| B | 4 | 232 | 68947 | 624.52 | 584 | 569 | 109.5 |
| C | 15 | 214 | 220801 | 1645.55 | 581 | 587 | 133.8 |
| C | 0 | 10 | 145951 | 1086.23 | 581 | 587 | 133.8 |
| C | 3 | 233 | 25001 | 182.43 | 581 | 587 | 133.8 |
| D | 8 | 195 | 1233157 | 8589.42 | 584 | 568 | 143.5 |
| D | 2 | 250 | 118835 | 824.16 | 584 | 568 | 143.5 |
| D | 13 | 249 | 101621 | 704.2 | 584 | 568 | 143.5 |
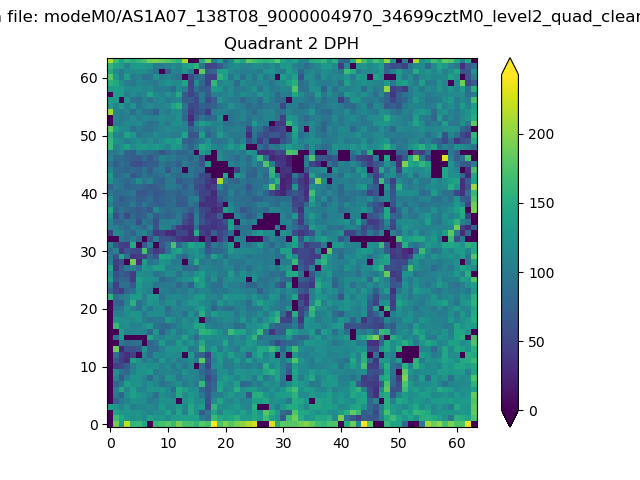
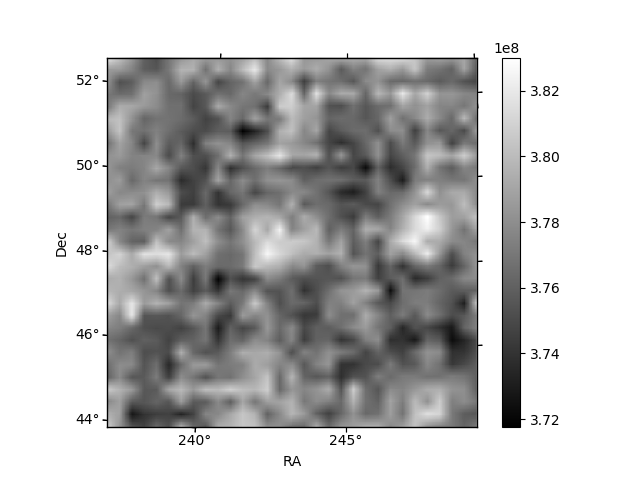
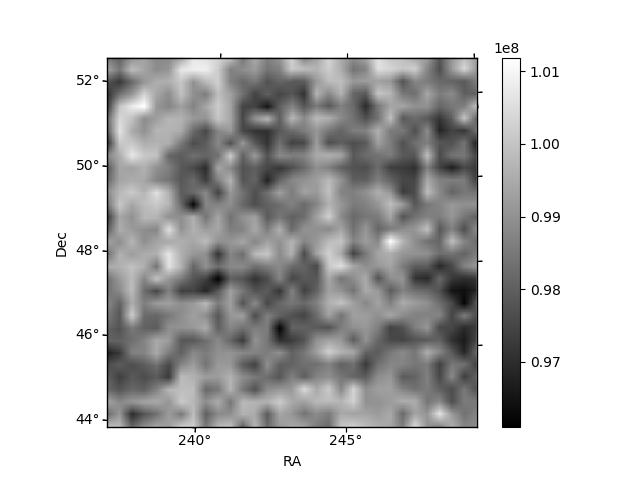
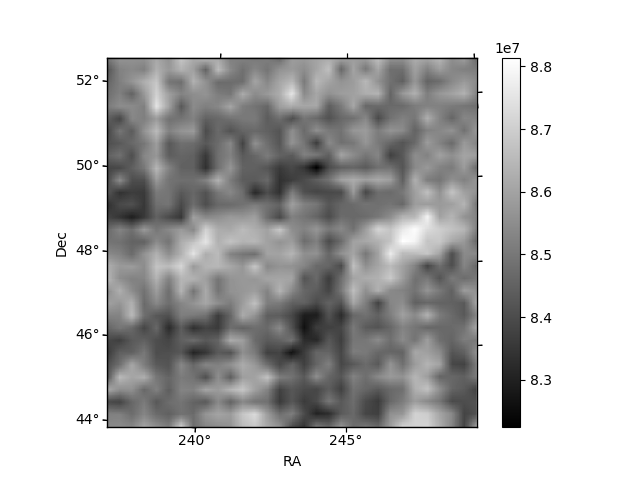
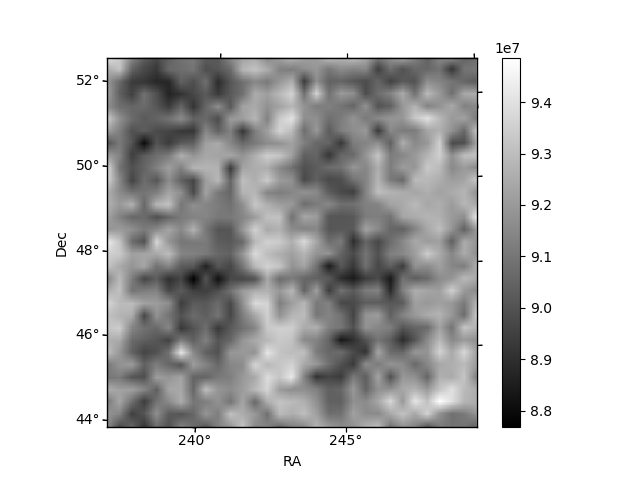
Histogram calculated using DETX and DETY for each event in the final _common_clean file
| Quadrant A | 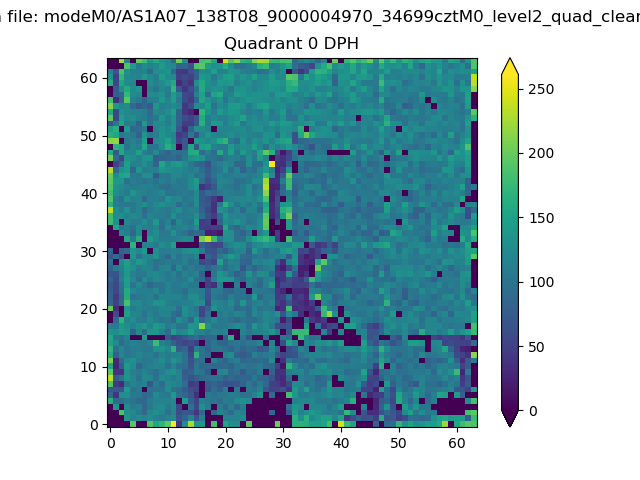 |
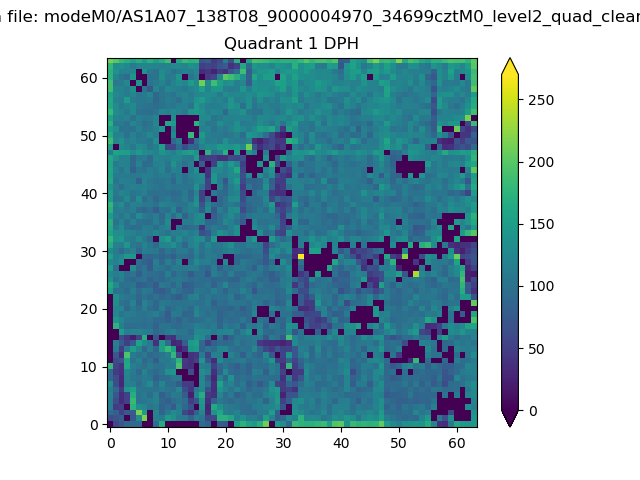 |
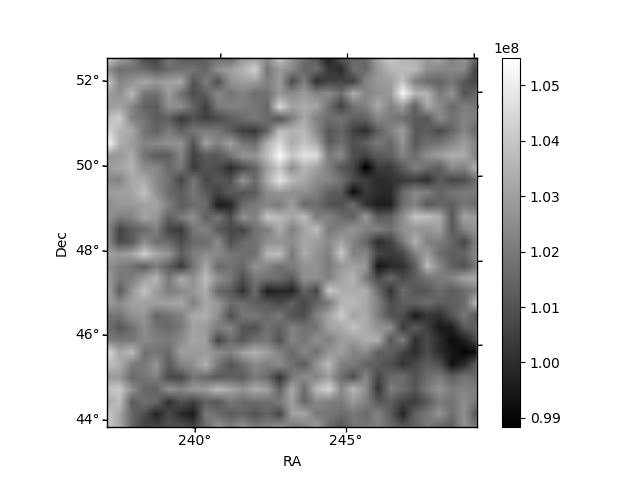
Quadrant B |
|---|---|---|---|
| Quadrant D | 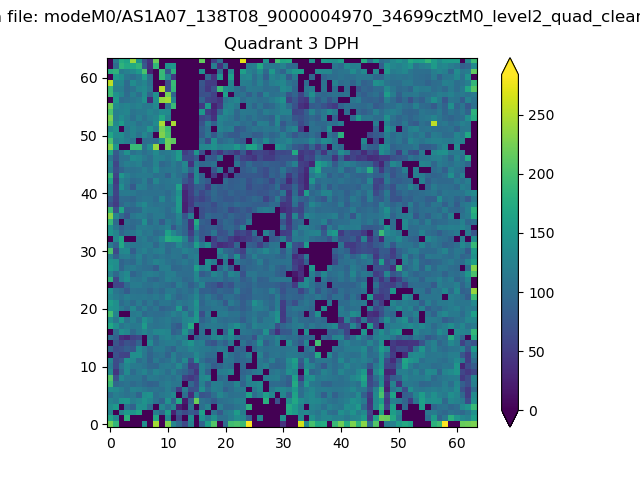 |
 |
Quadrant C |
| Plot type | Count rate plots | Images |
|---|---|---|
| Comparison with Poisson distribution Blue bars denote a histogram of data divided into 1 sec bins. Red curve is a Poisson curve with rate = median count rate of data. |
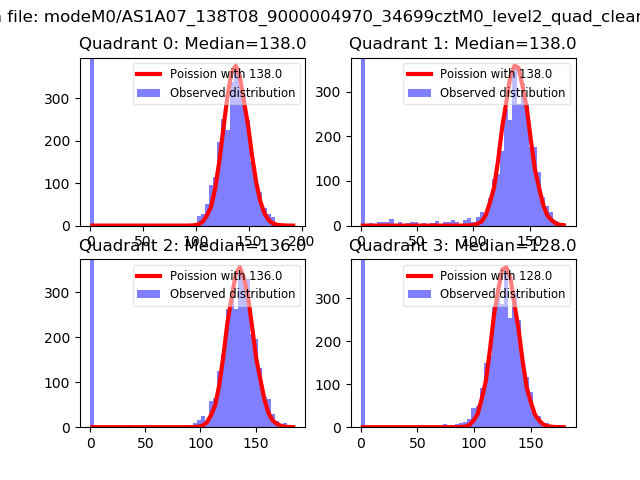 |
 |
| Quadrant-wise count rates Data is divided into 100 sec bins |
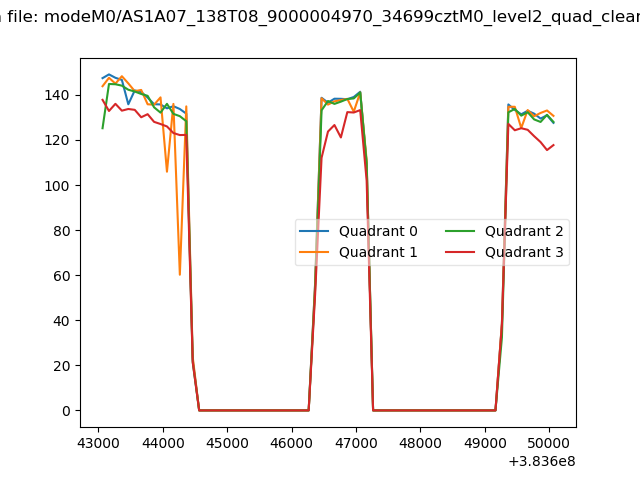 |
|
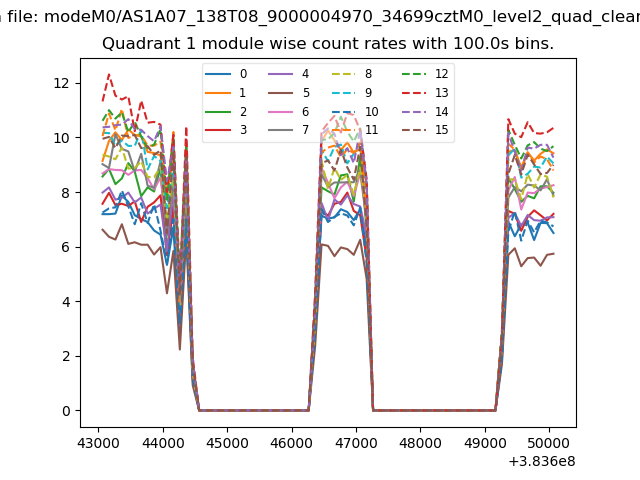
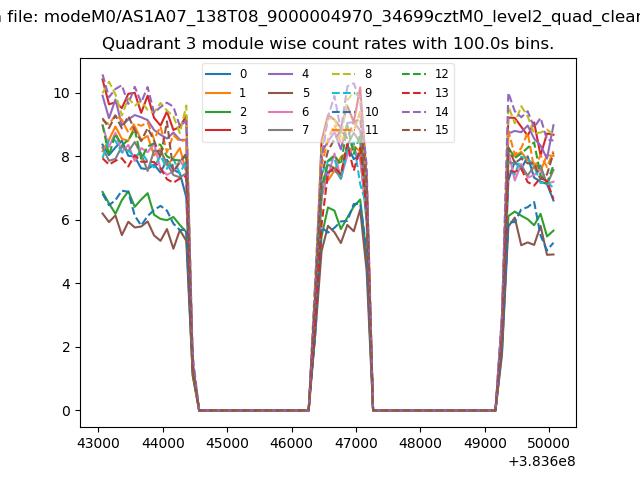
| Module-wise count rates for Quadrant A Data is divided into 100 sec bins |
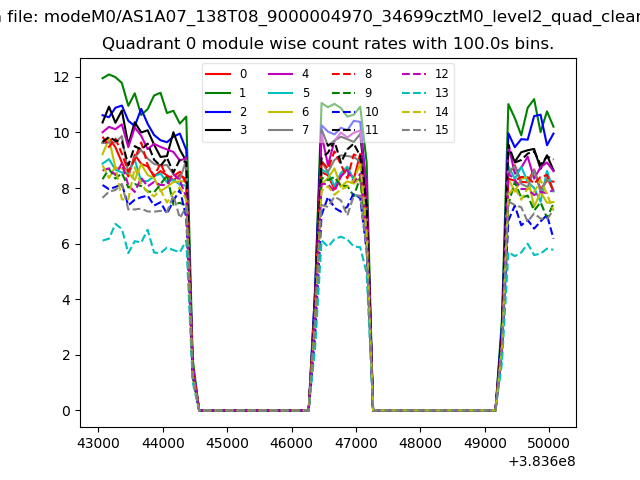 |
 |
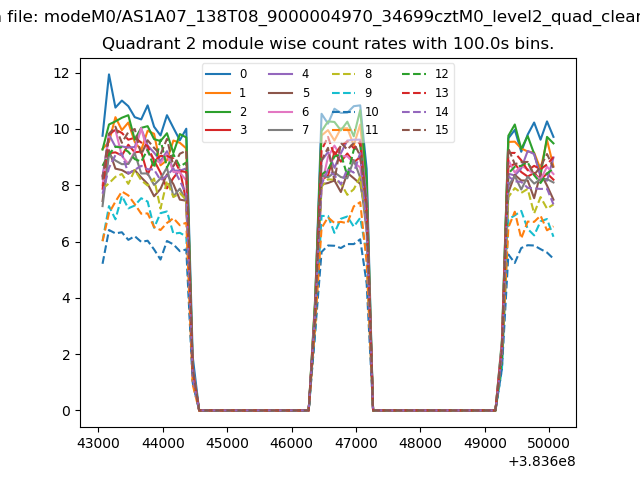
| Module-wise count rates for Quadrant B Data is divided into 100 sec bins |
 |
 |
| Module-wise count rates for Quadrant C Data is divided into 100 sec bins |
 |
 |
| Module-wise count rates for Quadrant D Data is divided into 100 sec bins |
 |
 |
| Parameter | Plot |
|---|---|
| CZT HV Monitor | 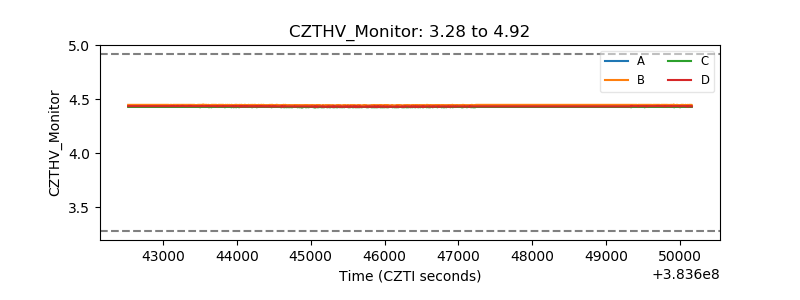 |
| D_VDD | 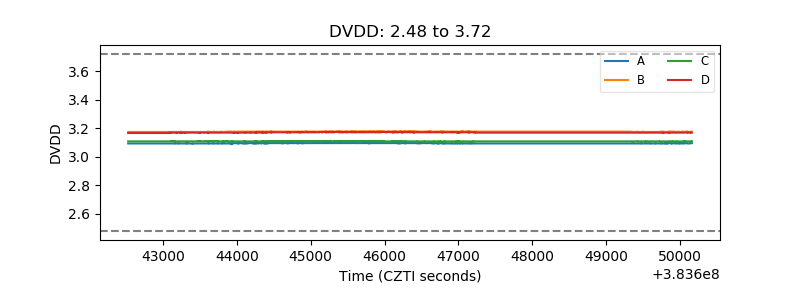 |
| Temperature 1 | 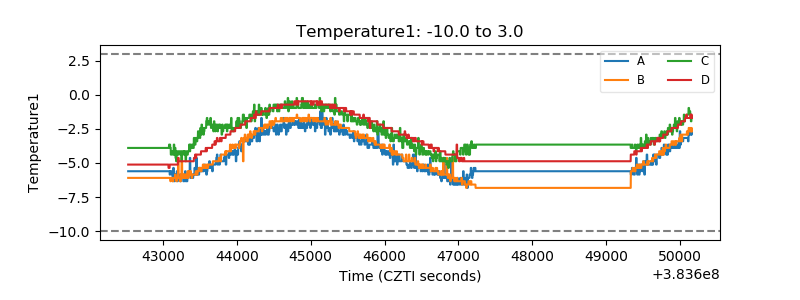 |
| Veto HV Monitor | 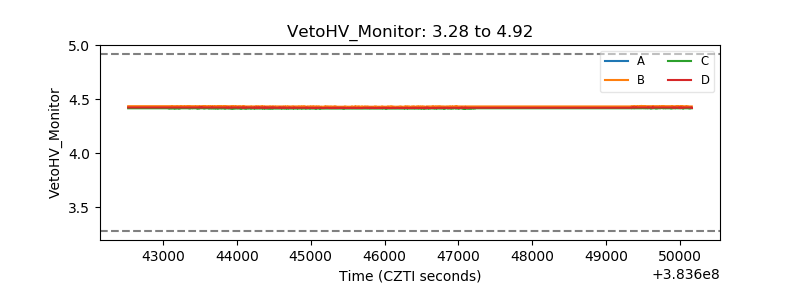 |
| Veto LLD | 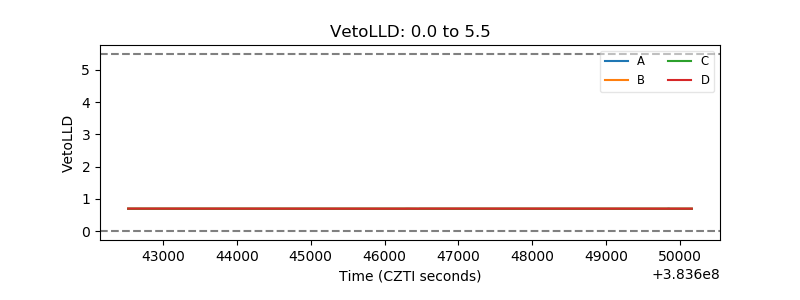 |
| Alpha Counter | 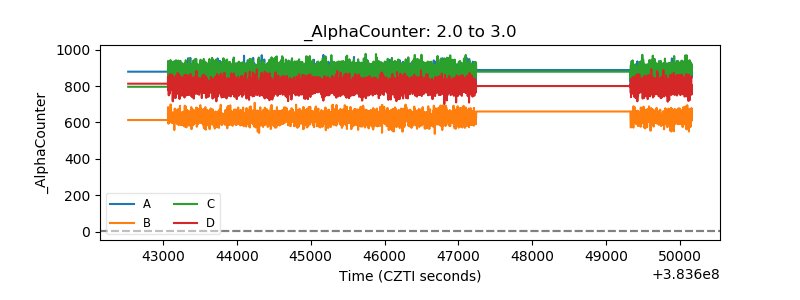 |
| _CPM_Rate | 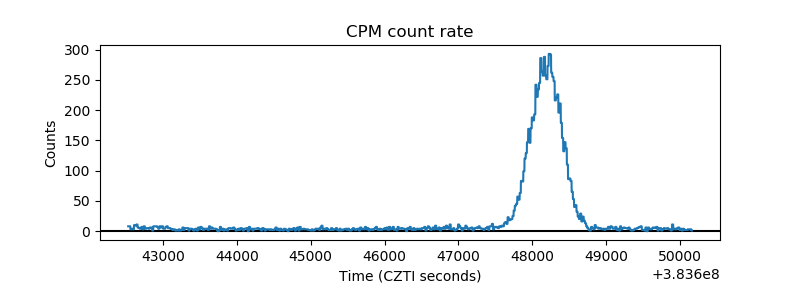 |
| CZT Counter | 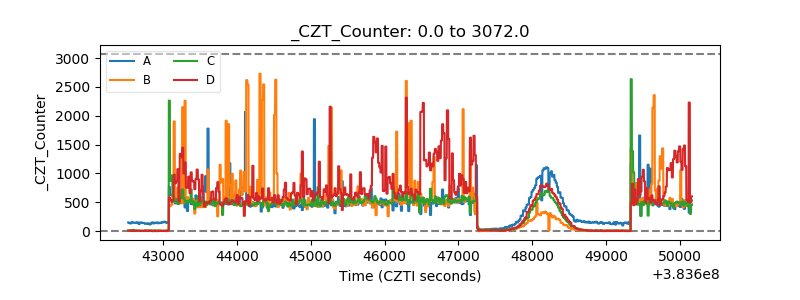 |
| +2.5 Volts monitor | 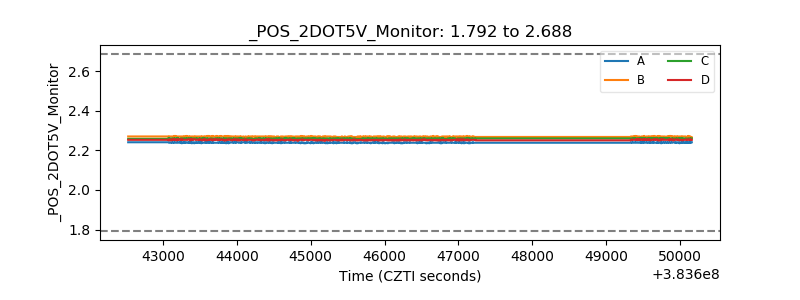 |
| +5 Volts monitor | 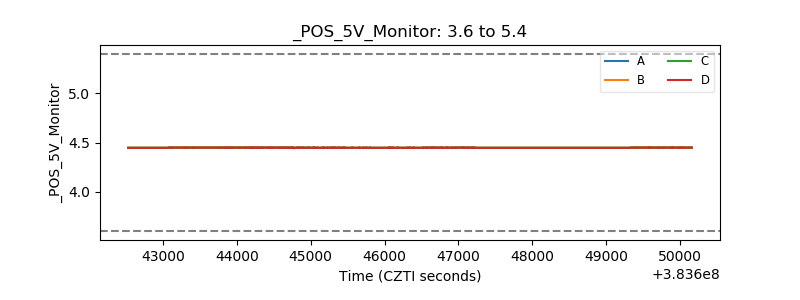 |
| _ROLL_ROT | 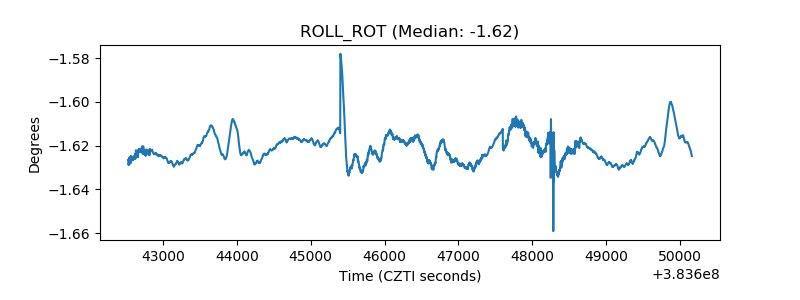 |
| _Roll_DEC | 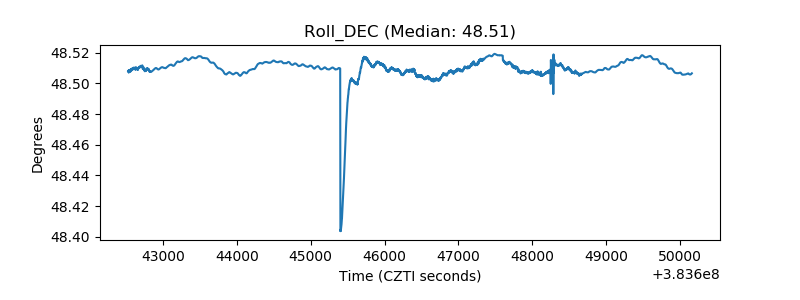 |
| _Roll_RA | 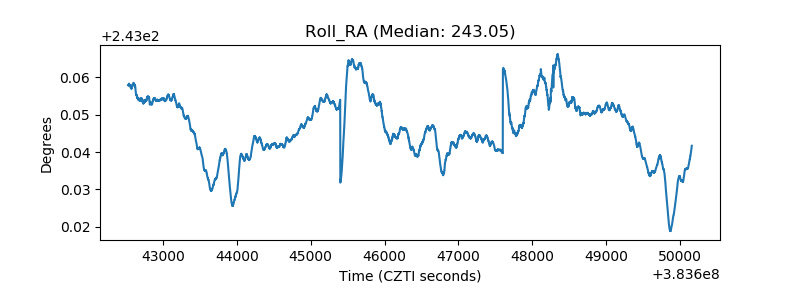 |
| Veto Counter | 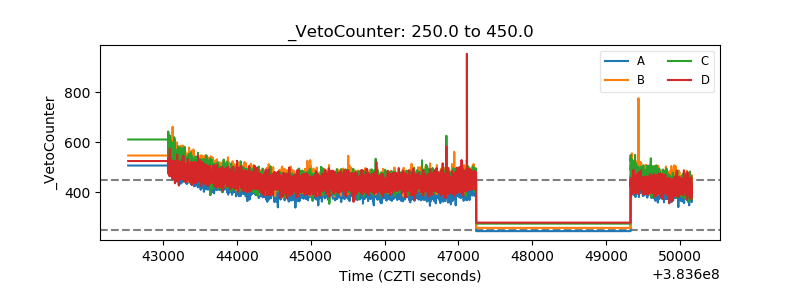 |