| Param | Original file | Final file |
|---|---|---|
| Filename | modeM0/AS1A07_138T08_9000004970_34698cztM0_level2.evt | modeM0/AS1A07_138T08_9000004970_34698cztM0_level2_quad_clean.evt |
| Size (bytes) | 452,727,360 | 69,719,040 |
| Size | 431.8 MB | 66.5 MB |
| Events in quadrant A | 2,590,181 | 451,661 |
| Events in quadrant B | 3,348,698 | 451,079 |
| Events in quadrant C | 2,716,044 | 444,668 |
| Events in quadrant D | 4,713,441 | 409,650 |
| Mode M0 | |||
|---|---|---|---|
| Quadrant | BADHDUFLAG | Total packets | Discarded packets |
| A | 0 | 10568 | 3 |
| B | 0 | 13049 | 2 |
| C | 0 | 10830 | 2 |
| D | 0 | 17511 | 2 |
| Mode M9 | |||
|---|---|---|---|
| Quadrant | BADHDUFLAG | Total packets | Discarded packets |
| A | 0 | 27 | 0 |
| B | 0 | 27 | 0 |
| C | 0 | 27 | 0 |
| D | 0 | 28 | 0 |
| Mode SS | |||
|---|---|---|---|
| Quadrant | BADHDUFLAG | Total packets | Discarded packets |
| A | 0 | 104 | 0 |
| B | 0 | 104 | 0 |
| C | 0 | 104 | 0 |
| D | 0 | 104 | 0 |
| Quadrant | Total seconds | Saturated seconds | Saturation percentage |
|---|---|---|---|
| A | 5046 | 14 | 0.277447% |
| B | 5046 | 173 | 3.428458% |
| C | 5046 | 27 | 0.535077% |
| D | 5046 | 275 | 5.449861% |
Noise dominated data is calculated using 1-second bins in cleaned event files. If a bin has >2000 counts, and if more than 50% of those come from <1% of pixels, then it is considered to be noise-dominated and hence unusable.
| Quadrant | # 1 sec bins | Bins with >0 counts | Bins with >2000 counts | High rate bins dominated by noise | Noise dominated (total time) | Noise dominated (detector-on time) | Marked lightcurve |
|---|---|---|---|---|---|---|---|
| A | 7168 | 5047 | 8 | 8 | 0.11% | 0.16% | 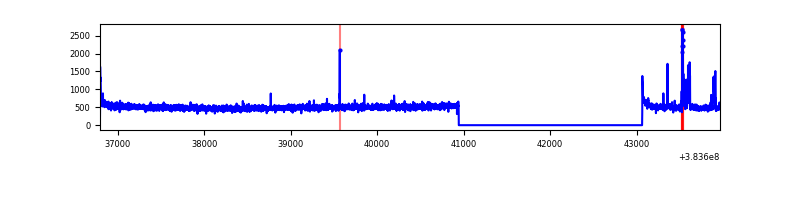 |
| B | 7168 | 5047 | 119 | 119 | 1.66% | 2.36% | 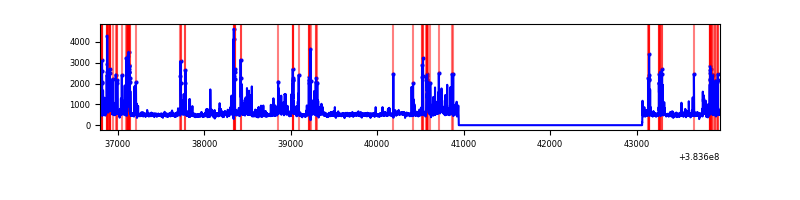 |
| C | 7168 | 5047 | 21 | 21 | 0.29% | 0.42% | 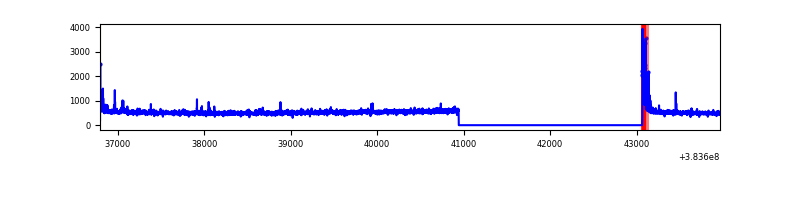 |
| D | 7168 | 5047 | 231 | 231 | 3.22% | 4.58% | 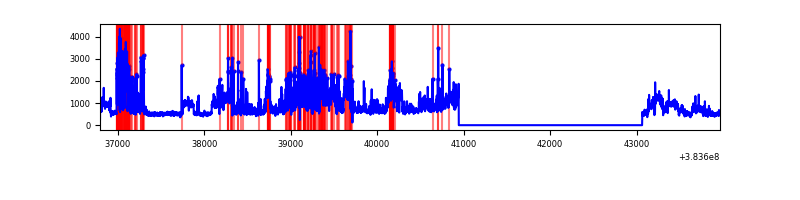 |
Top three noisy pixels from each quadrant. If the there are fewer than three noisy pixels in the level2.evt file, extra rows are filled as -1
| Pixel properties | Quadrant properties | ||||||
|---|---|---|---|---|---|---|---|
| Quadrant | DetID | PixID | Counts | Sigma | Mean | Median | Sigma |
| A | 15 | 174 | 75983 | 603.66 | 629 | 618 | 124.8 |
| A | 10 | 83 | 46937 | 371.01 | 629 | 618 | 124.8 |
| A | 7 | 48 | 13250 | 101.18 | 629 | 618 | 124.8 |
| B | 5 | 172 | 530048 | 4598.76 | 612 | 598 | 115.1 |
| B | 5 | 255 | 203774 | 1764.77 | 612 | 598 | 115.1 |
| B | 0 | 190 | 88935 | 767.29 | 612 | 598 | 115.1 |
| C | 15 | 214 | 219131 | 1601.45 | 597 | 600 | 136.5 |
| C | 0 | 10 | 105285 | 767.16 | 597 | 600 | 136.5 |
| C | 14 | 67 | 38815 | 280.05 | 597 | 600 | 136.5 |
| D | 8 | 195 | 1418692 | 9864.23 | 591 | 575 | 143.8 |
| D | 2 | 250 | 658898 | 4579.21 | 591 | 575 | 143.8 |
| D | 2 | 249 | 86784 | 599.66 | 591 | 575 | 143.8 |
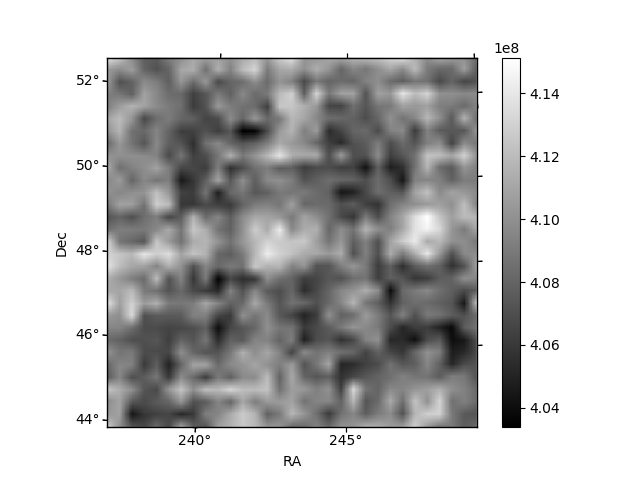
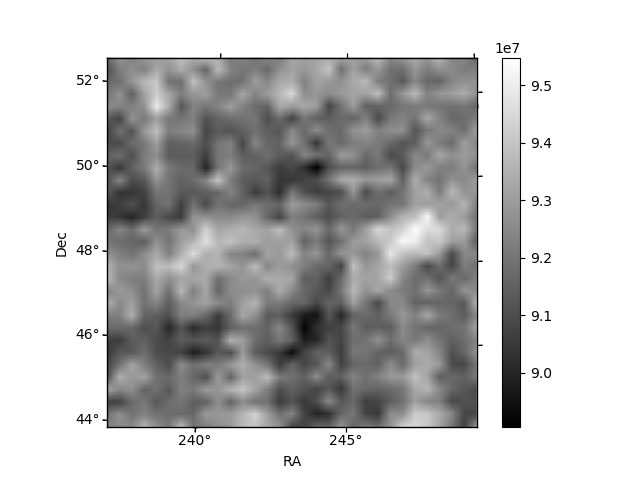
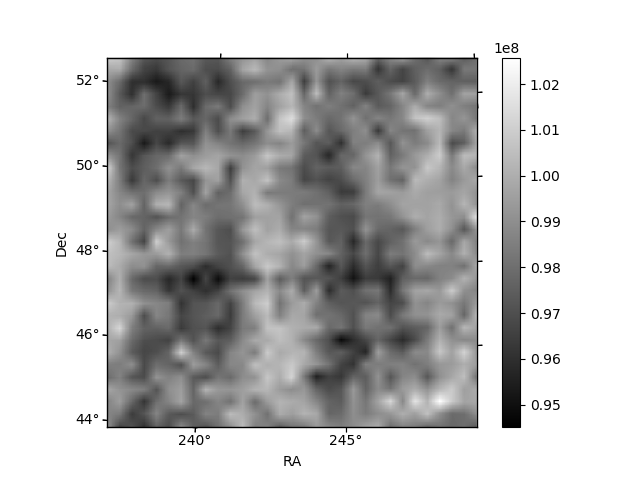
Histogram calculated using DETX and DETY for each event in the final _common_clean file
| Quadrant A | 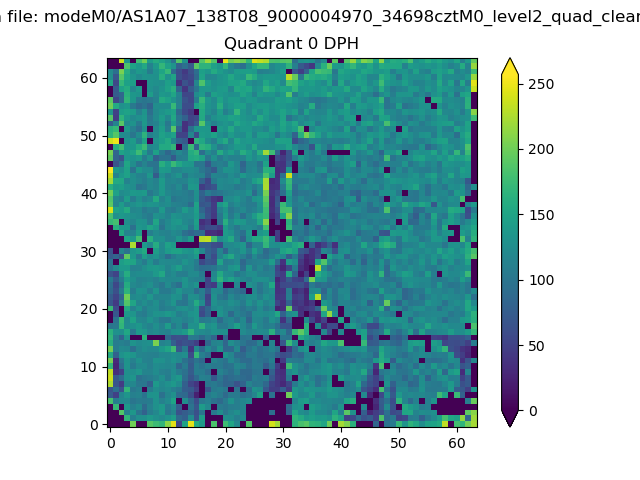 |
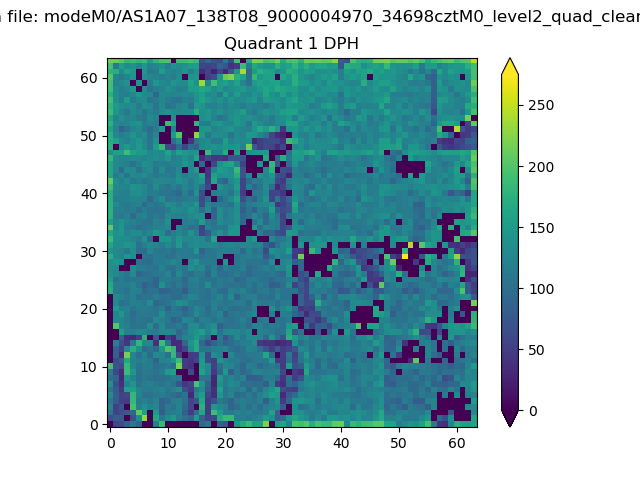 |
Quadrant B |
|---|---|---|---|
| Quadrant D | 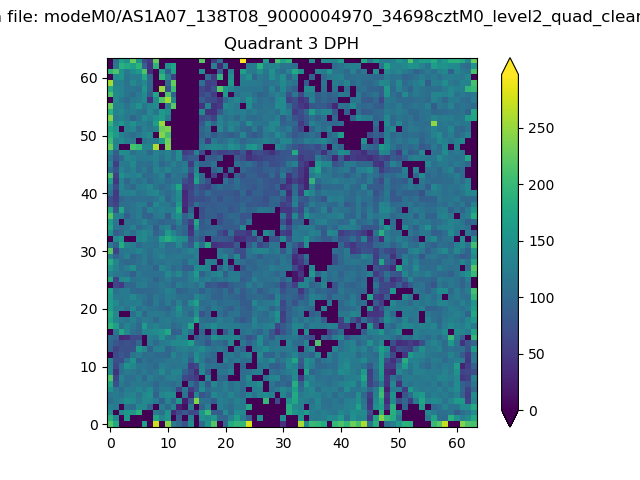 |
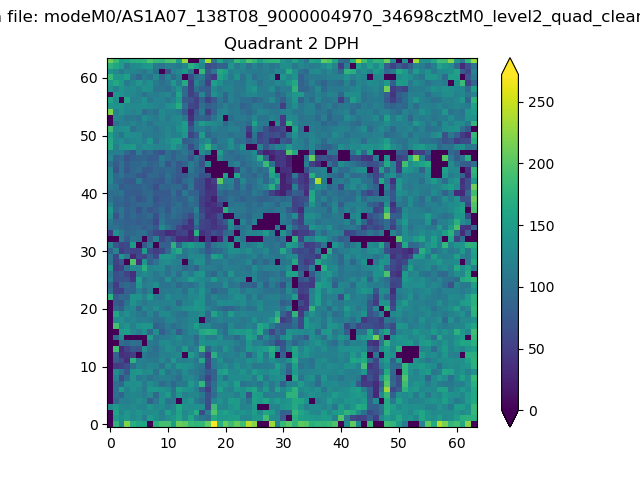 |
Quadrant C |
| Plot type | Count rate plots | Images |
|---|---|---|
| Comparison with Poisson distribution Blue bars denote a histogram of data divided into 1 sec bins. Red curve is a Poisson curve with rate = median count rate of data. |
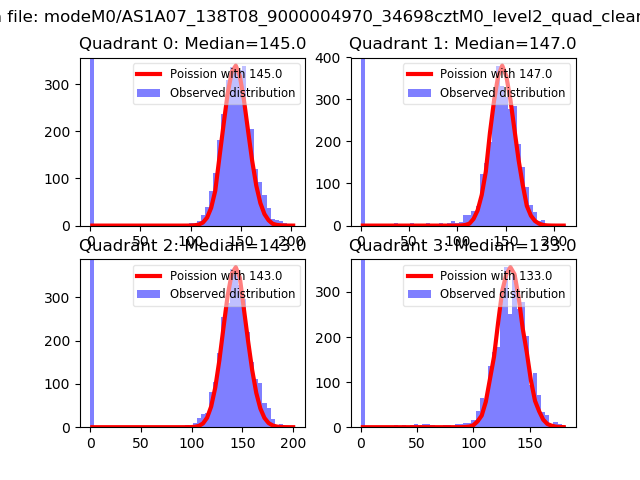 |
 |
| Quadrant-wise count rates Data is divided into 100 sec bins |
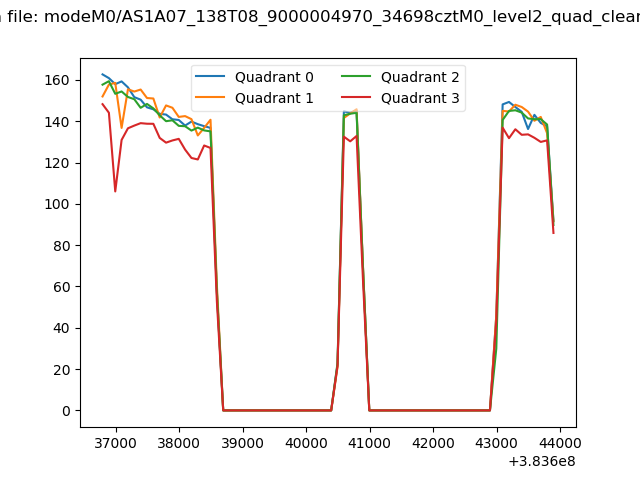 |
|
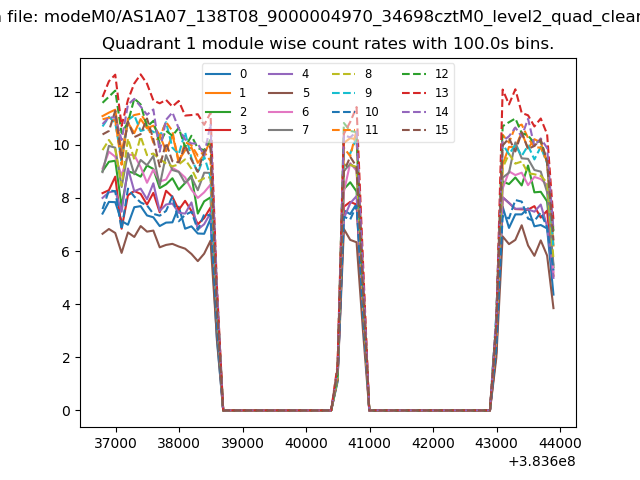
| Module-wise count rates for Quadrant A Data is divided into 100 sec bins |
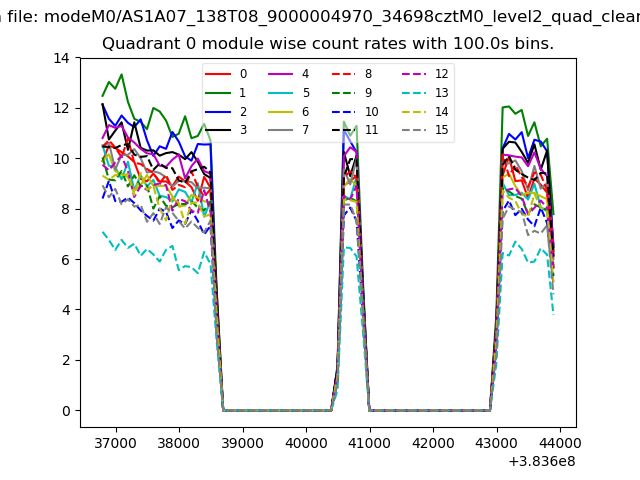 |
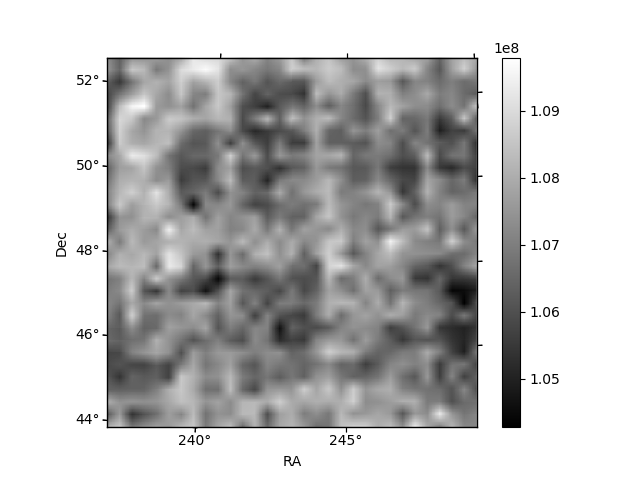 |
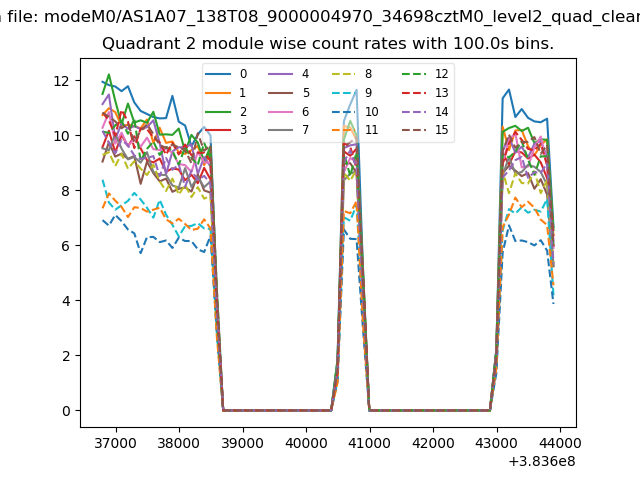
| Module-wise count rates for Quadrant B Data is divided into 100 sec bins |
 |
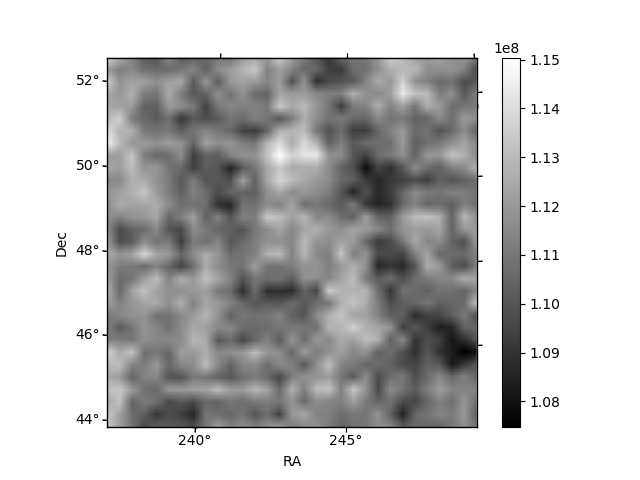 |
| Module-wise count rates for Quadrant C Data is divided into 100 sec bins |
 |
 |
| Module-wise count rates for Quadrant D Data is divided into 100 sec bins |
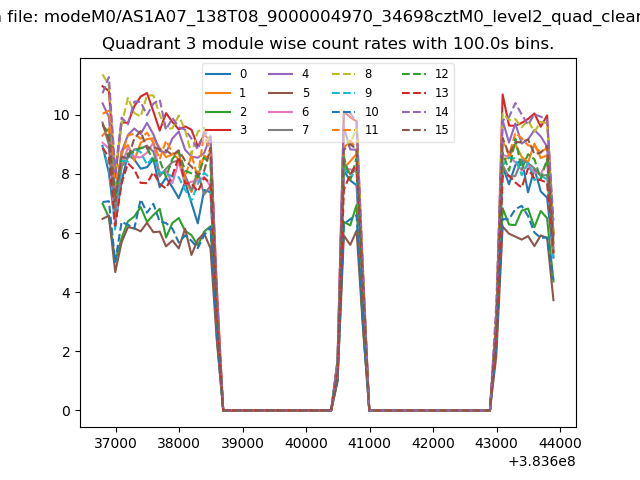 |
 |
| Parameter | Plot |
|---|---|
| CZT HV Monitor | 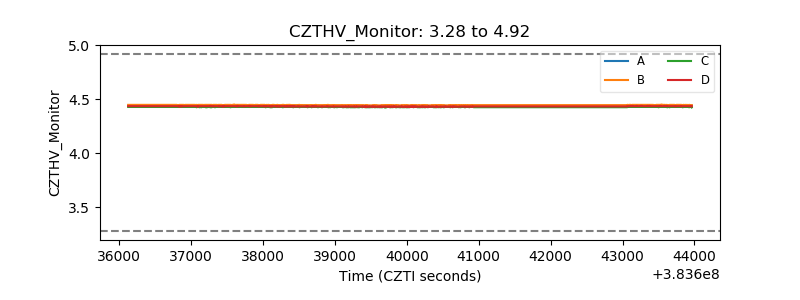 |
| D_VDD | 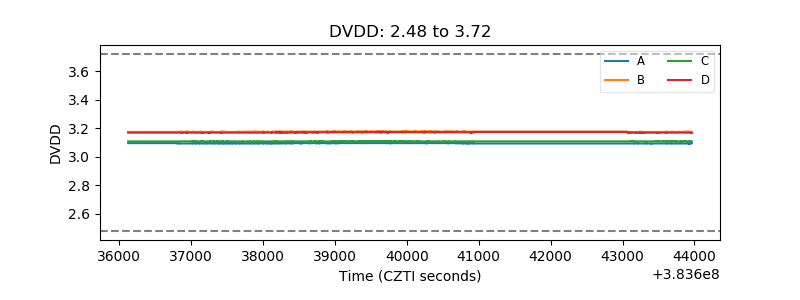 |
| Temperature 1 | 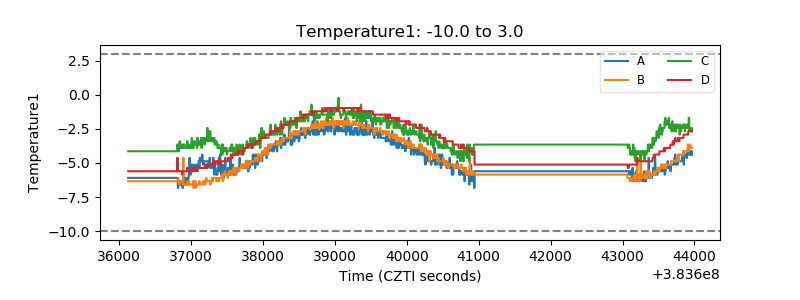 |
| Veto HV Monitor | 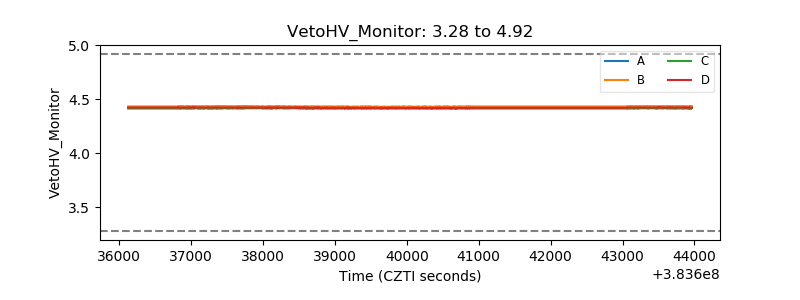 |
| Veto LLD | 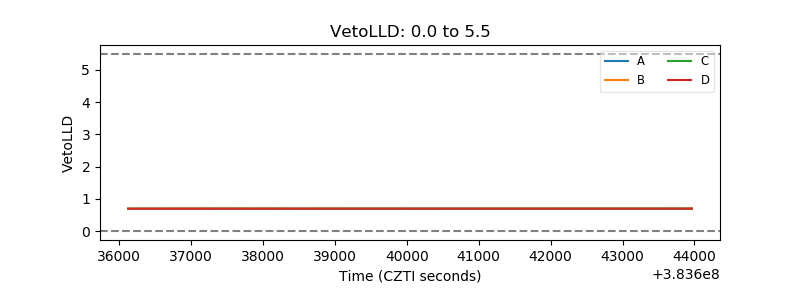 |
| Alpha Counter | 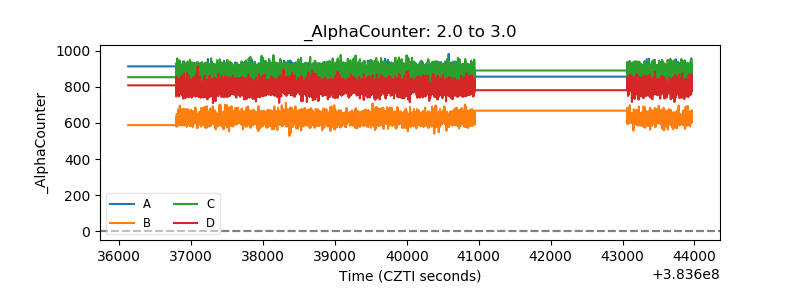 |
| _CPM_Rate | 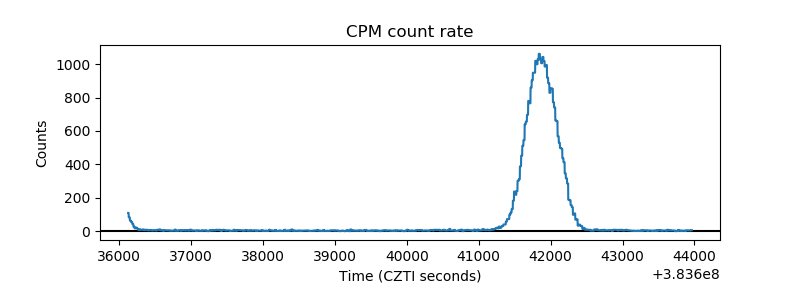 |
| CZT Counter | 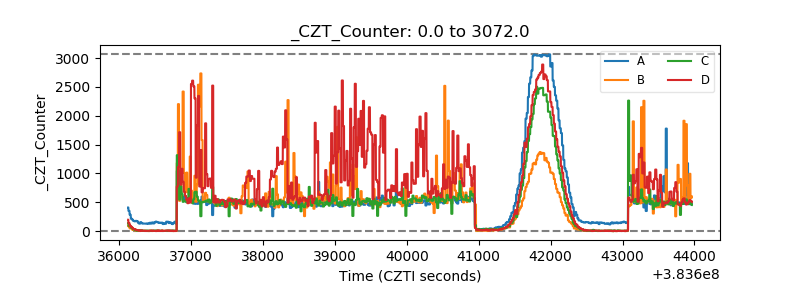 |
| +2.5 Volts monitor | 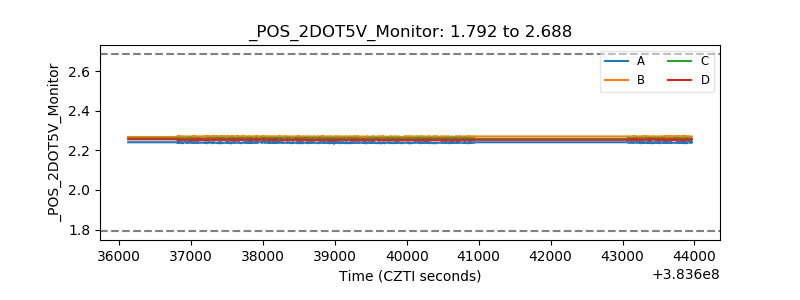 |
| +5 Volts monitor | 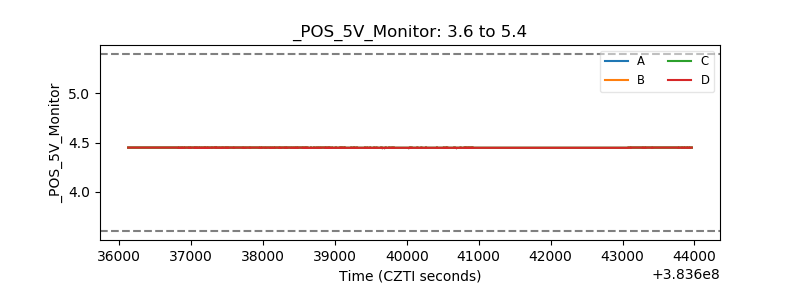 |
| _ROLL_ROT | 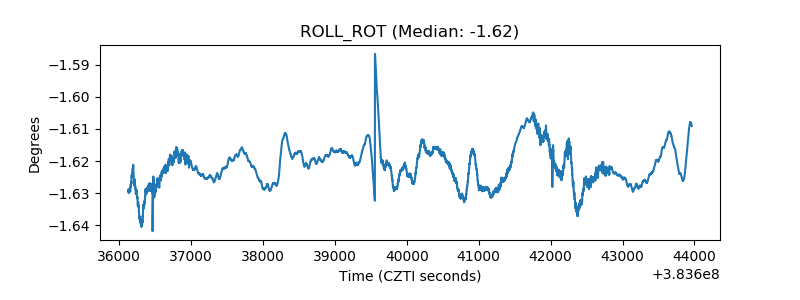 |
| _Roll_DEC | 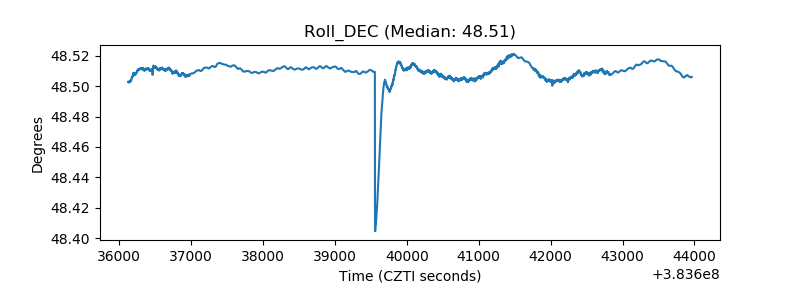 |
| _Roll_RA | 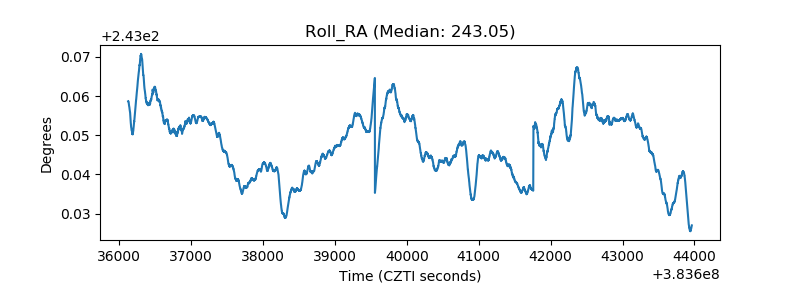 |
| Veto Counter | 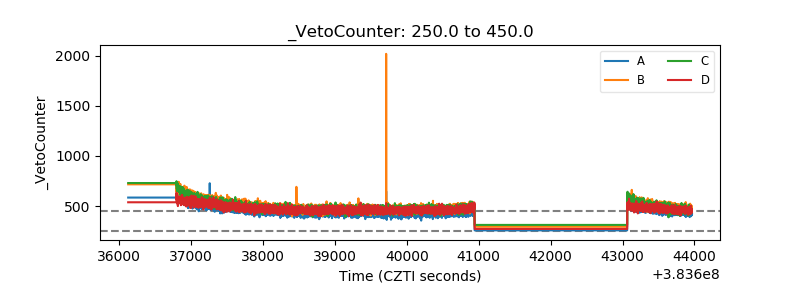 |