| Param | Original file | Final file |
|---|---|---|
| Filename | modeM0/AS1A07_138T08_9000004970cztM0_level2_bc.evt | modeM0/AS1A07_138T08_9000004970cztM0_level2_quad_clean.evt |
| Size (bytes) | 1,796,256,000 | 410,915,520 |
| Size | 1.7 GB | 391.9 MB |
| Events in quadrant A | 7,941,310 | 2,621,513 |
| Events in quadrant B | 12,627,634 | 2,544,670 |
| Events in quadrant C | 8,728,467 | 2,615,530 |
| Events in quadrant D | 22,864,674 | 2,403,213 |
| Mode M0 | |||
|---|---|---|---|
| Quadrant | BADHDUFLAG | Total packets | Discarded packets |
| A | 0 | 68856 | 0 |
| B | 0 | 90181 | 0 |
| C | 0 | 68908 | 0 |
| D | 0 | 118640 | 0 |
| Mode M9 | |||
|---|---|---|---|
| Quadrant | BADHDUFLAG | Total packets | Discarded packets |
| A | 0 | 138 | 0 |
| B | 0 | 138 | 0 |
| C | 0 | 138 | 0 |
| D | 0 | 138 | 0 |
| Mode SS | |||
|---|---|---|---|
| Quadrant | BADHDUFLAG | Total packets | Discarded packets |
| A | 0 | 672 | 0 |
| B | 0 | 672 | 0 |
| C | 0 | 672 | 0 |
| D | 0 | 672 | 0 |
| Quadrant | Total seconds | Saturated seconds | Saturation percentage |
|---|---|---|---|
| A | 32901 | 116 | 0.352573% |
| B | 32901 | 2134 | 6.486125% |
| C | 32901 | 115 | 0.349533% |
| D | 32901 | 1886 | 5.732349% |
Noise dominated data is calculated using 1-second bins in cleaned event files. If a bin has >2000 counts, and if more than 50% of those come from <1% of pixels, then it is considered to be noise-dominated and hence unusable.
| Quadrant | # 1 sec bins | Bins with >0 counts | Bins with >2000 counts | High rate bins dominated by noise | Noise dominated (total time) | Noise dominated (detector-on time) | Marked lightcurve |
|---|---|---|---|---|---|---|---|
| A | 46682 | 32907 | 14 | 14 | 0.03% | 0.04% | 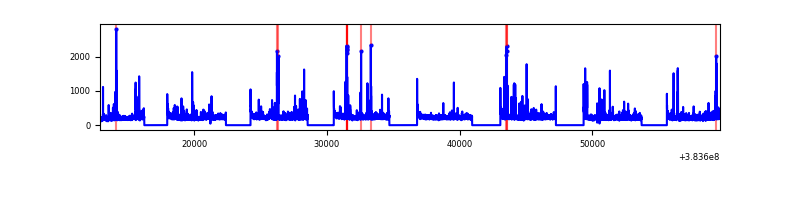 |
| B | 46682 | 32899 | 91 | 91 | 0.19% | 0.28% | 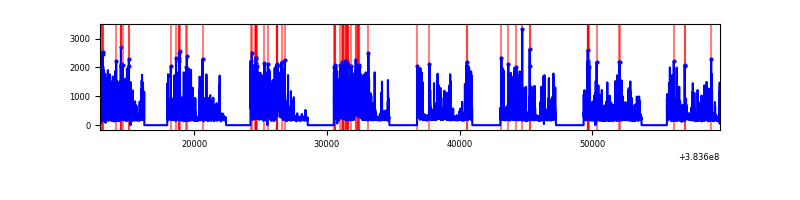 |
| C | 46682 | 32901 | 11 | 11 | 0.02% | 0.03% | 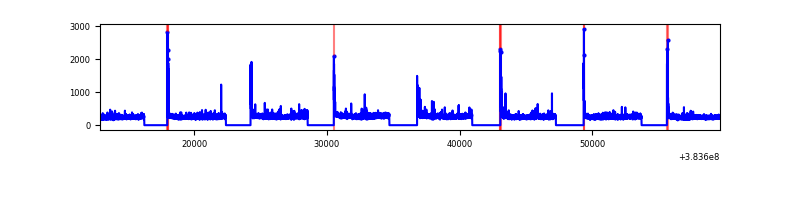 |
| D | 46682 | 32900 | 242 | 242 | 0.52% | 0.74% | 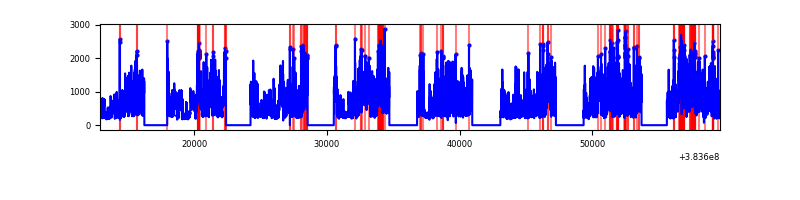 |
Top three noisy pixels from each quadrant. If the there are fewer than three noisy pixels in the level2.evt file, extra rows are filled as -1
| Pixel properties | Quadrant properties | ||||||
|---|---|---|---|---|---|---|---|
| Quadrant | DetID | PixID | Counts | Sigma | Mean | Median | Sigma |
| A | 15 | 174 | 320257 | 815.15 | 1785 | 1764 | 390.7 |
| A | 10 | 83 | 191143 | 484.69 | 1785 | 1764 | 390.7 |
| A | 9 | 143 | 163896 | 414.96 | 1785 | 1764 | 390.7 |
| B | 5 | 172 | 3908757 | 11496.77 | 1746 | 1715 | 339.8 |
| B | 5 | 255 | 1171074 | 3440.93 | 1746 | 1715 | 339.8 |
| B | 0 | 190 | 188196 | 548.73 | 1746 | 1715 | 339.8 |
| C | 15 | 214 | 1331927 | 3418.47 | 1729 | 1718 | 389.1 |
| C | 0 | 10 | 319072 | 815.56 | 1729 | 1718 | 389.1 |
| C | 14 | 67 | 228096 | 581.76 | 1729 | 1718 | 389.1 |
| D | 8 | 195 | 10700699 | 26939.19 | 1693 | 1647 | 397.2 |
| D | 2 | 250 | 1092296 | 2746.15 | 1693 | 1647 | 397.2 |
| D | 1 | 52 | 1056659 | 2656.42 | 1693 | 1647 | 397.2 |
Histogram calculated using DETX and DETY for each event in the final _common_clean file
| Quadrant A | 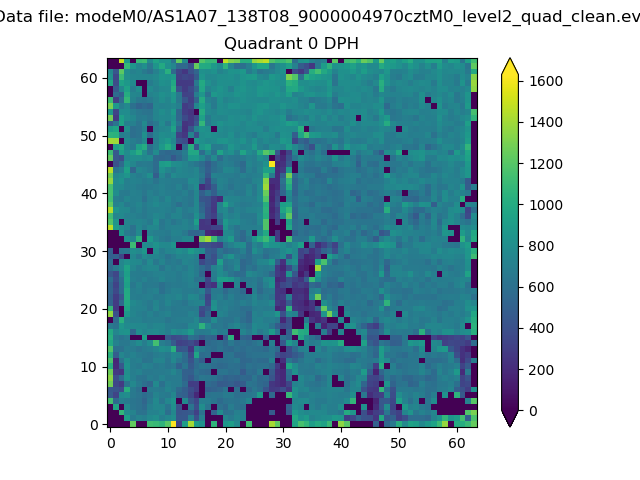 |
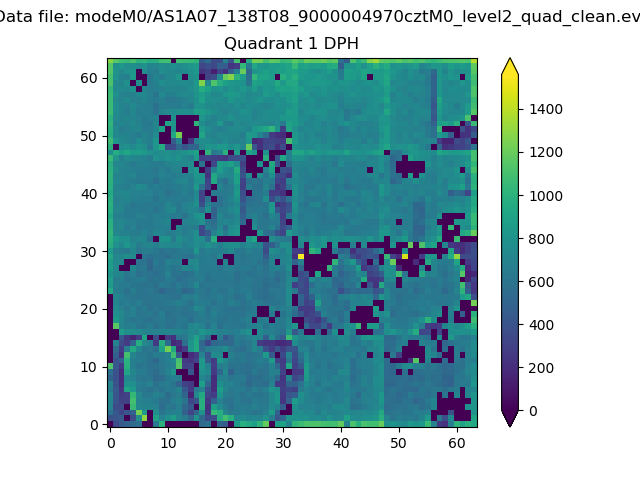 |
Quadrant B |
|---|---|---|---|
| Quadrant D |  |
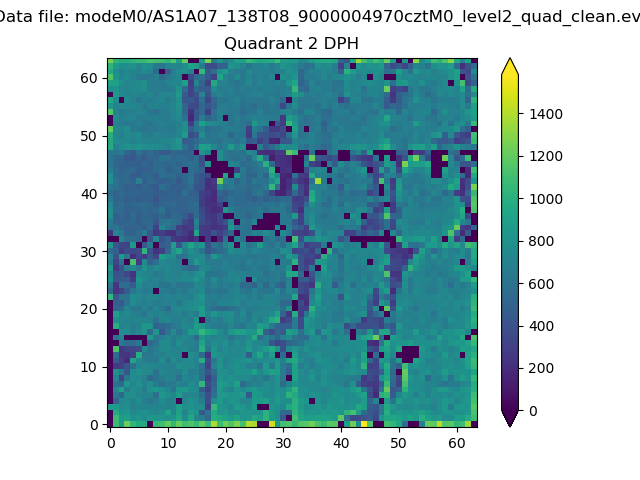 |
Quadrant C |
| Plot type | Count rate plots | Images |
|---|---|---|
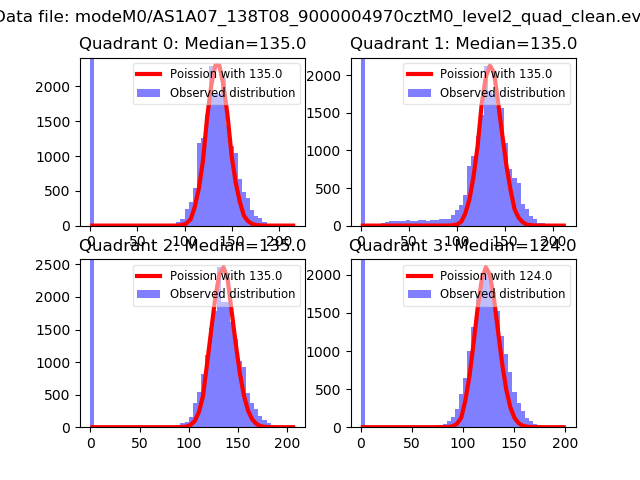
| Comparison with Poisson distribution Blue bars denote a histogram of data divided into 1 sec bins. Red curve is a Poisson curve with rate = median count rate of data. |
 |
 |
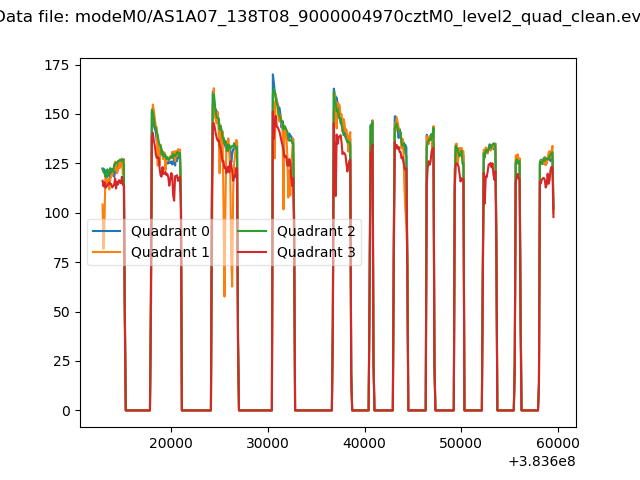
| Quadrant-wise count rates Data is divided into 100 sec bins |
 |
|
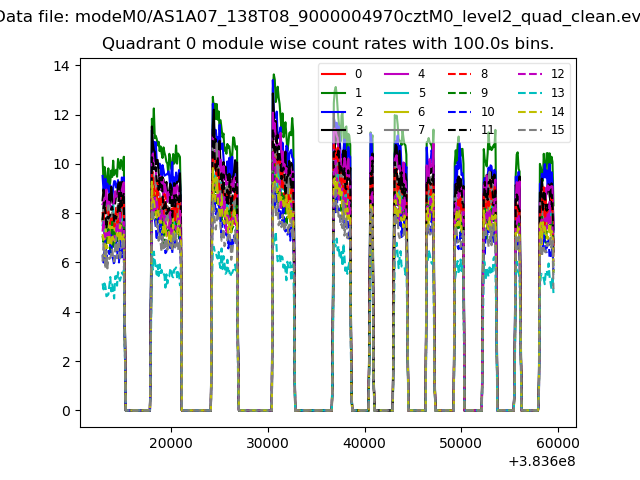
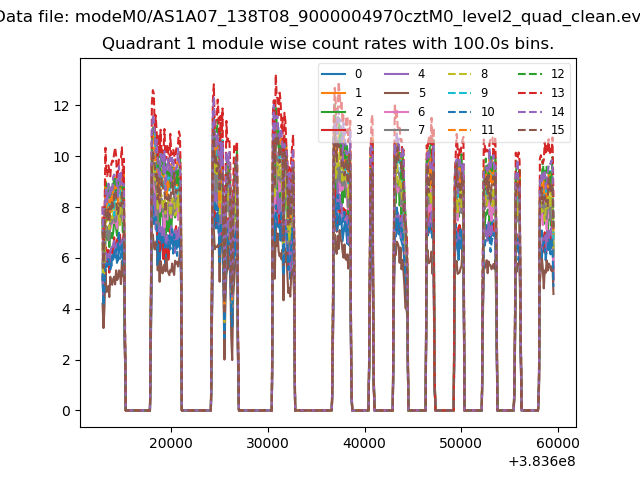
| Module-wise count rates for Quadrant A Data is divided into 100 sec bins |
 |
 |
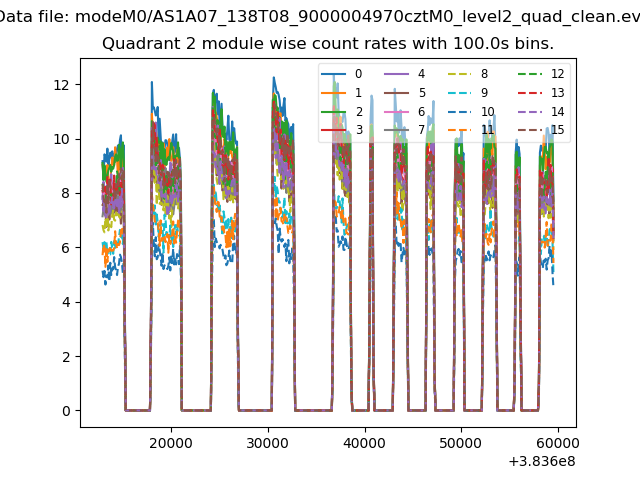
| Module-wise count rates for Quadrant B Data is divided into 100 sec bins |
 |
 |
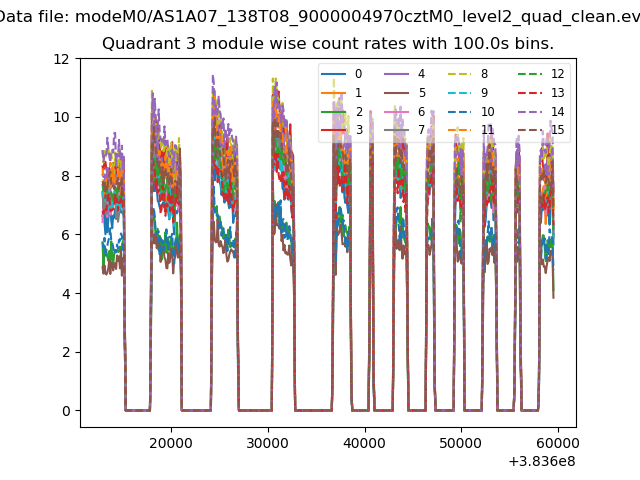
| Module-wise count rates for Quadrant C Data is divided into 100 sec bins |
 |
 |
| Module-wise count rates for Quadrant D Data is divided into 100 sec bins |
 |
 |
| Parameter | Plot |
|---|---|
| CZT HV Monitor | 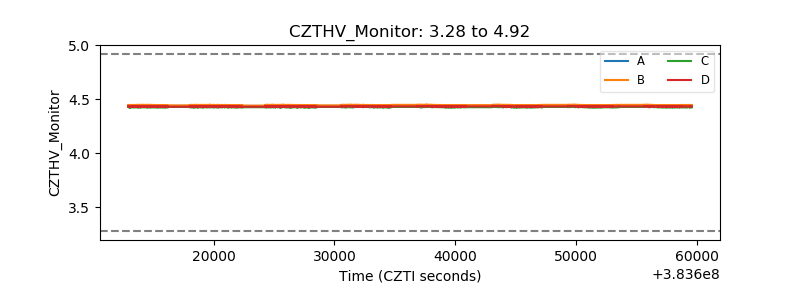 |
| D_VDD | 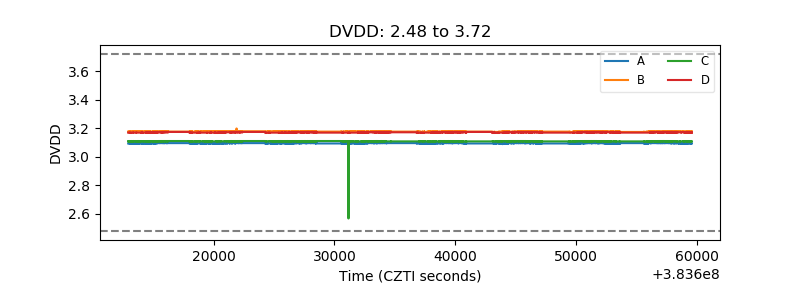 |
| Temperature 1 | 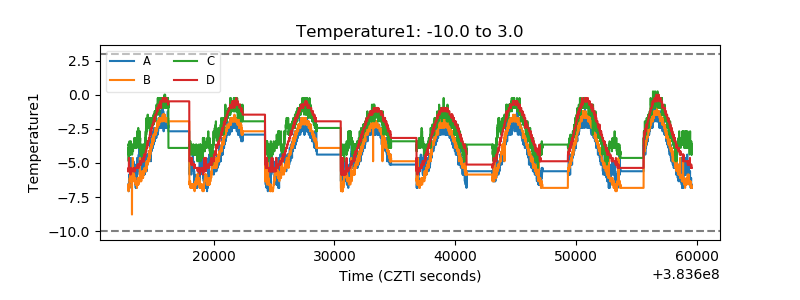 |
| Veto HV Monitor | 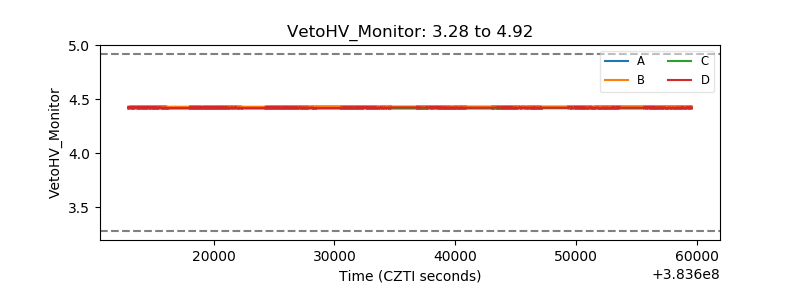 |
| Veto LLD | 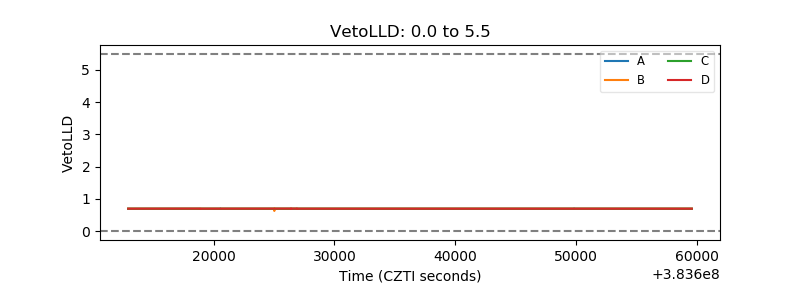 |
| Alpha Counter | 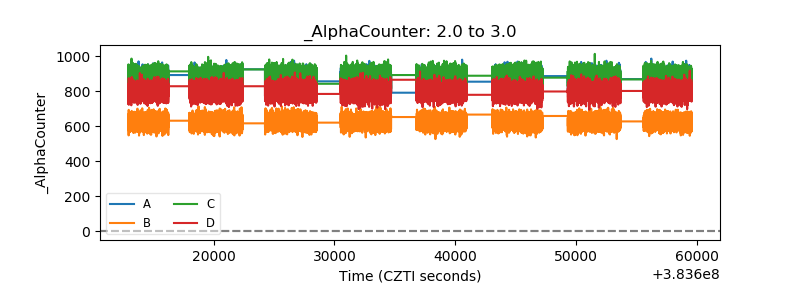 |
| _CPM_Rate | 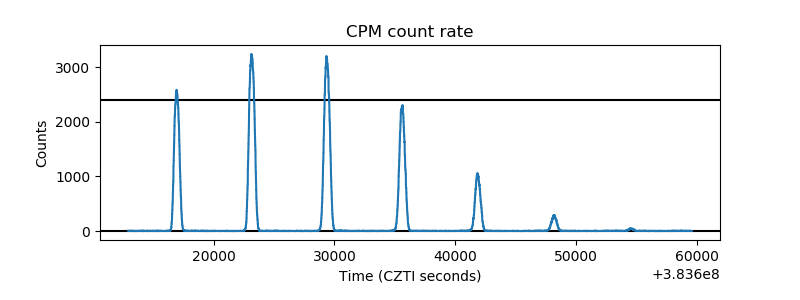 |
| CZT Counter | 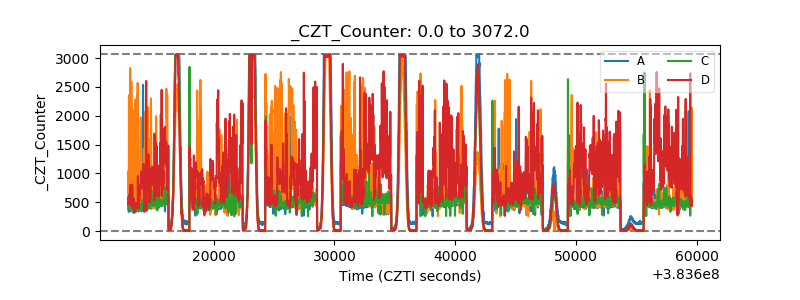 |
| +2.5 Volts monitor | 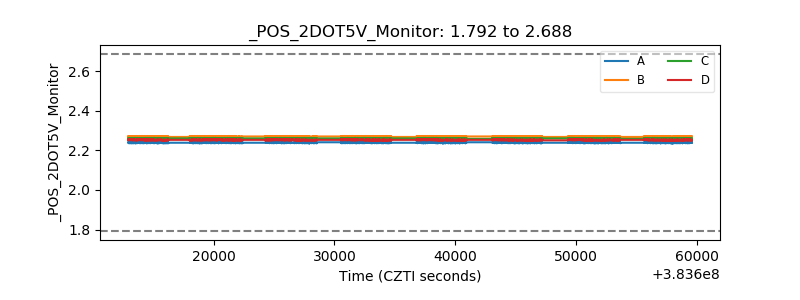 |
| +5 Volts monitor | 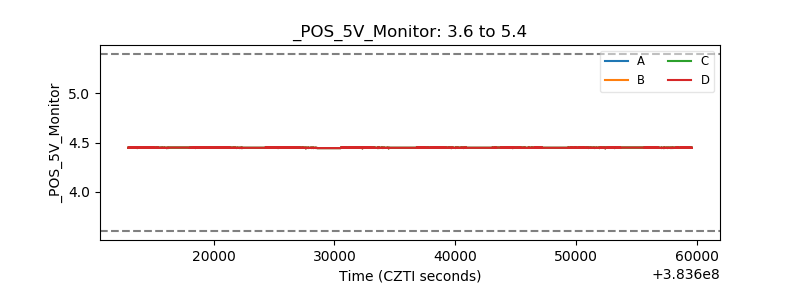 |
| _ROLL_ROT | 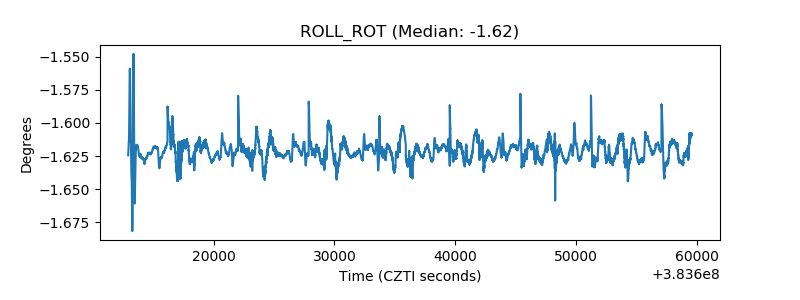 |
| _Roll_DEC | 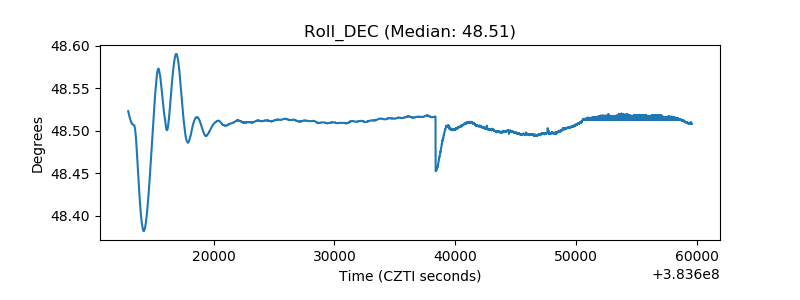 |
| _Roll_RA | 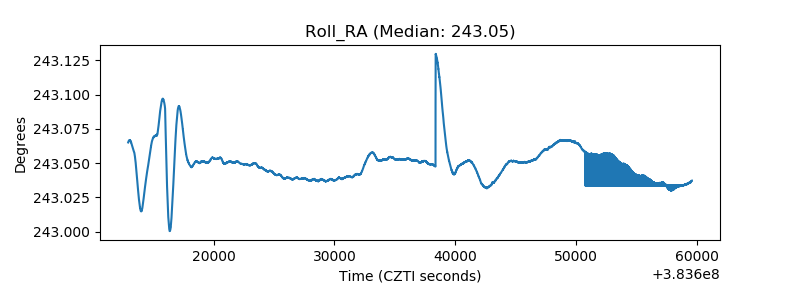 |
| Veto Counter | 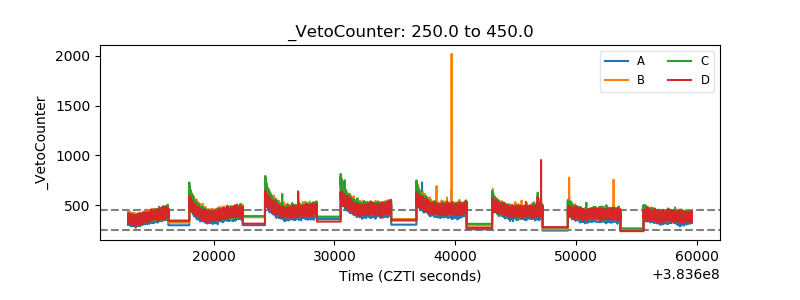 |