| Param | Original file | Final file |
|---|---|---|
| Filename | modeM0/AS1A07_093T29_9000004968_34691cztM0_level2.evt | modeM0/AS1A07_093T29_9000004968_34691cztM0_level2_quad_clean.evt |
| Size (bytes) | 806,094,720 | 121,668,480 |
| Size | 768.8 MB | 116.0 MB |
| Events in quadrant A | 5,067,102 | 776,136 |
| Events in quadrant B | 6,536,227 | 763,716 |
| Events in quadrant C | 4,450,957 | 787,215 |
| Events in quadrant D | 7,758,239 | 740,462 |
| Mode M9 | |||
|---|---|---|---|
| Quadrant | BADHDUFLAG | Total packets | Discarded packets |
| A | 0 | 29 | 0 |
| B | 0 | 29 | 0 |
| C | 0 | 29 | 0 |
| D | 0 | 29 | 0 |
| Mode M0 | |||
|---|---|---|---|
| Quadrant | BADHDUFLAG | Total packets | Discarded packets |
| A | 0 | 20921 | 3 |
| B | 0 | 25198 | 2 |
| C | 0 | 18643 | 2 |
| D | 0 | 29237 | 2 |
| Mode SS | |||
|---|---|---|---|
| Quadrant | BADHDUFLAG | Total packets | Discarded packets |
| A | 0 | 182 | 0 |
| B | 0 | 182 | 0 |
| C | 0 | 182 | 0 |
| D | 0 | 182 | 0 |
| Quadrant | Total seconds | Saturated seconds | Saturation percentage |
|---|---|---|---|
| A | 8888 | 164 | 1.845185% |
| B | 8888 | 578 | 6.503150% |
| C | 8888 | 59 | 0.663816% |
| D | 8888 | 254 | 2.857786% |
Noise dominated data is calculated using 1-second bins in cleaned event files. If a bin has >2000 counts, and if more than 50% of those come from <1% of pixels, then it is considered to be noise-dominated and hence unusable.
| Quadrant | # 1 sec bins | Bins with >0 counts | Bins with >2000 counts | High rate bins dominated by noise | Noise dominated (total time) | Noise dominated (detector-on time) | Marked lightcurve |
|---|---|---|---|---|---|---|---|
| A | 11753 | 8890 | 127 | 127 | 1.08% | 1.43% | 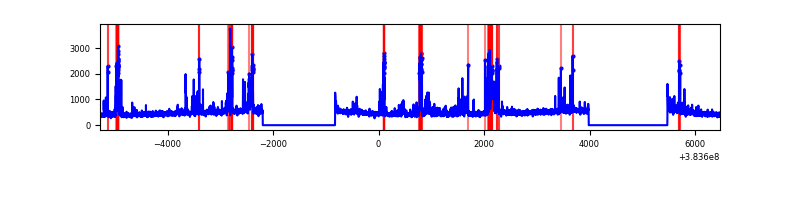 |
| B | 11753 | 8890 | 414 | 414 | 3.52% | 4.66% | 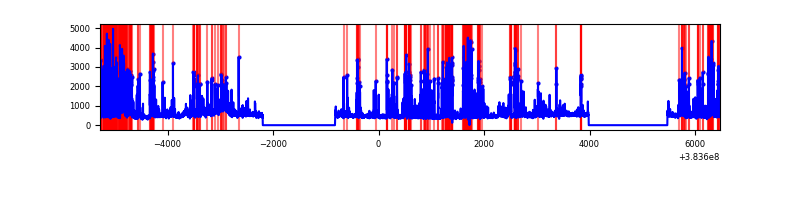 |
| C | 11753 | 8890 | 37 | 37 | 0.31% | 0.42% | 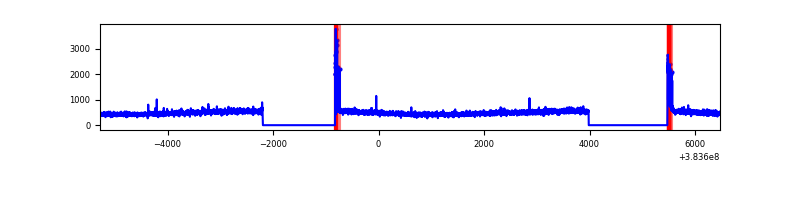 |
| D | 11753 | 8890 | 152 | 152 | 1.29% | 1.71% | 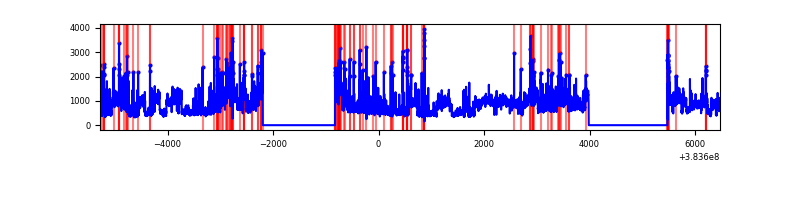 |
Top three noisy pixels from each quadrant. If the there are fewer than three noisy pixels in the level2.evt file, extra rows are filled as -1
| Pixel properties | Quadrant properties | ||||||
|---|---|---|---|---|---|---|---|
| Quadrant | DetID | PixID | Counts | Sigma | Mean | Median | Sigma |
| A | 15 | 174 | 504546 | 2469.73 | 1017 | 995 | 203.9 |
| A | 14 | 250 | 332229 | 1624.58 | 1017 | 995 | 203.9 |
| A | 15 | 169 | 144539 | 704.03 | 1017 | 995 | 203.9 |
| B | 5 | 172 | 2120373 | 11102.59 | 994 | 967 | 190.9 |
| B | 5 | 255 | 192273 | 1002.16 | 994 | 967 | 190.9 |
| B | 0 | 190 | 146543 | 762.6 | 994 | 967 | 190.9 |
| C | 15 | 214 | 374527 | 1632.74 | 989 | 993 | 228.8 |
| C | 0 | 10 | 161997 | 703.76 | 989 | 993 | 228.8 |
| C | 14 | 67 | 34046 | 144.48 | 989 | 993 | 228.8 |
| D | 8 | 195 | 2790819 | 10733.38 | 974 | 952 | 259.9 |
| D | 2 | 250 | 413036 | 1585.4 | 974 | 952 | 259.9 |
| D | 2 | 249 | 184663 | 706.79 | 974 | 952 | 259.9 |
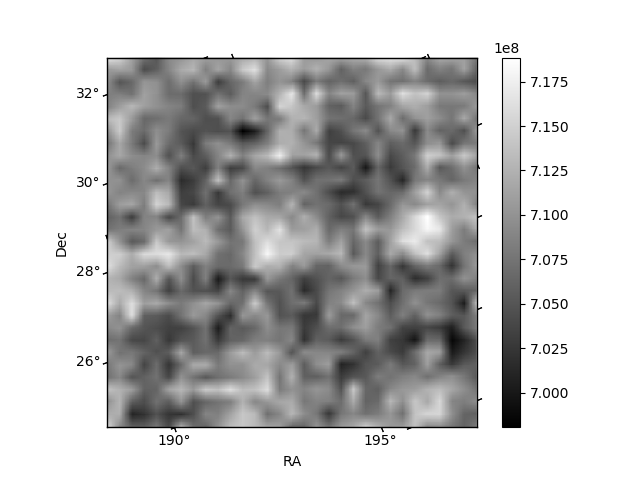
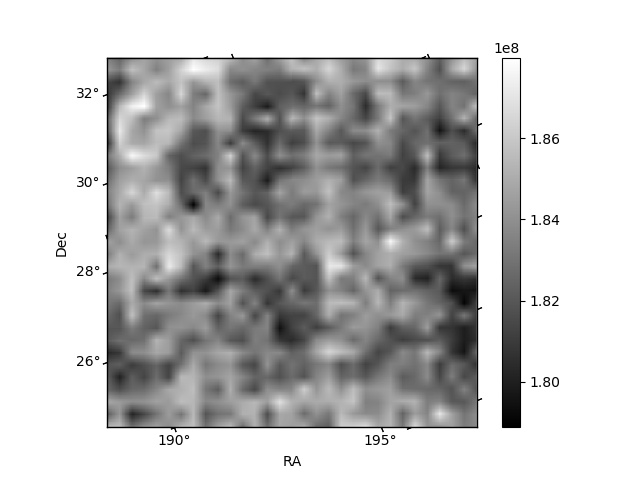
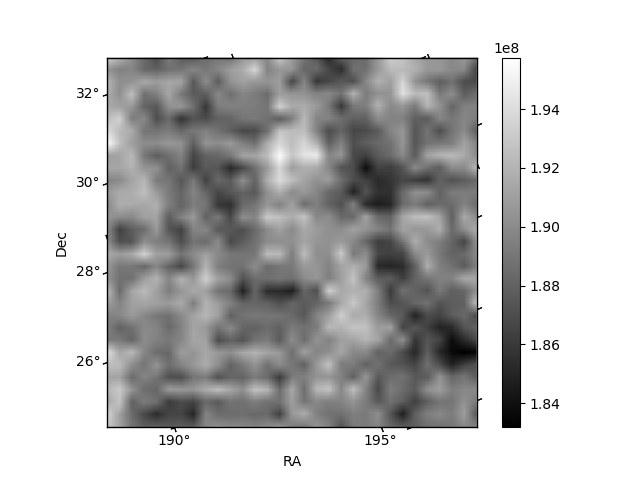
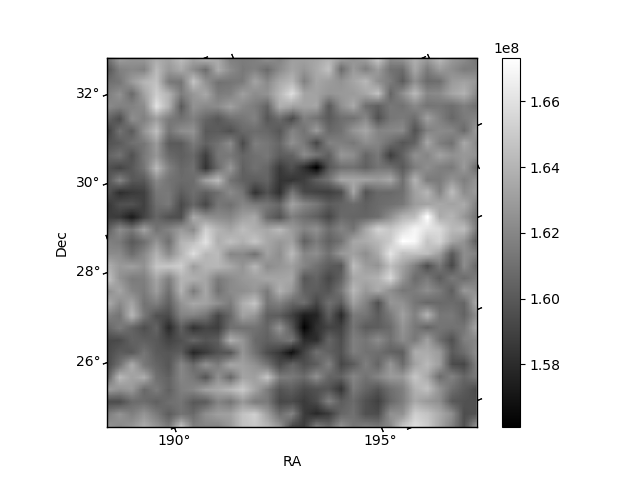
Histogram calculated using DETX and DETY for each event in the final _common_clean file
| Quadrant A | 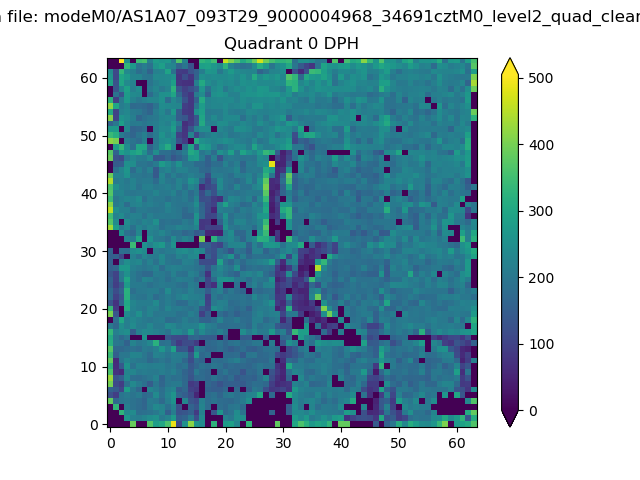 |
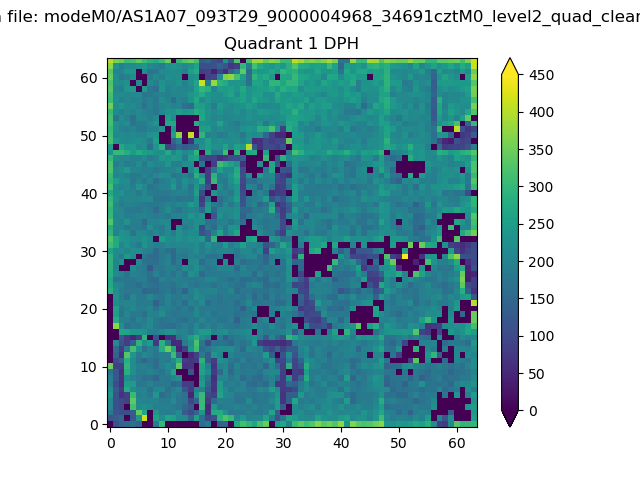 |
Quadrant B |
|---|---|---|---|
| Quadrant D | 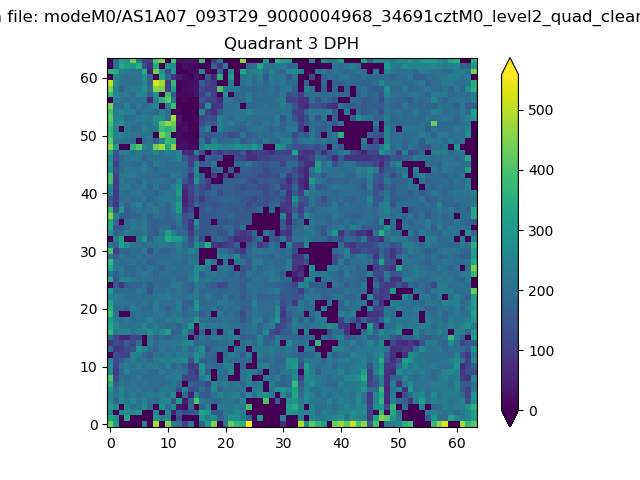 |
 |
Quadrant C |
| Plot type | Count rate plots | Images |
|---|---|---|
| Comparison with Poisson distribution Blue bars denote a histogram of data divided into 1 sec bins. Red curve is a Poisson curve with rate = median count rate of data. |
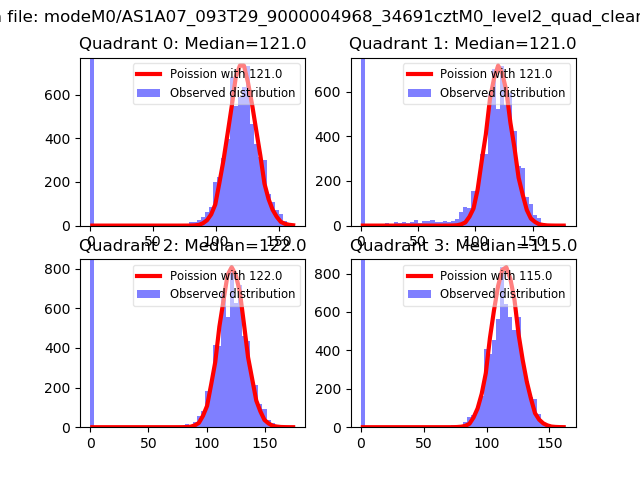 |
 |
| Quadrant-wise count rates Data is divided into 100 sec bins |
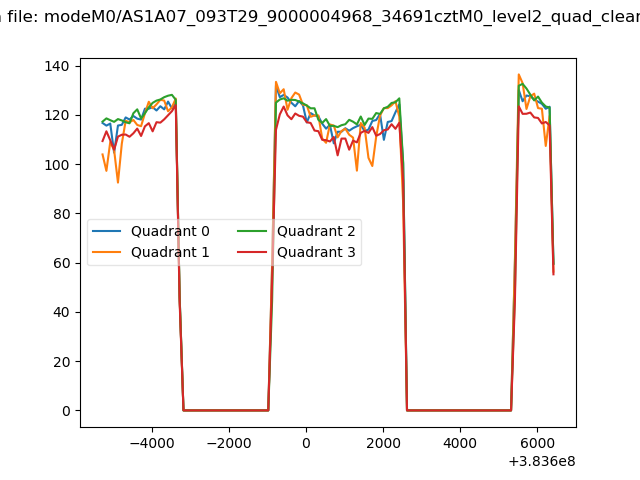 |
|
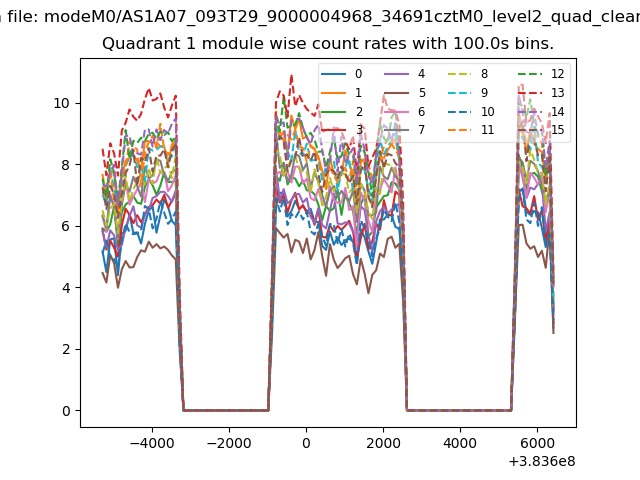
| Module-wise count rates for Quadrant A Data is divided into 100 sec bins |
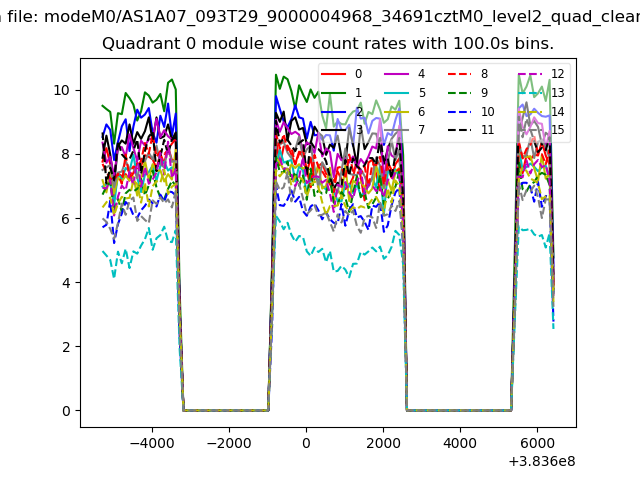 |
 |
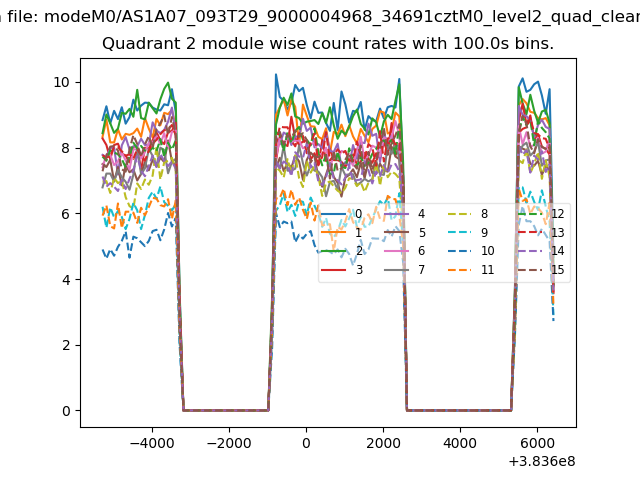
| Module-wise count rates for Quadrant B Data is divided into 100 sec bins |
 |
 |
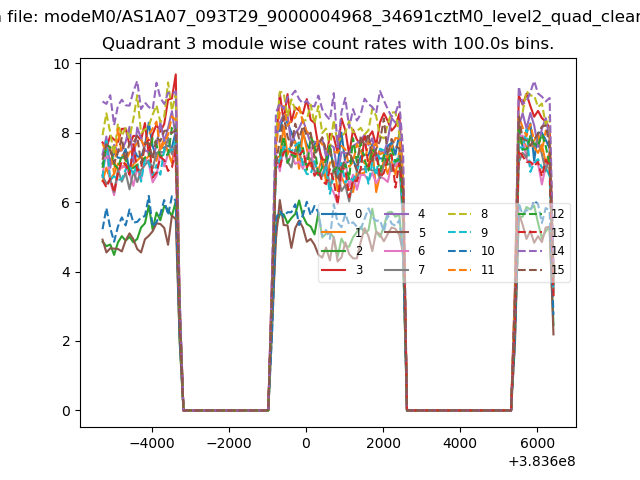
| Module-wise count rates for Quadrant C Data is divided into 100 sec bins |
 |
 |
| Module-wise count rates for Quadrant D Data is divided into 100 sec bins |
 |
 |
| Parameter | Plot |
|---|---|
| CZT HV Monitor | 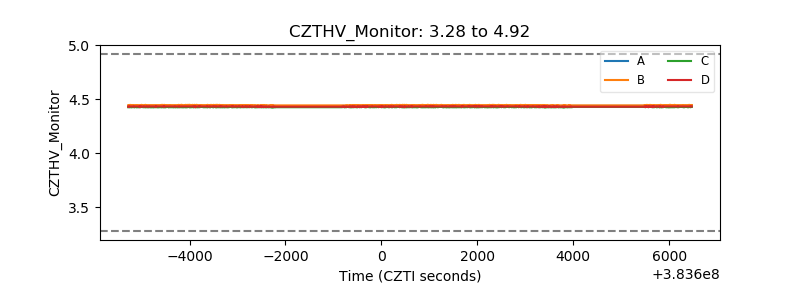 |
| D_VDD | 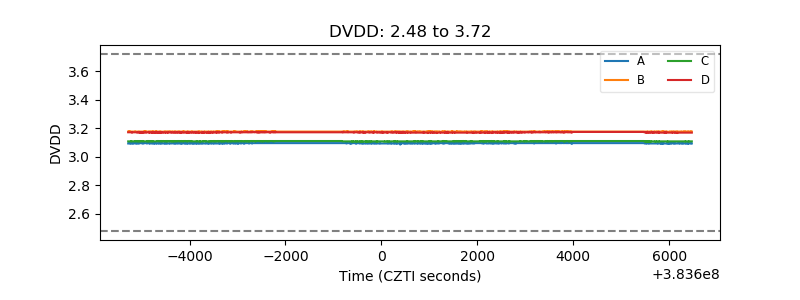 |
| Temperature 1 | 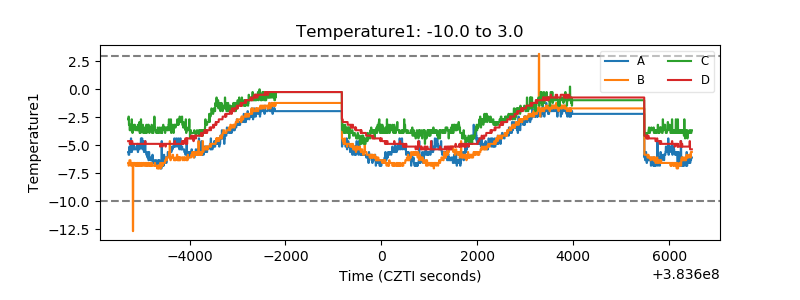 |
| Veto HV Monitor | 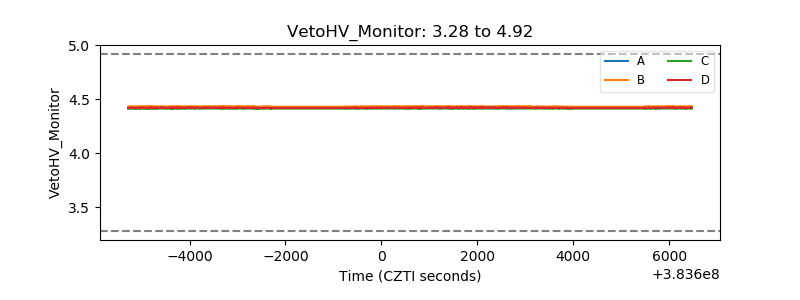 |
| Veto LLD | 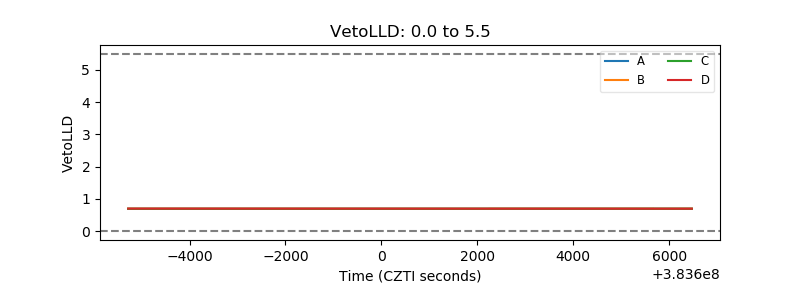 |
| Alpha Counter | 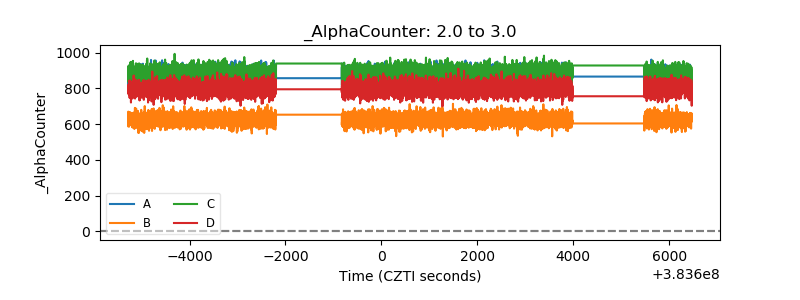 |
| _CPM_Rate | 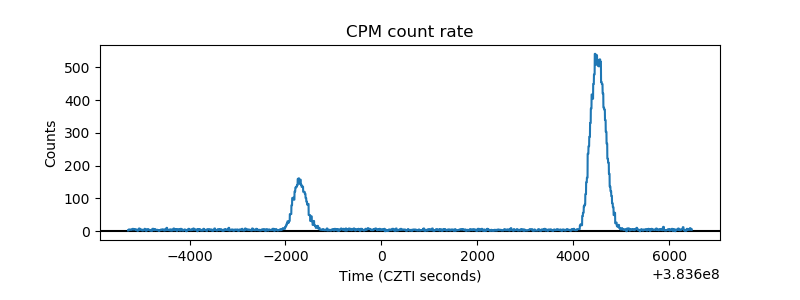 |
| CZT Counter | 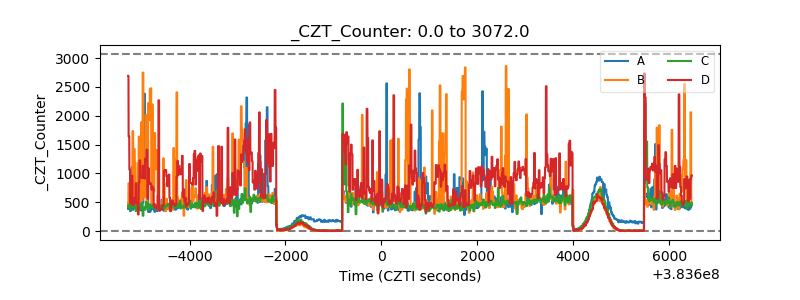 |
| +2.5 Volts monitor | 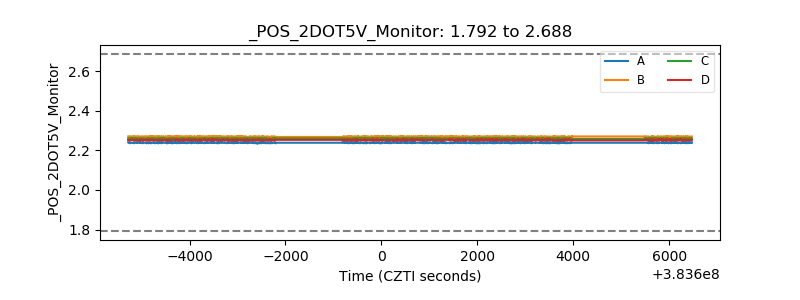 |
| +5 Volts monitor | 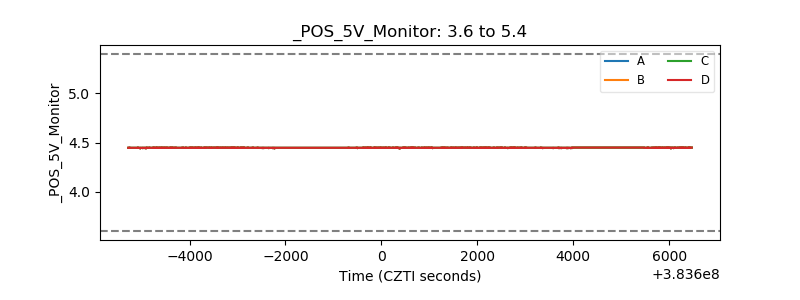 |
| _ROLL_ROT | 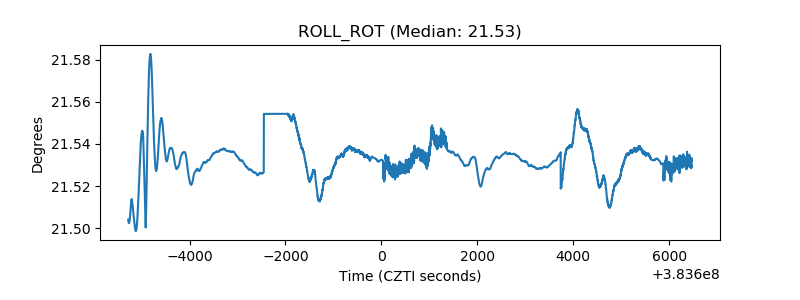 |
| _Roll_DEC | 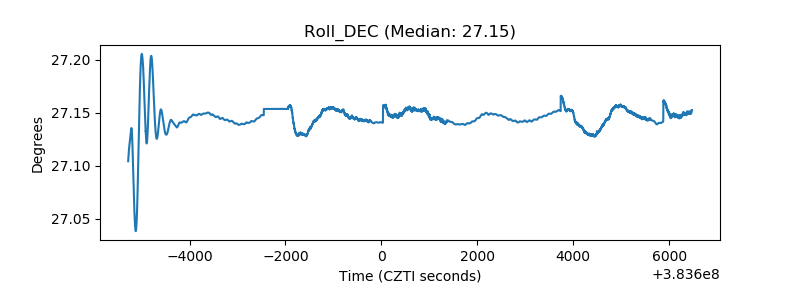 |
| _Roll_RA | 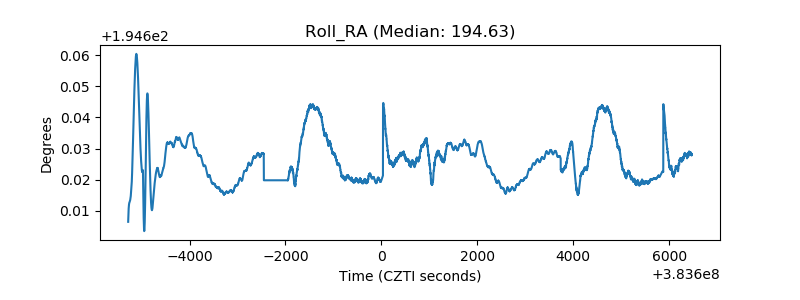 |
| Veto Counter | 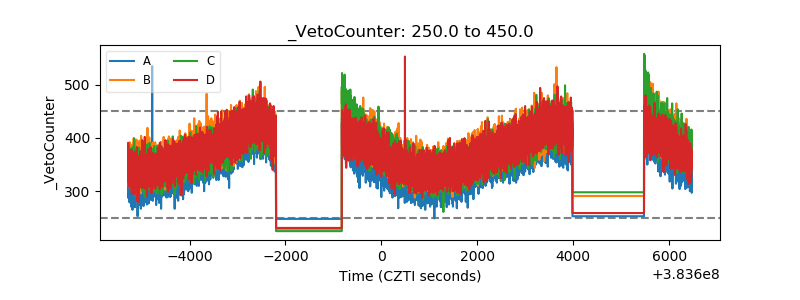 |