| Param | Original file | Final file |
|---|---|---|
| Filename | modeM0/AS1A07_093T16_9000004966_34691cztM0_level2.evt | modeM0/AS1A07_093T16_9000004966_34691cztM0_level2_quad_clean.evt |
| Size (bytes) | 605,030,400 | 98,593,920 |
| Size | 577.0 MB | 94.0 MB |
| Events in quadrant A | 2,988,471 | 669,331 |
| Events in quadrant B | 4,791,548 | 643,971 |
| Events in quadrant C | 3,112,133 | 658,725 |
| Events in quadrant D | 7,008,356 | 577,416 |
| Mode M0 | |||
|---|---|---|---|
| Quadrant | BADHDUFLAG | Total packets | Discarded packets |
| A | 0 | 13098 | 2 |
| B | 0 | 18403 | 2 |
| C | 0 | 12917 | 2 |
| D | 0 | 25147 | 2 |
| Mode M9 | |||
|---|---|---|---|
| Quadrant | BADHDUFLAG | Total packets | Discarded packets |
| A | 0 | 26 | 0 |
| B | 0 | 26 | 0 |
| C | 0 | 26 | 0 |
| D | 0 | 26 | 0 |
| Mode SS | |||
|---|---|---|---|
| Quadrant | BADHDUFLAG | Total packets | Discarded packets |
| A | 0 | 128 | 0 |
| B | 0 | 128 | 0 |
| C | 0 | 128 | 0 |
| D | 0 | 128 | 0 |
| Quadrant | Total seconds | Saturated seconds | Saturation percentage |
|---|---|---|---|
| A | 6249 | 24 | 0.384061% |
| B | 6249 | 606 | 9.697552% |
| C | 6249 | 20 | 0.320051% |
| D | 6249 | 977 | 15.634502% |
Noise dominated data is calculated using 1-second bins in cleaned event files. If a bin has >2000 counts, and if more than 50% of those come from <1% of pixels, then it is considered to be noise-dominated and hence unusable.
| Quadrant | # 1 sec bins | Bins with >0 counts | Bins with >2000 counts | High rate bins dominated by noise | Noise dominated (total time) | Noise dominated (detector-on time) | Marked lightcurve |
|---|---|---|---|---|---|---|---|
| A | 8843 | 6251 | 11 | 11 | 0.12% | 0.18% | 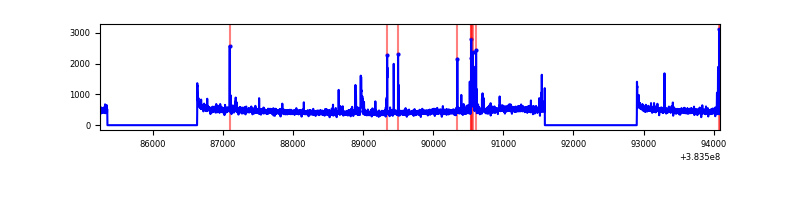 |
| B | 8843 | 6250 | 355 | 355 | 4.01% | 5.68% | 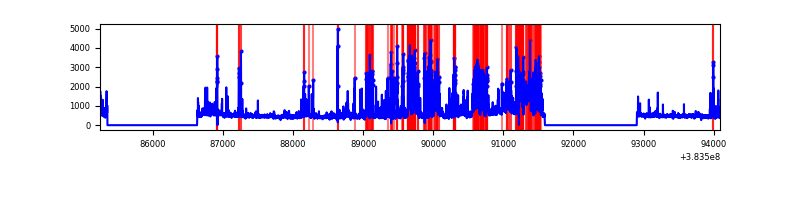 |
| C | 8843 | 6251 | 11 | 11 | 0.12% | 0.18% | 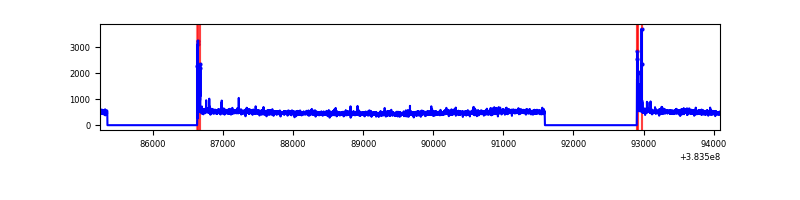 |
| D | 8843 | 6251 | 795 | 795 | 8.99% | 12.72% | 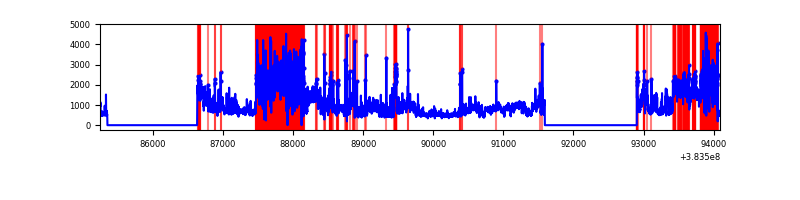 |
Top three noisy pixels from each quadrant. If the there are fewer than three noisy pixels in the level2.evt file, extra rows are filled as -1
| Pixel properties | Quadrant properties | ||||||
|---|---|---|---|---|---|---|---|
| Quadrant | DetID | PixID | Counts | Sigma | Mean | Median | Sigma |
| A | 15 | 174 | 89892 | 622.83 | 715 | 700 | 143.2 |
| A | 10 | 83 | 53120 | 366.05 | 715 | 700 | 143.2 |
| A | 9 | 143 | 43446 | 298.5 | 715 | 700 | 143.2 |
| B | 5 | 255 | 1057578 | 8049.72 | 683 | 667 | 131.3 |
| B | 5 | 172 | 875598 | 6663.71 | 683 | 667 | 131.3 |
| B | 0 | 190 | 70705 | 533.43 | 683 | 667 | 131.3 |
| C | 15 | 214 | 266259 | 1636.42 | 697 | 701 | 162.3 |
| C | 0 | 10 | 68864 | 420.03 | 697 | 701 | 162.3 |
| C | 14 | 67 | 38738 | 234.39 | 697 | 701 | 162.3 |
| D | 8 | 195 | 2049728 | 12701.72 | 657 | 637 | 161.3 |
| D | 7 | 38 | 1524271 | 9444.56 | 657 | 637 | 161.3 |
| D | 2 | 250 | 300721 | 1860.13 | 657 | 637 | 161.3 |
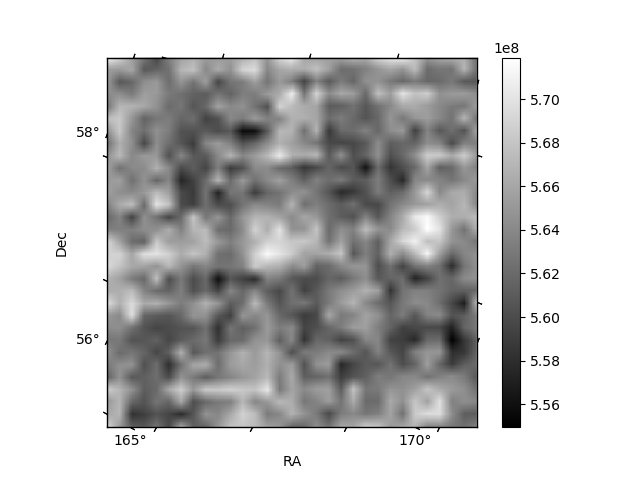
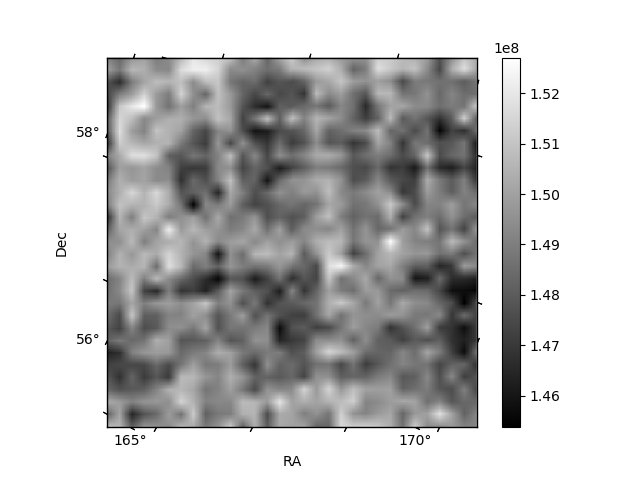
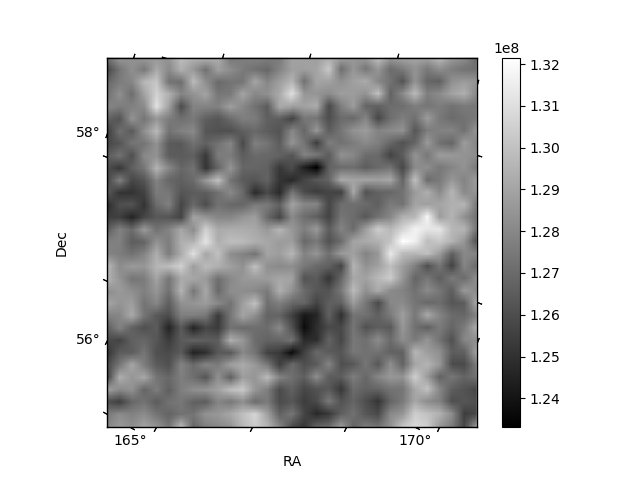
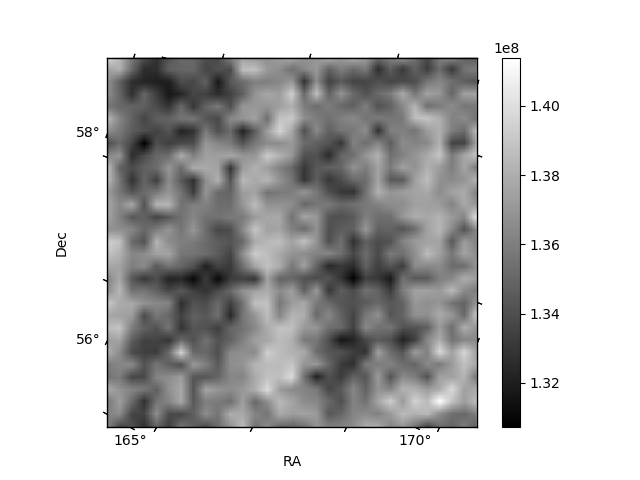
Histogram calculated using DETX and DETY for each event in the final _common_clean file
| Quadrant A | 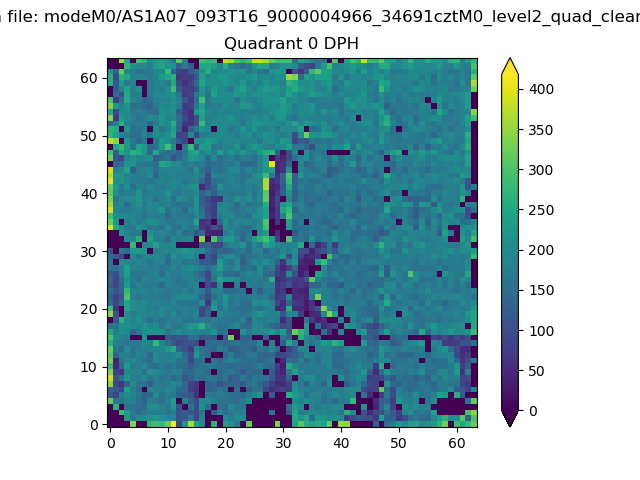 |
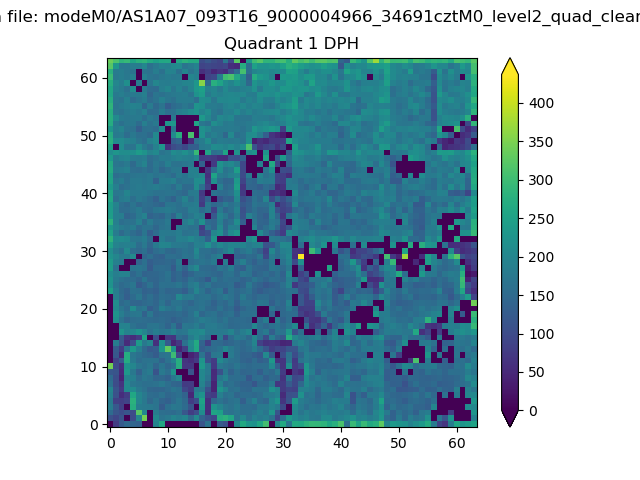 |
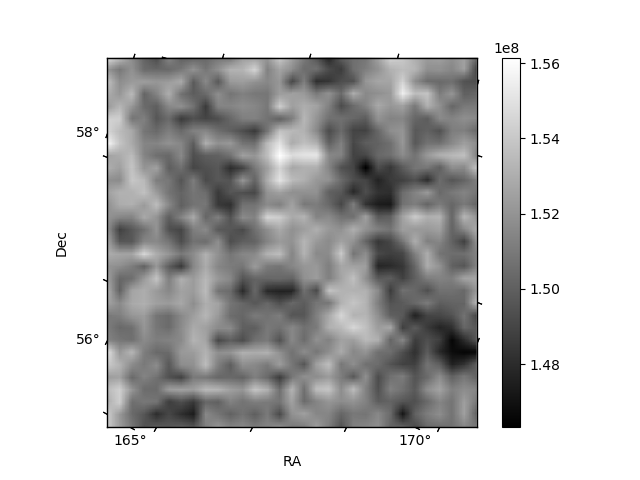
Quadrant B |
|---|---|---|---|
| Quadrant D | 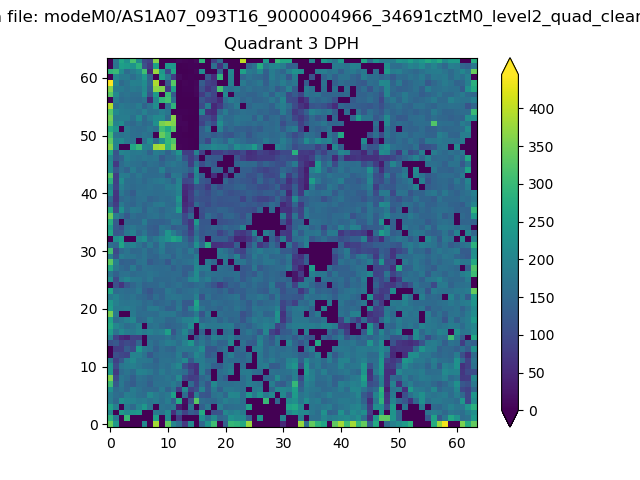 |
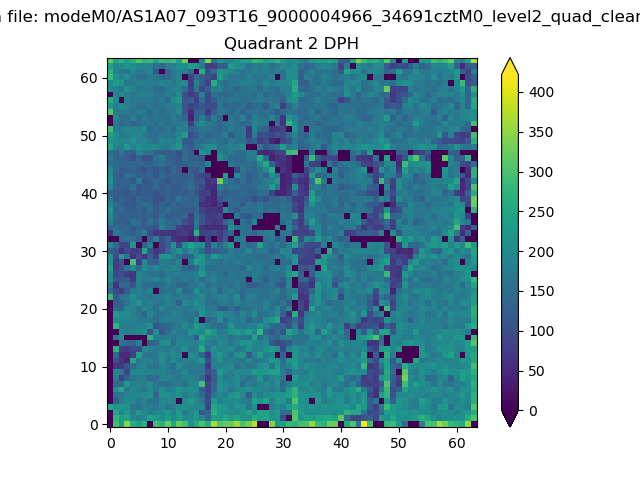 |
Quadrant C |
| Plot type | Count rate plots | Images |
|---|---|---|
| Comparison with Poisson distribution Blue bars denote a histogram of data divided into 1 sec bins. Red curve is a Poisson curve with rate = median count rate of data. |
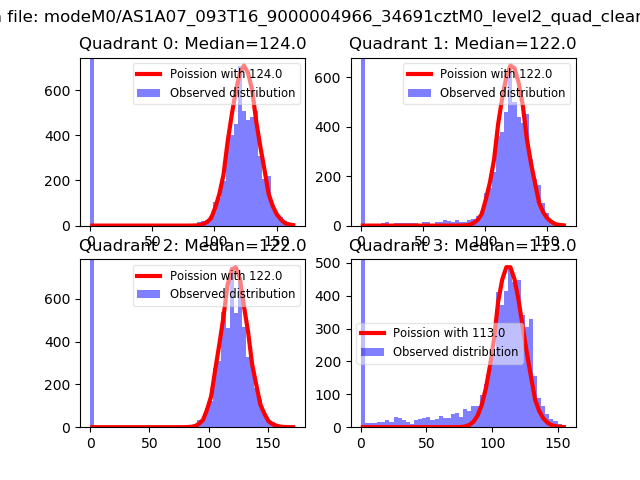 |
 |
| Quadrant-wise count rates Data is divided into 100 sec bins |
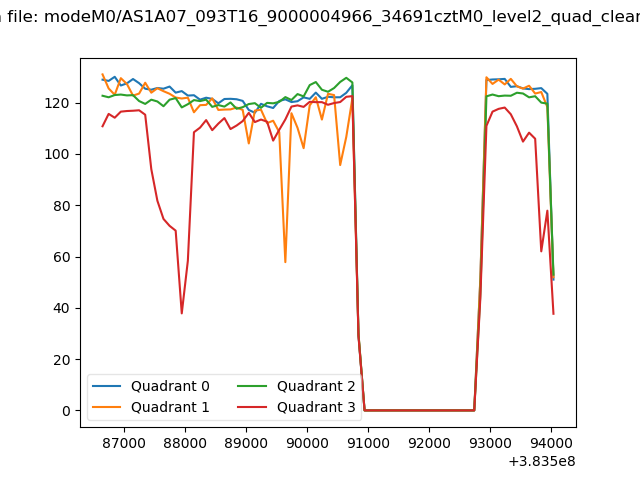 |
|
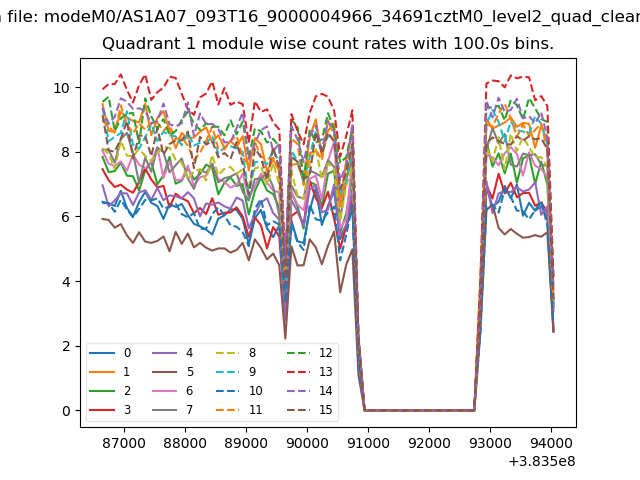
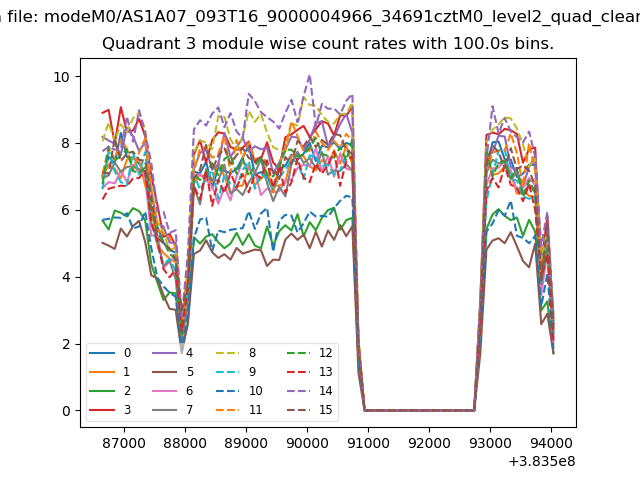
| Module-wise count rates for Quadrant A Data is divided into 100 sec bins |
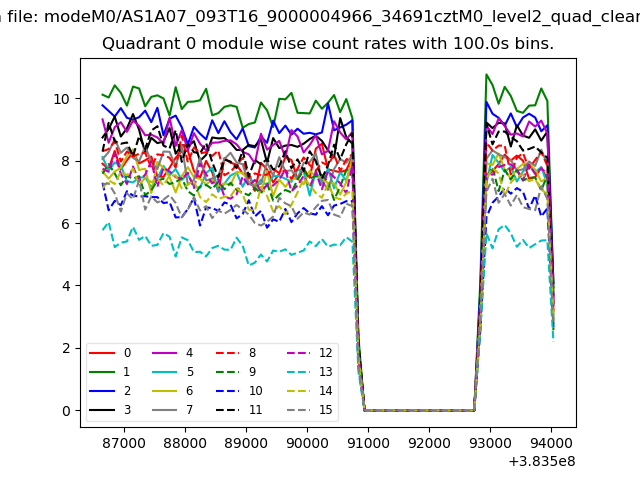 |
 |
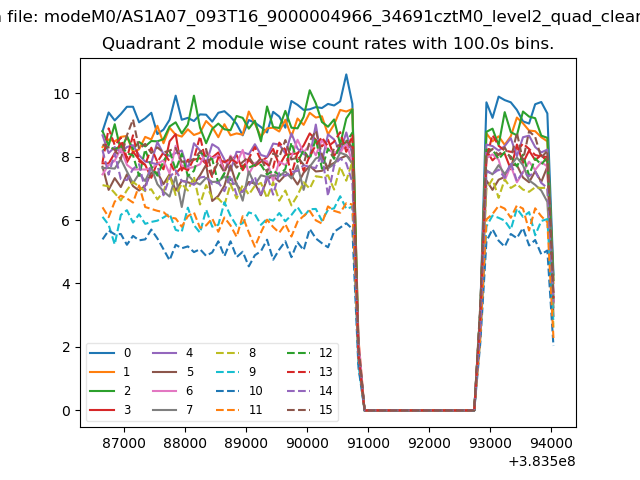
| Module-wise count rates for Quadrant B Data is divided into 100 sec bins |
 |
 |
| Module-wise count rates for Quadrant C Data is divided into 100 sec bins |
 |
 |
| Module-wise count rates for Quadrant D Data is divided into 100 sec bins |
 |
 |
| Parameter | Plot |
|---|---|
| CZT HV Monitor | 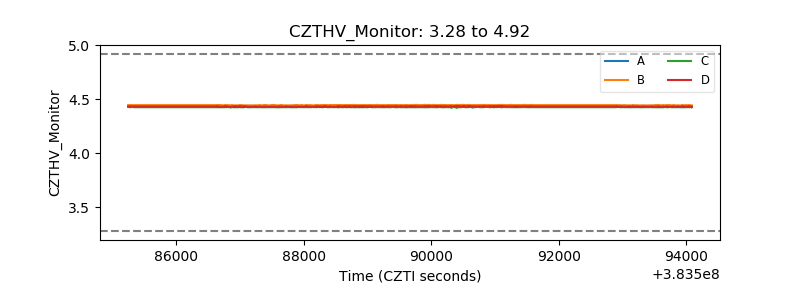 |
| D_VDD | 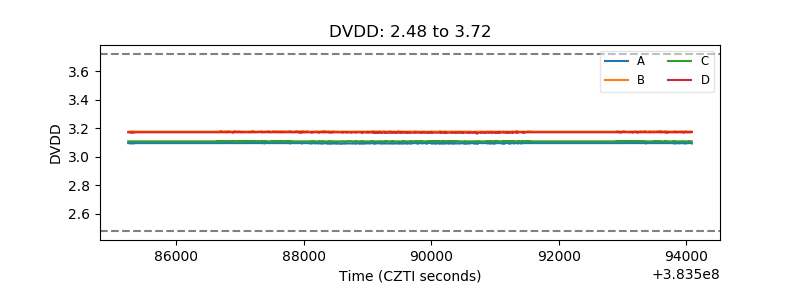 |
| Temperature 1 | 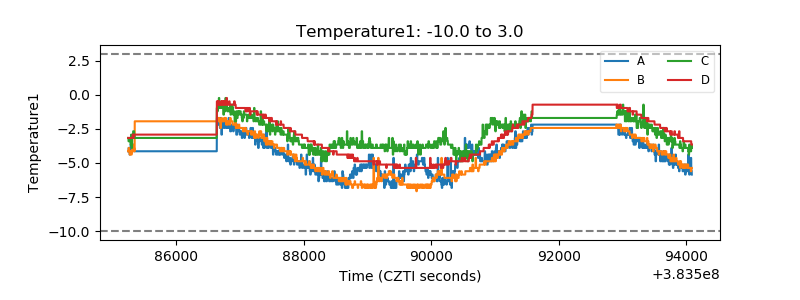 |
| Veto HV Monitor | 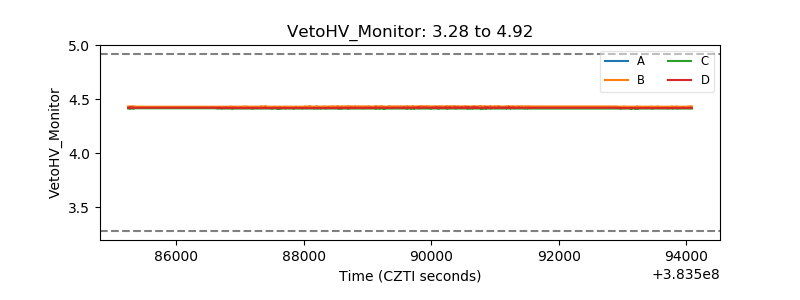 |
| Veto LLD | 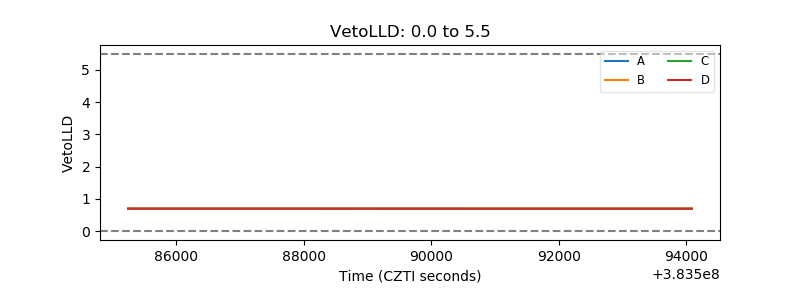 |
| Alpha Counter | 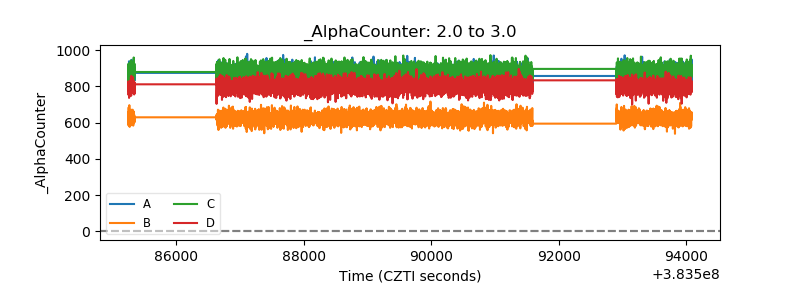 |
| _CPM_Rate | 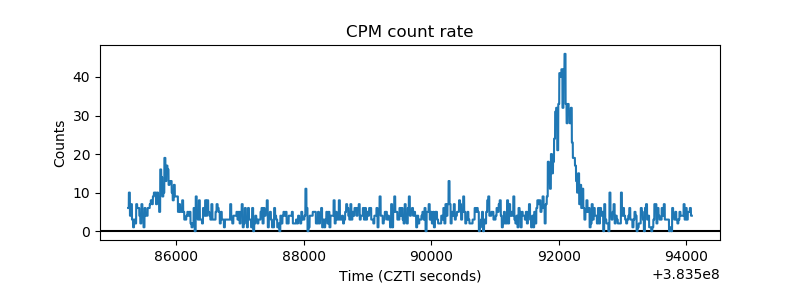 |
| CZT Counter | 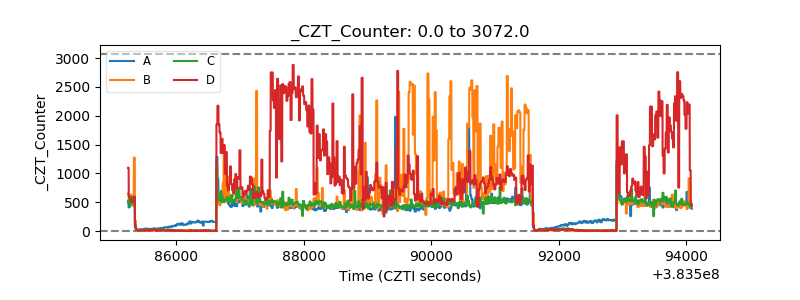 |
| +2.5 Volts monitor | 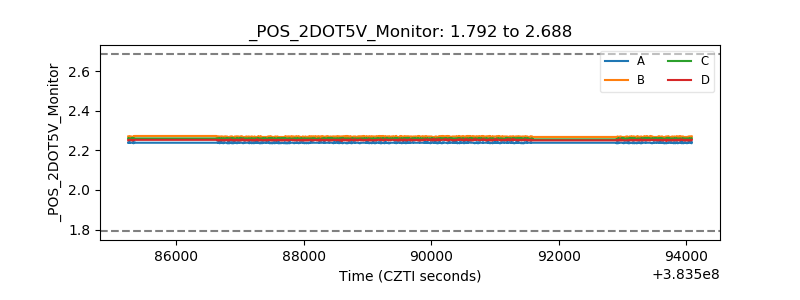 |
| +5 Volts monitor | 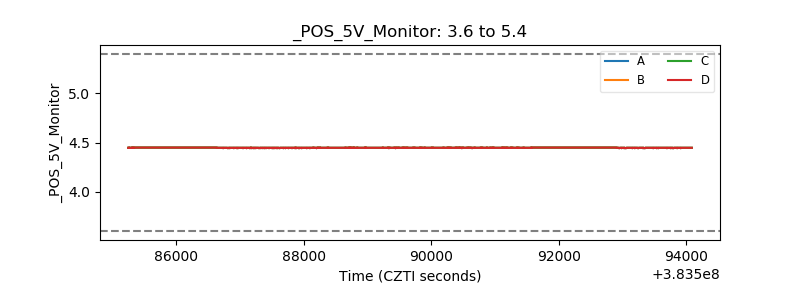 |
| _ROLL_ROT | 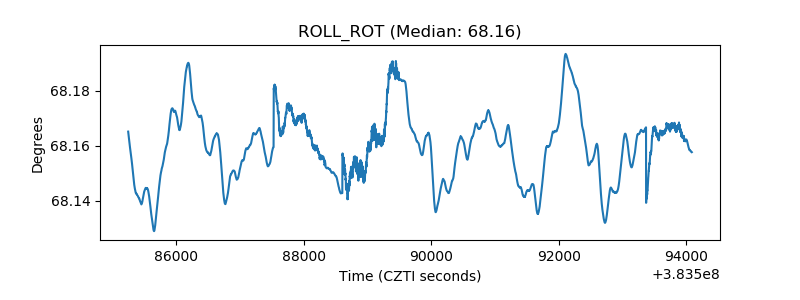 |
| _Roll_DEC | 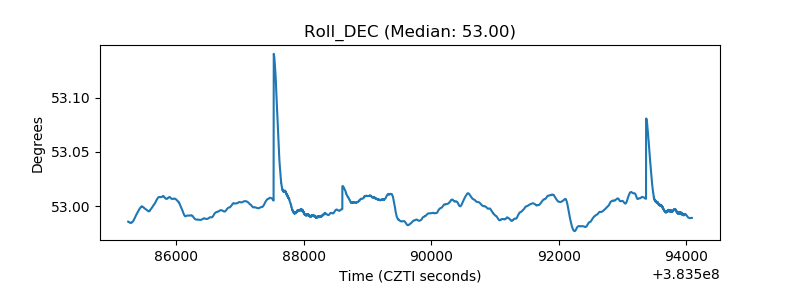 |
| _Roll_RA | 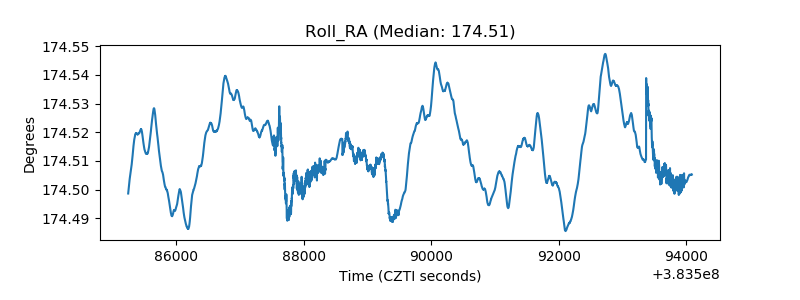 |
| Veto Counter | 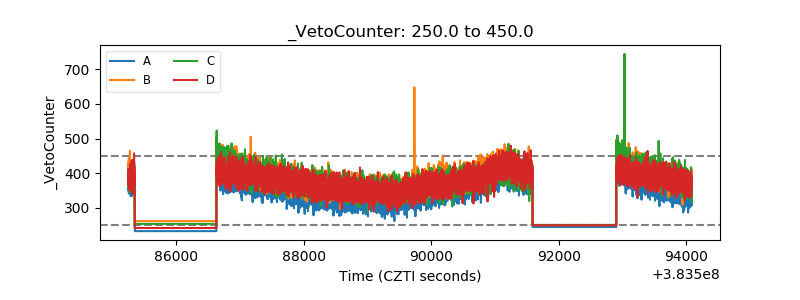 |