| Param | Original file | Final file |
|---|---|---|
| Filename | modeM0/AS1A07_093T16_9000004966_34688cztM0_level2.evt | modeM0/AS1A07_093T16_9000004966_34688cztM0_level2_quad_clean.evt |
| Size (bytes) | 299,545,920 | 57,755,520 |
| Size | 285.7 MB | 55.1 MB |
| Events in quadrant A | 1,643,070 | 386,880 |
| Events in quadrant B | 2,142,101 | 381,604 |
| Events in quadrant C | 1,709,597 | 381,988 |
| Events in quadrant D | 3,343,710 | 355,763 |
| Mode M0 | |||
|---|---|---|---|
| Quadrant | BADHDUFLAG | Total packets | Discarded packets |
| A | 0 | 7079 | 2 |
| B | 0 | 8590 | 1 |
| C | 0 | 7083 | 1 |
| D | 0 | 12263 | 1 |
| Mode M9 | |||
|---|---|---|---|
| Quadrant | BADHDUFLAG | Total packets | Discarded packets |
| A | 0 | 13 | 0 |
| B | 0 | 13 | 0 |
| C | 0 | 13 | 0 |
| D | 0 | 13 | 0 |
| Mode SS | |||
|---|---|---|---|
| Quadrant | BADHDUFLAG | Total packets | Discarded packets |
| A | 0 | 70 | 0 |
| B | 0 | 70 | 0 |
| C | 0 | 70 | 0 |
| D | 0 | 70 | 0 |
| Quadrant | Total seconds | Saturated seconds | Saturation percentage |
|---|---|---|---|
| A | 3422 | 6 | 0.175336% |
| B | 3422 | 133 | 3.886616% |
| C | 3422 | 13 | 0.379895% |
| D | 3422 | 155 | 4.529515% |
Noise dominated data is calculated using 1-second bins in cleaned event files. If a bin has >2000 counts, and if more than 50% of those come from <1% of pixels, then it is considered to be noise-dominated and hence unusable.
| Quadrant | # 1 sec bins | Bins with >0 counts | Bins with >2000 counts | High rate bins dominated by noise | Noise dominated (total time) | Noise dominated (detector-on time) | Marked lightcurve |
|---|---|---|---|---|---|---|---|
| A | 4703 | 3423 | 1 | 1 | 0.02% | 0.03% | 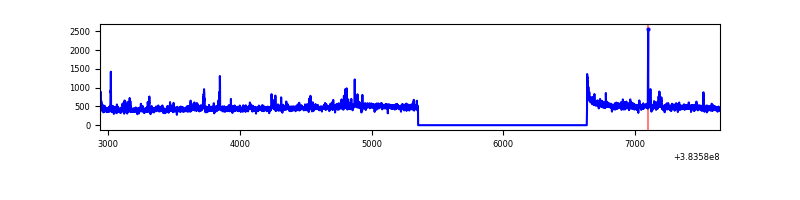 |
| B | 4703 | 3422 | 81 | 81 | 1.72% | 2.37% | 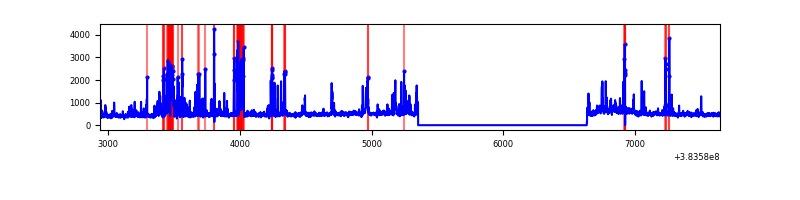 |
| C | 4703 | 3423 | 10 | 10 | 0.21% | 0.29% | 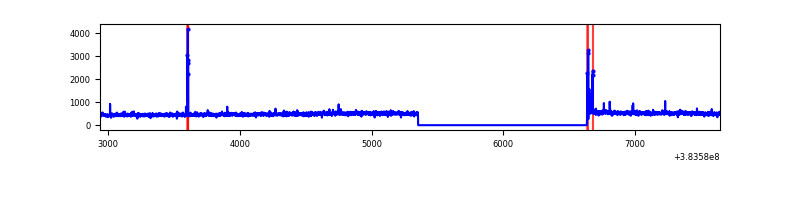 |
| D | 4703 | 3423 | 145 | 145 | 3.08% | 4.24% | 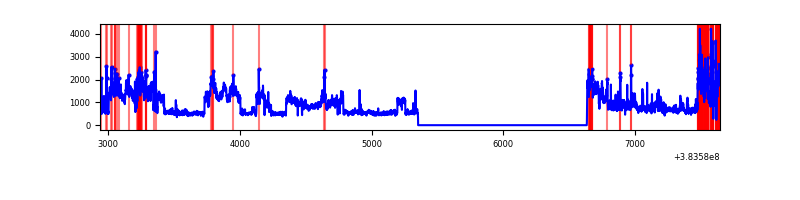 |
Top three noisy pixels from each quadrant. If the there are fewer than three noisy pixels in the level2.evt file, extra rows are filled as -1
| Pixel properties | Quadrant properties | ||||||
|---|---|---|---|---|---|---|---|
| Quadrant | DetID | PixID | Counts | Sigma | Mean | Median | Sigma |
| A | 14 | 250 | 28743 | 349.55 | 396 | 387 | 81.1 |
| A | 10 | 83 | 26466 | 321.48 | 396 | 387 | 81.1 |
| A | 15 | 174 | 19601 | 236.86 | 396 | 387 | 81.1 |
| B | 5 | 172 | 382095 | 4964.34 | 389 | 378 | 76.9 |
| B | 5 | 255 | 126823 | 1644.45 | 389 | 378 | 76.9 |
| B | 0 | 190 | 53432 | 689.98 | 389 | 378 | 76.9 |
| C | 15 | 214 | 144053 | 1591.95 | 383 | 383 | 90.2 |
| C | 0 | 10 | 24745 | 269.95 | 383 | 383 | 90.2 |
| C | 15 | 208 | 23126 | 252.01 | 383 | 383 | 90.2 |
| D | 8 | 195 | 1407958 | 14479.9 | 374 | 365 | 97.2 |
| D | 7 | 38 | 181831 | 1866.74 | 374 | 365 | 97.2 |
| D | 2 | 250 | 103761 | 1063.63 | 374 | 365 | 97.2 |
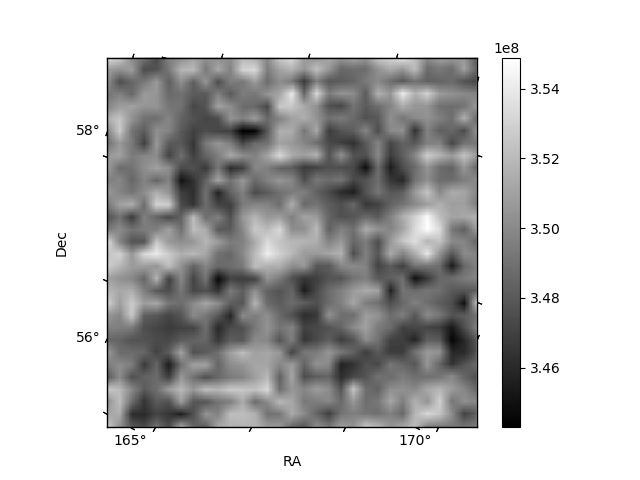
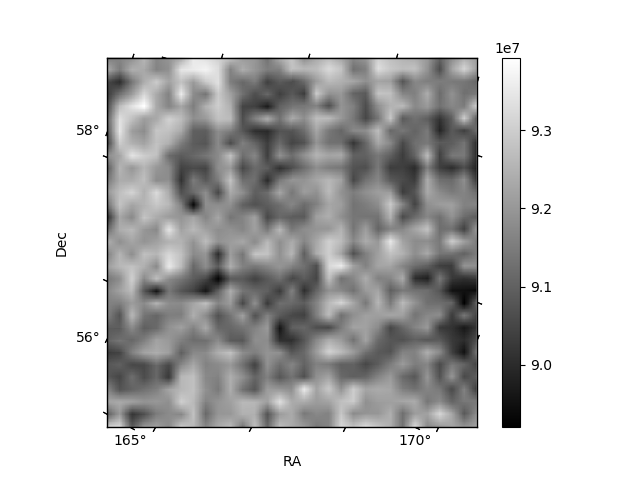
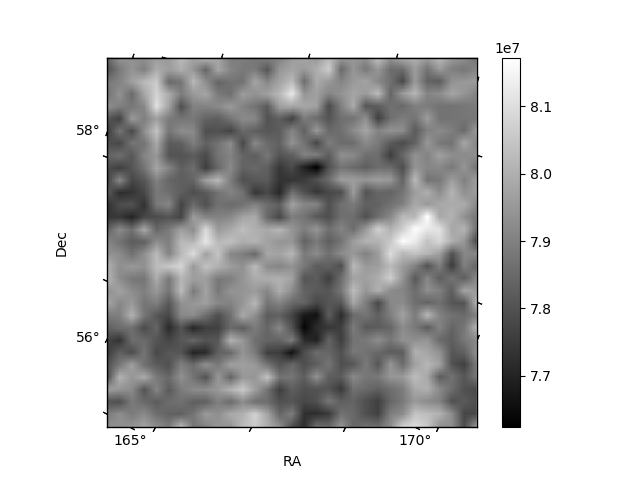
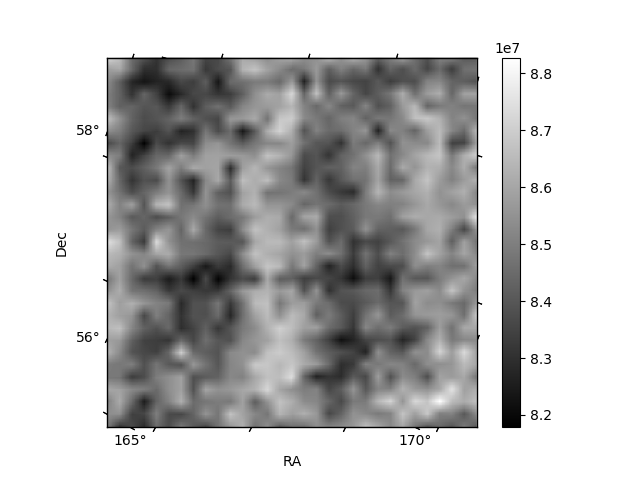
Histogram calculated using DETX and DETY for each event in the final _common_clean file
| Quadrant A | 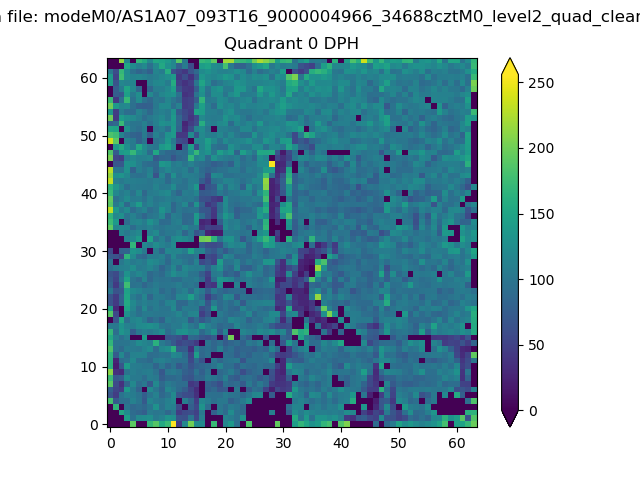 |
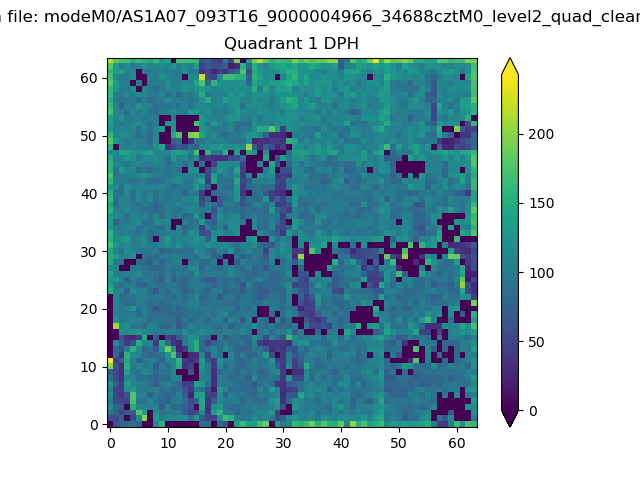 |
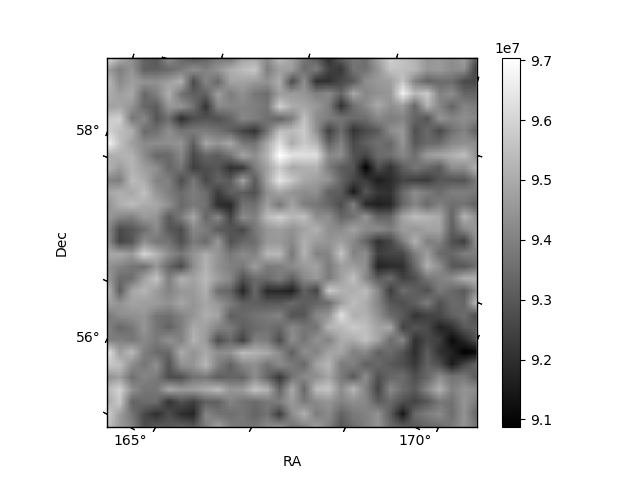
Quadrant B |
|---|---|---|---|
| Quadrant D | 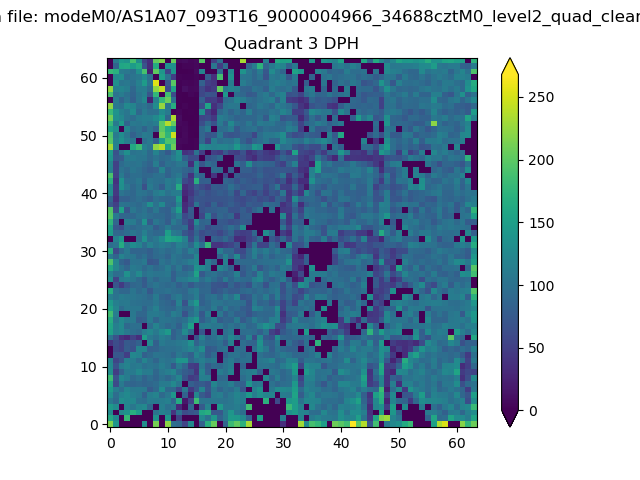 |
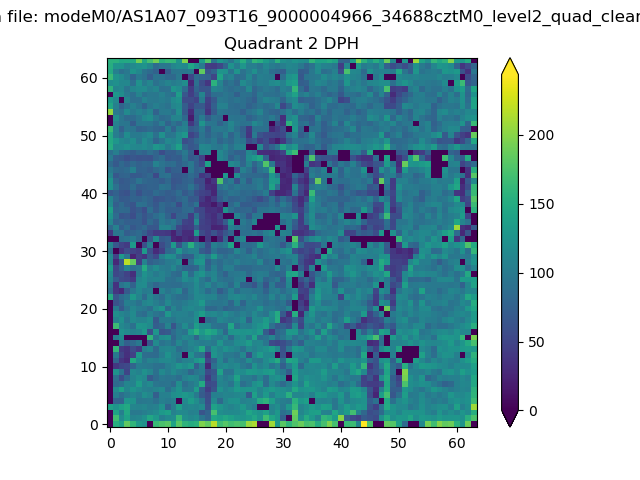 |
Quadrant C |
| Plot type | Count rate plots | Images |
|---|---|---|
| Comparison with Poisson distribution Blue bars denote a histogram of data divided into 1 sec bins. Red curve is a Poisson curve with rate = median count rate of data. |
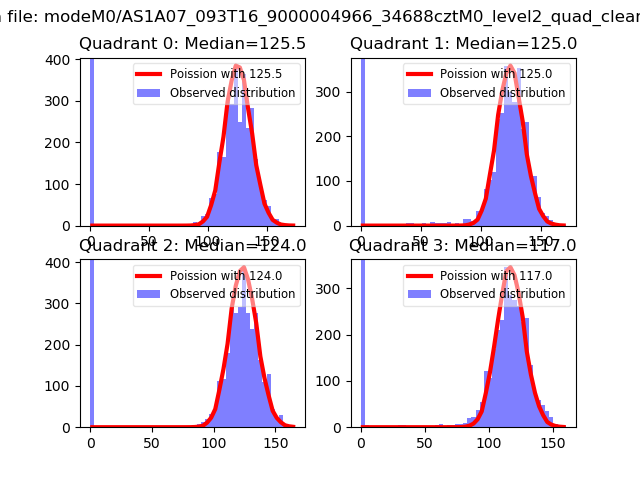 |
 |
| Quadrant-wise count rates Data is divided into 100 sec bins |
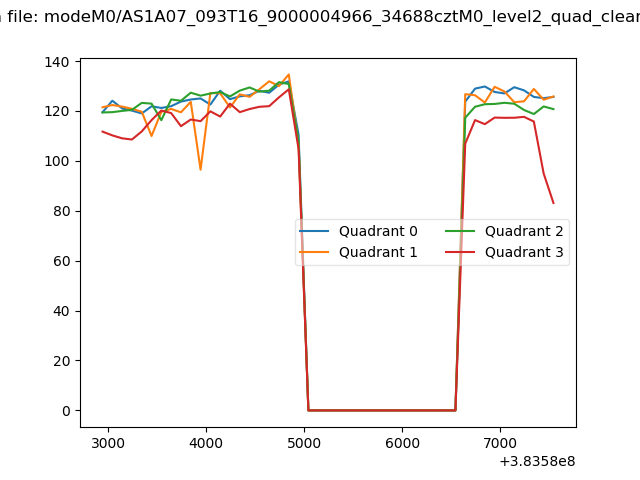 |
|
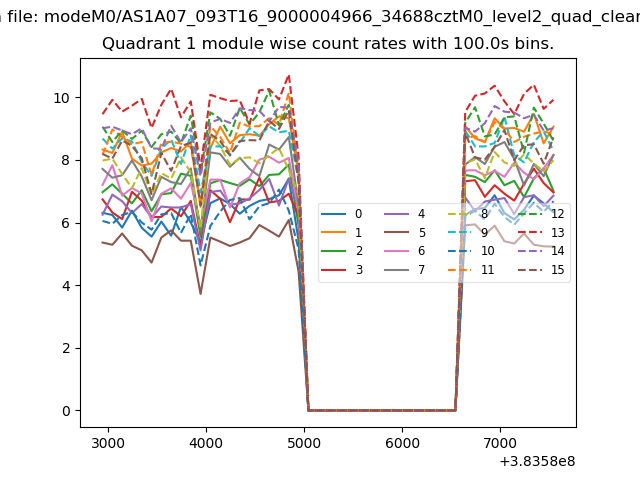
| Module-wise count rates for Quadrant A Data is divided into 100 sec bins |
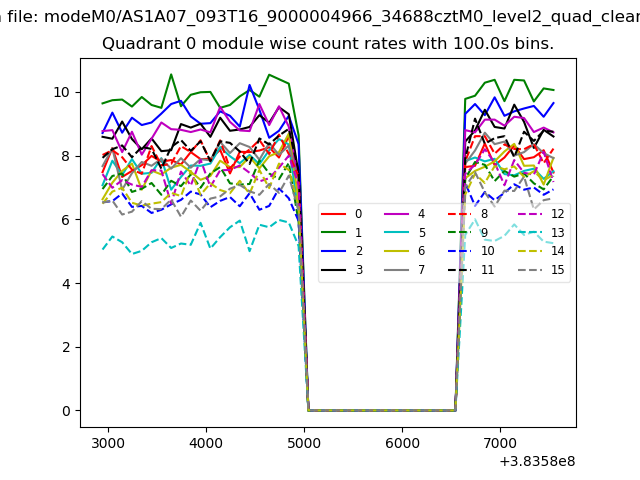 |
 |
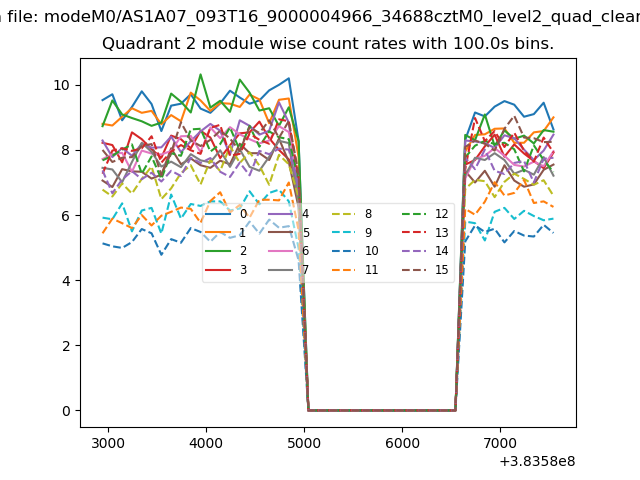
| Module-wise count rates for Quadrant B Data is divided into 100 sec bins |
 |
 |
| Module-wise count rates for Quadrant C Data is divided into 100 sec bins |
 |
 |
| Module-wise count rates for Quadrant D Data is divided into 100 sec bins |
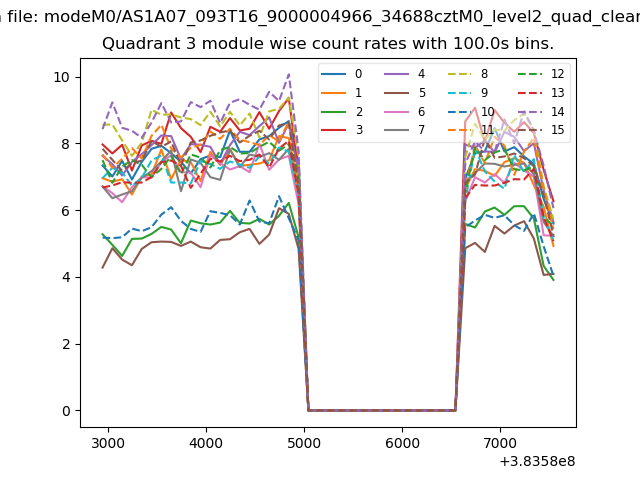 |
 |
| Parameter | Plot |
|---|---|
| CZT HV Monitor | 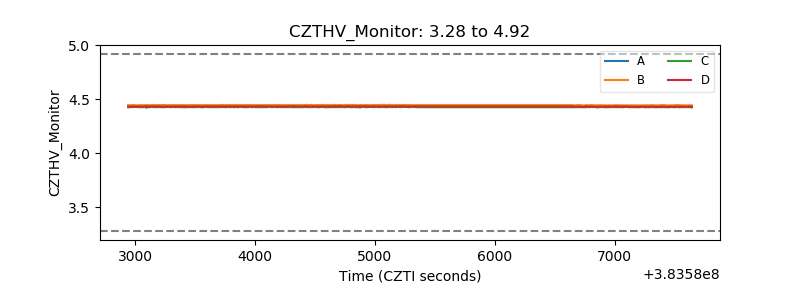 |
| D_VDD | 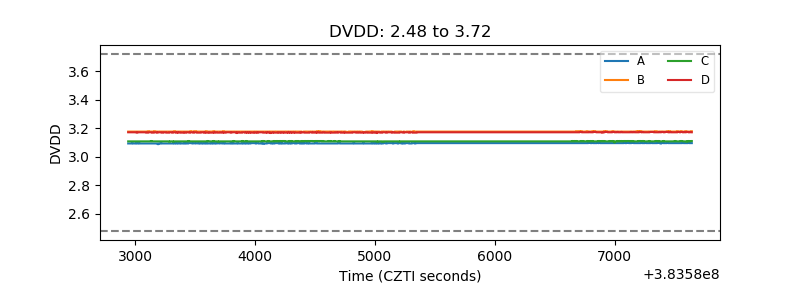 |
| Temperature 1 | 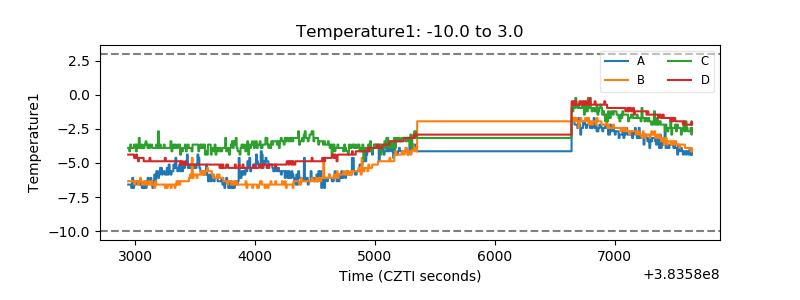 |
| Veto HV Monitor | 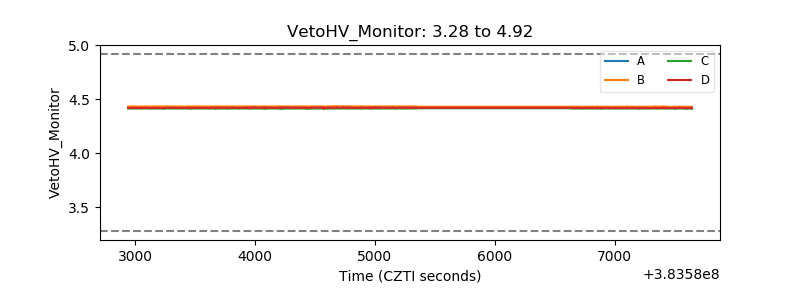 |
| Veto LLD | 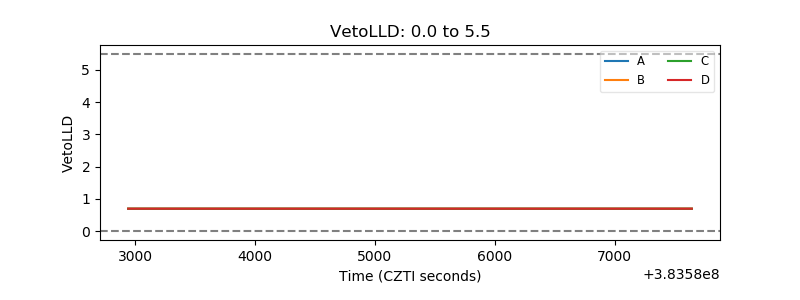 |
| Alpha Counter | 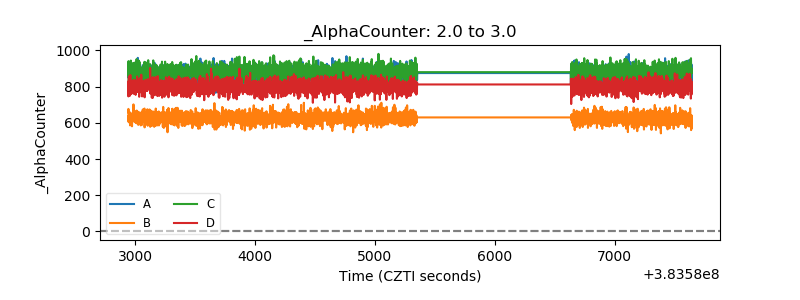 |
| _CPM_Rate | 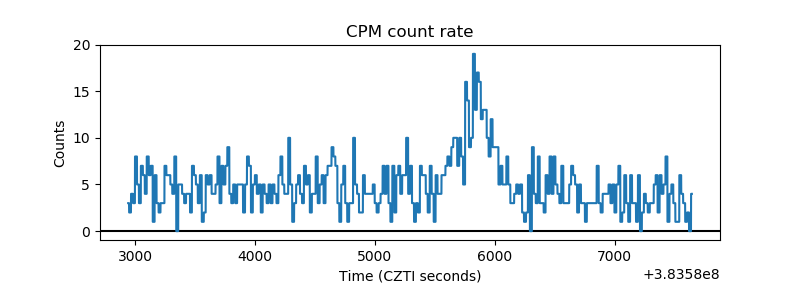 |
| CZT Counter | 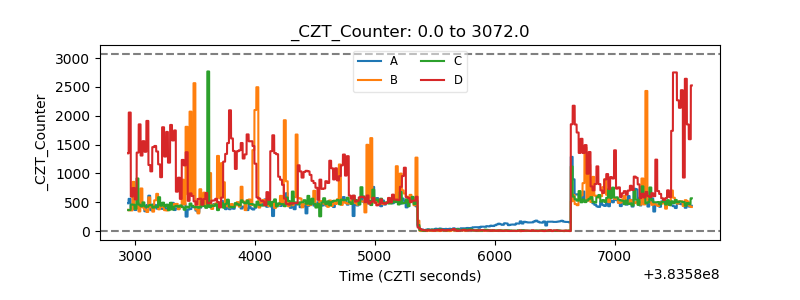 |
| +2.5 Volts monitor | 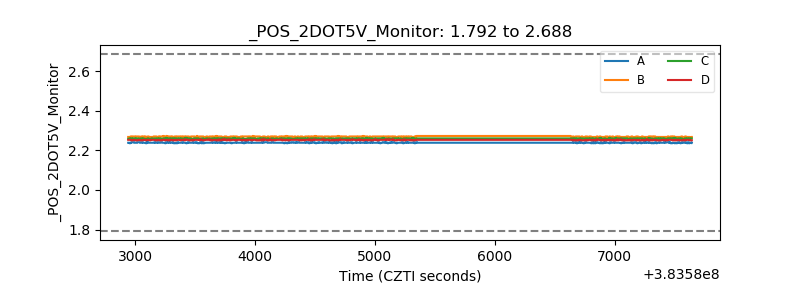 |
| +5 Volts monitor | 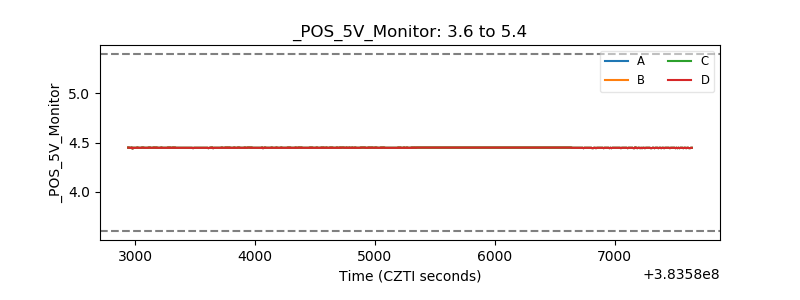 |
| _ROLL_ROT | 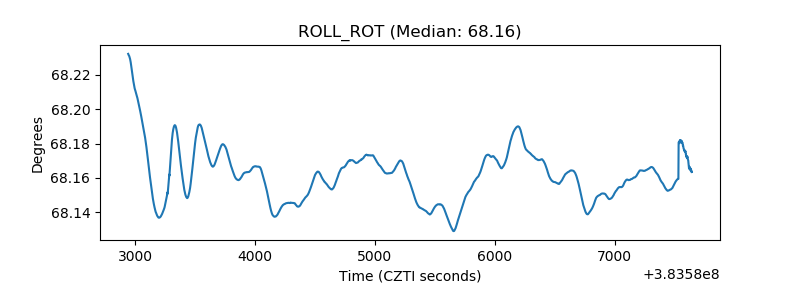 |
| _Roll_DEC | 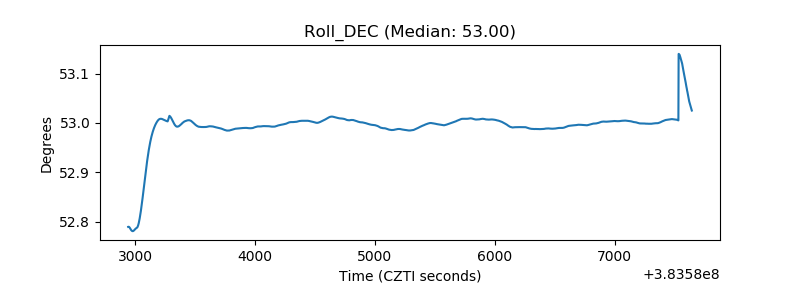 |
| _Roll_RA | 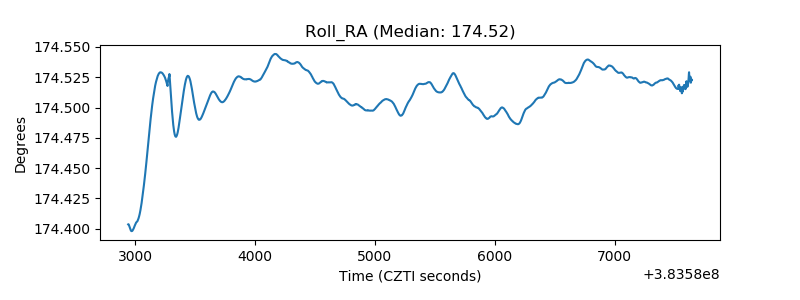 |
| Veto Counter | 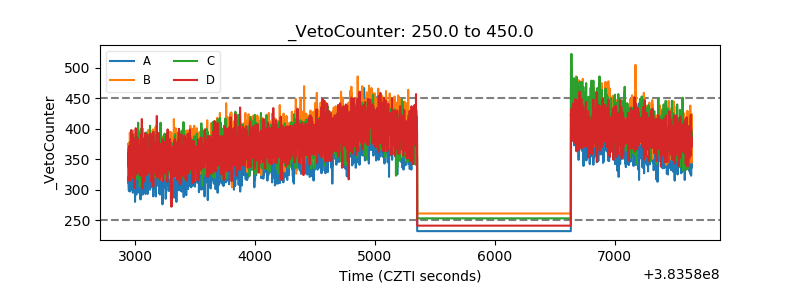 |