| Param | Original file | Final file |
|---|---|---|
| Filename | modeM0/AS1A07_093T11_9000004964_34688cztM0_level2.evt | modeM0/AS1A07_093T11_9000004964_34688cztM0_level2_quad_clean.evt |
| Size (bytes) | 211,043,520 | 38,652,480 |
| Size | 201.3 MB | 36.9 MB |
| Events in quadrant A | 1,030,628 | 267,127 |
| Events in quadrant B | 1,259,941 | 266,626 |
| Events in quadrant C | 1,124,968 | 257,959 |
| Events in quadrant D | 2,828,398 | 223,065 |
| Mode M9 | |||
|---|---|---|---|
| Quadrant | BADHDUFLAG | Total packets | Discarded packets |
| A | 0 | 1 | 0 |
| B | 0 | 1 | 0 |
| C | 0 | 1 | 0 |
| D | 0 | 2 | 0 |
| Mode M0 | |||
|---|---|---|---|
| Quadrant | BADHDUFLAG | Total packets | Discarded packets |
| A | 0 | 4461 | 1 |
| B | 0 | 5134 | 1 |
| C | 0 | 4578 | 1 |
| D | 0 | 9906 | 1 |
| Mode SS | |||
|---|---|---|---|
| Quadrant | BADHDUFLAG | Total packets | Discarded packets |
| A | 0 | 42 | 0 |
| B | 0 | 42 | 0 |
| C | 0 | 42 | 0 |
| D | 0 | 42 | 0 |
| Quadrant | Total seconds | Saturated seconds | Saturation percentage |
|---|---|---|---|
| A | 2147 | 9 | 0.419190% |
| B | 2147 | 65 | 3.027480% |
| C | 2147 | 15 | 0.698649% |
| D | 2147 | 436 | 20.307406% |
Noise dominated data is calculated using 1-second bins in cleaned event files. If a bin has >2000 counts, and if more than 50% of those come from <1% of pixels, then it is considered to be noise-dominated and hence unusable.
| Quadrant | # 1 sec bins | Bins with >0 counts | Bins with >2000 counts | High rate bins dominated by noise | Noise dominated (total time) | Noise dominated (detector-on time) | Marked lightcurve |
|---|---|---|---|---|---|---|---|
| A | 2147 | 2147 | 4 | 4 | 0.19% | 0.19% | 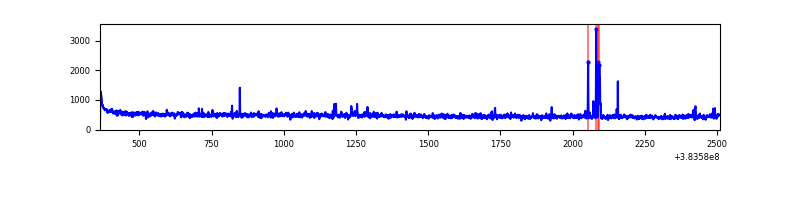 |
| B | 2147 | 2147 | 45 | 45 | 2.10% | 2.10% | 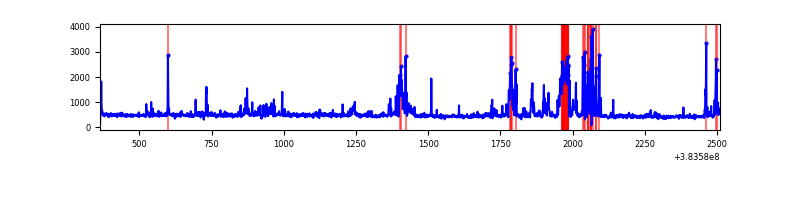 |
| C | 2147 | 2147 | 9 | 9 | 0.42% | 0.42% | 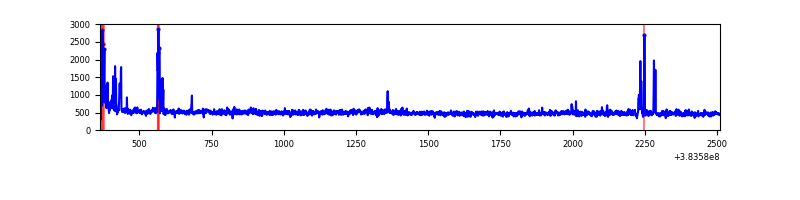 |
| D | 2147 | 2147 | 378 | 378 | 17.61% | 17.61% | 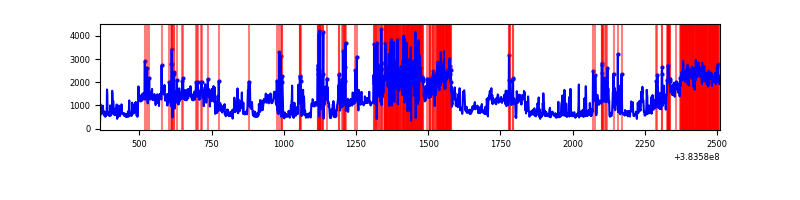 |
Top three noisy pixels from each quadrant. If the there are fewer than three noisy pixels in the level2.evt file, extra rows are filled as -1
| Pixel properties | Quadrant properties | ||||||
|---|---|---|---|---|---|---|---|
| Quadrant | DetID | PixID | Counts | Sigma | Mean | Median | Sigma |
| A | 9 | 143 | 31143 | 603.63 | 247 | 242 | 51.2 |
| A | 10 | 83 | 24361 | 471.15 | 247 | 242 | 51.2 |
| A | 14 | 174 | 4519 | 83.55 | 247 | 242 | 51.2 |
| B | 4 | 171 | 173993 | 3680.13 | 241 | 235 | 47.2 |
| B | 5 | 255 | 68347 | 1442.59 | 241 | 235 | 47.2 |
| B | 5 | 172 | 55720 | 1175.15 | 241 | 235 | 47.2 |
| C | 15 | 214 | 94254 | 1626.23 | 239 | 239 | 57.8 |
| C | 15 | 208 | 40505 | 696.5 | 239 | 239 | 57.8 |
| C | 0 | 10 | 31422 | 539.39 | 239 | 239 | 57.8 |
| D | 8 | 195 | 908149 | 15824.88 | 222 | 217 | 57.4 |
| D | 2 | 250 | 475075 | 8276.58 | 222 | 217 | 57.4 |
| D | 7 | 38 | 289156 | 5036.09 | 222 | 217 | 57.4 |
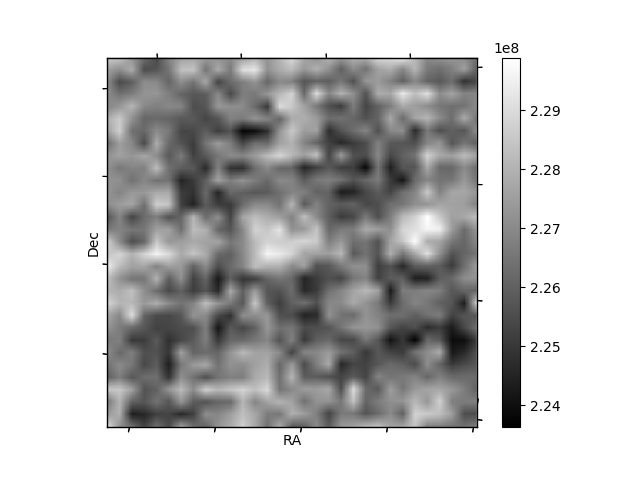
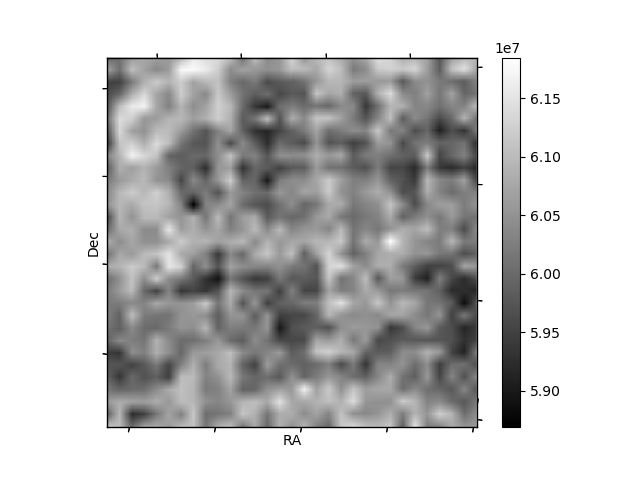
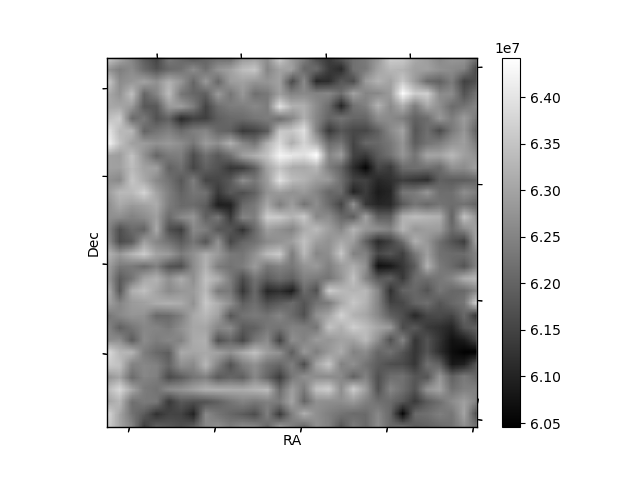
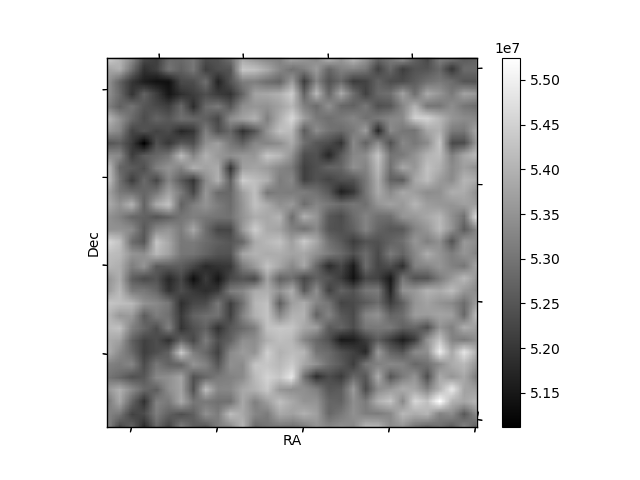
Histogram calculated using DETX and DETY for each event in the final _common_clean file
| Quadrant A | 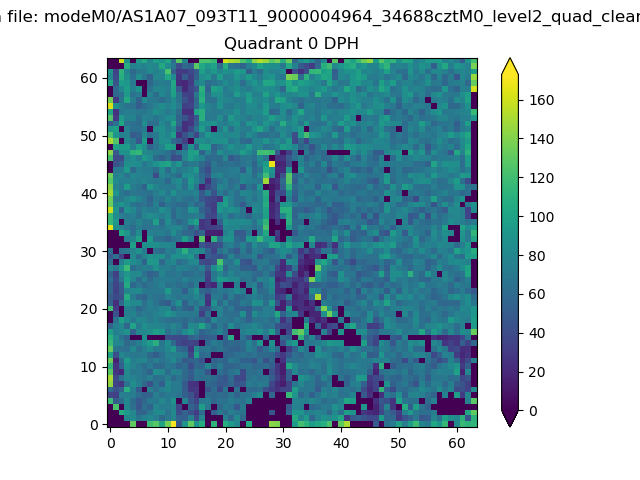 |
 |
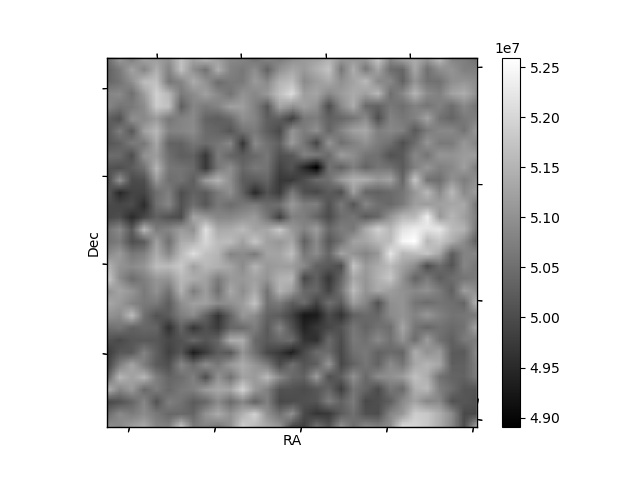
Quadrant B |
|---|---|---|---|
| Quadrant D | 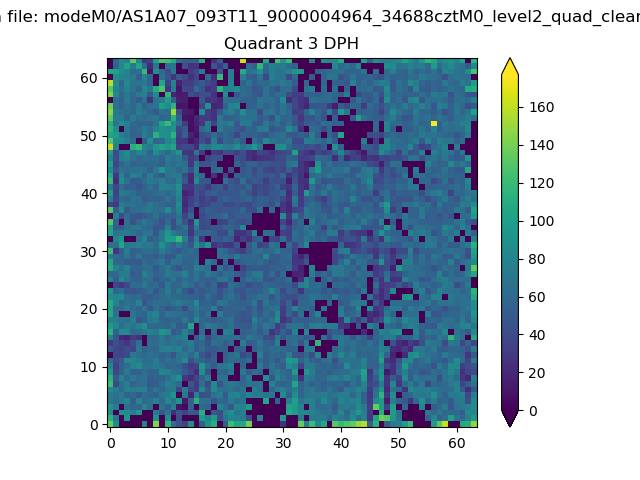 |
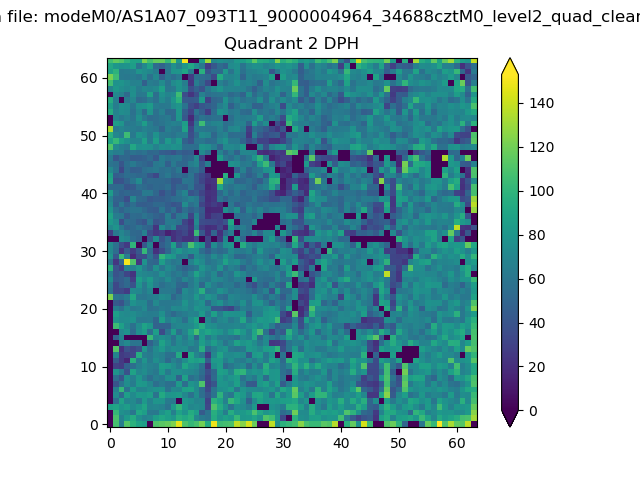 |
Quadrant C |
| Plot type | Count rate plots | Images |
|---|---|---|
| Comparison with Poisson distribution Blue bars denote a histogram of data divided into 1 sec bins. Red curve is a Poisson curve with rate = median count rate of data. |
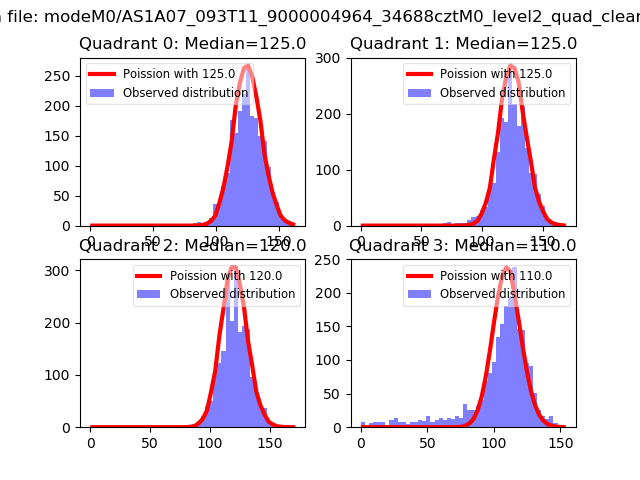 |
 |
| Quadrant-wise count rates Data is divided into 100 sec bins |
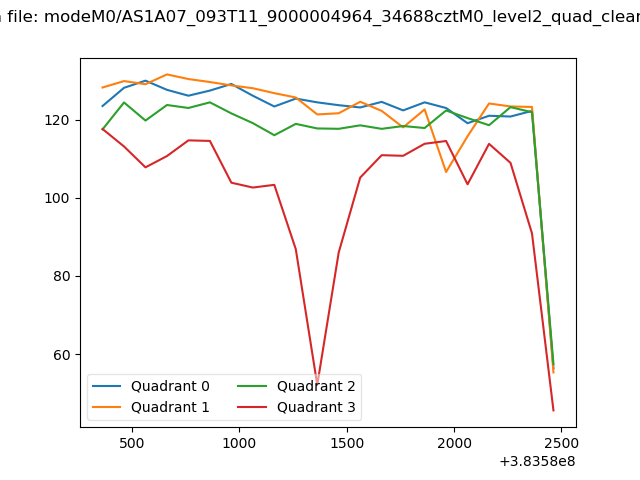 |
|
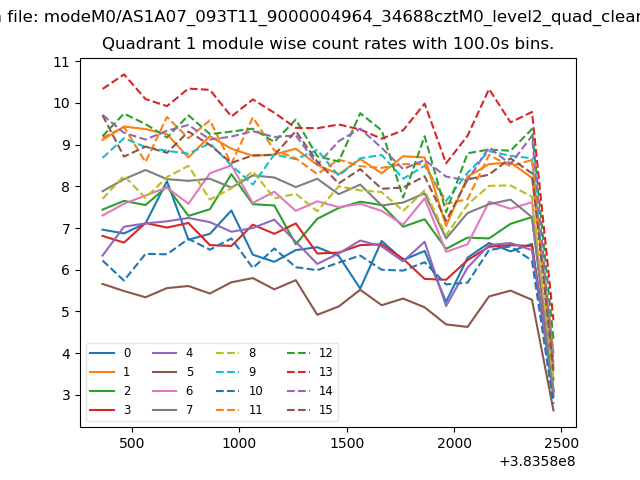
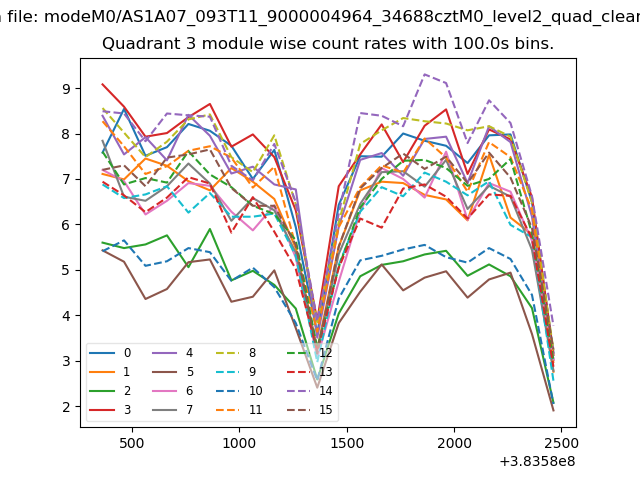
| Module-wise count rates for Quadrant A Data is divided into 100 sec bins |
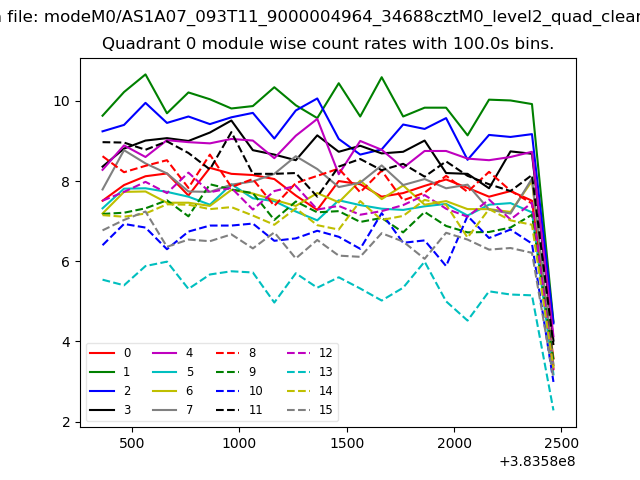 |
 |
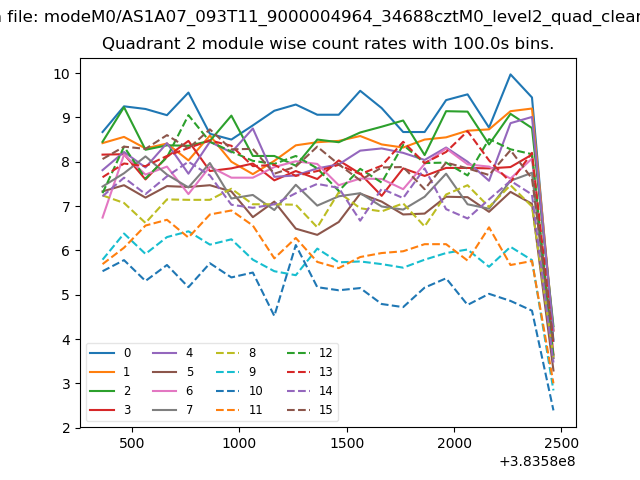
| Module-wise count rates for Quadrant B Data is divided into 100 sec bins |
 |
 |
| Module-wise count rates for Quadrant C Data is divided into 100 sec bins |
 |
 |
| Module-wise count rates for Quadrant D Data is divided into 100 sec bins |
 |
 |
| Parameter | Plot |
|---|---|
| CZT HV Monitor | 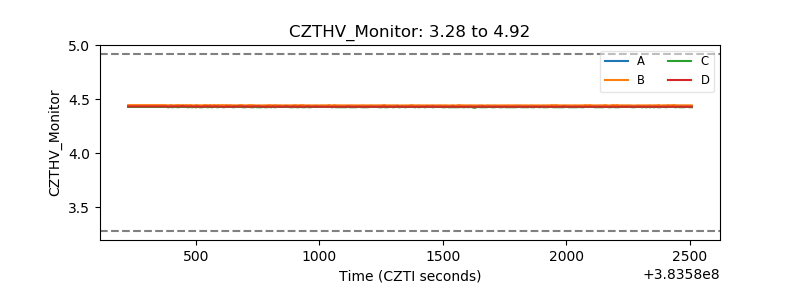 |
| D_VDD | 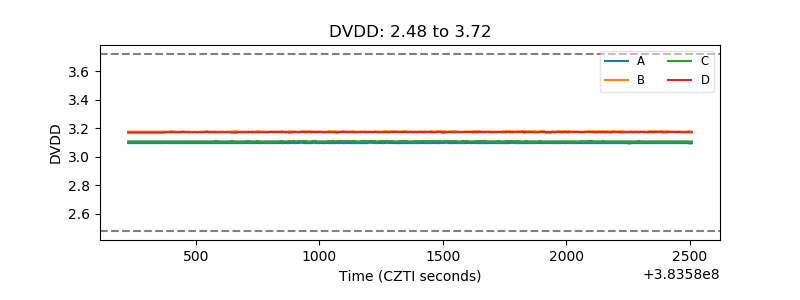 |
| Temperature 1 | 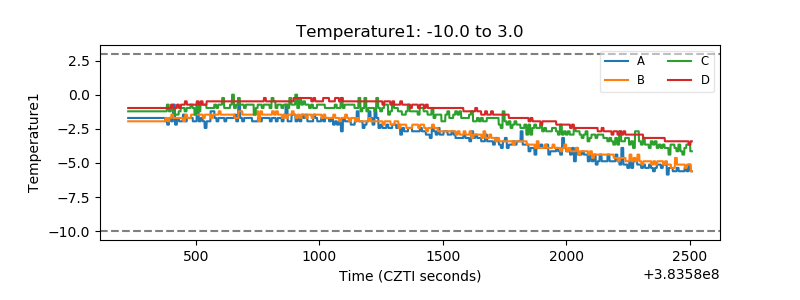 |
| Veto HV Monitor | 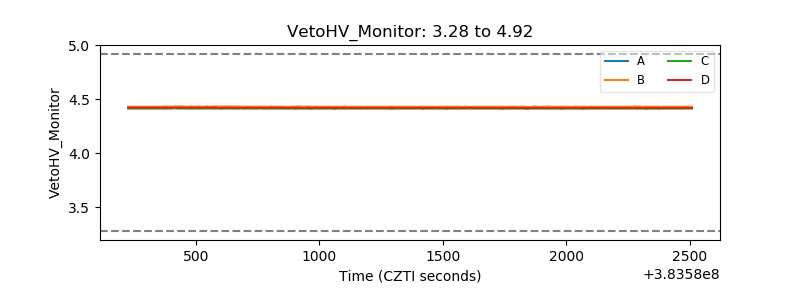 |
| Veto LLD | 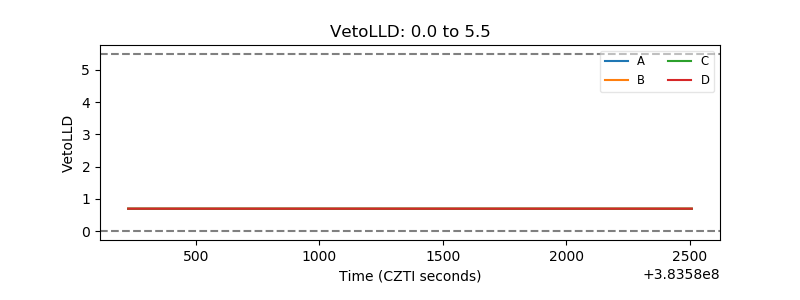 |
| Alpha Counter | 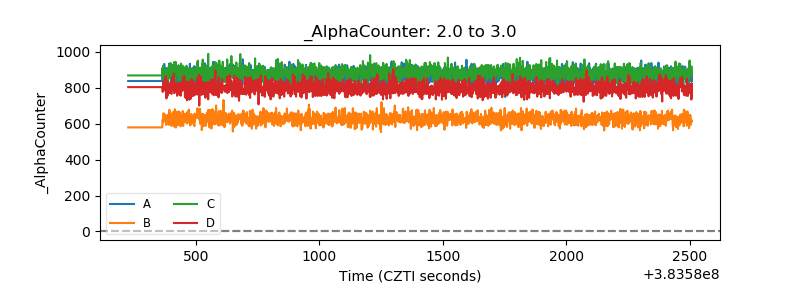 |
| _CPM_Rate | 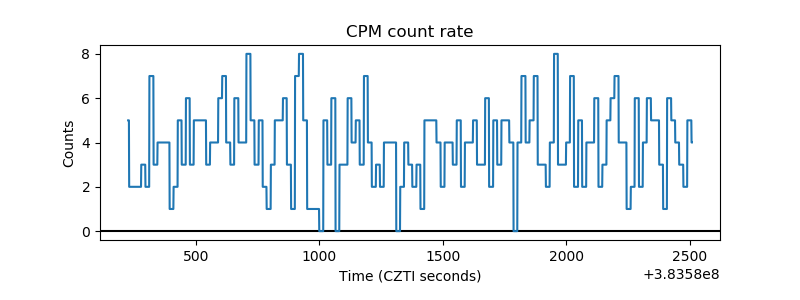 |
| CZT Counter | 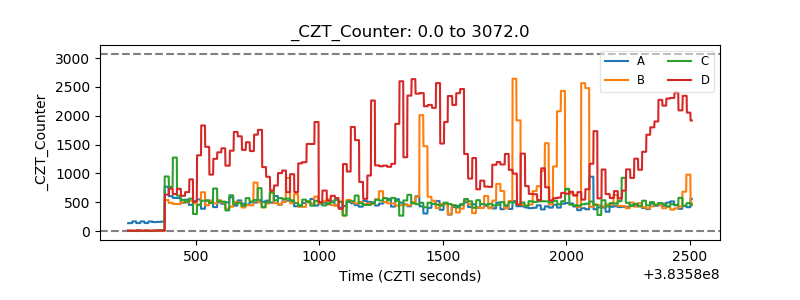 |
| +2.5 Volts monitor | 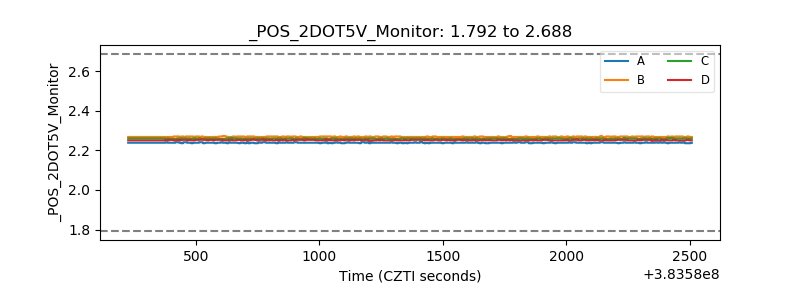 |
| +5 Volts monitor | 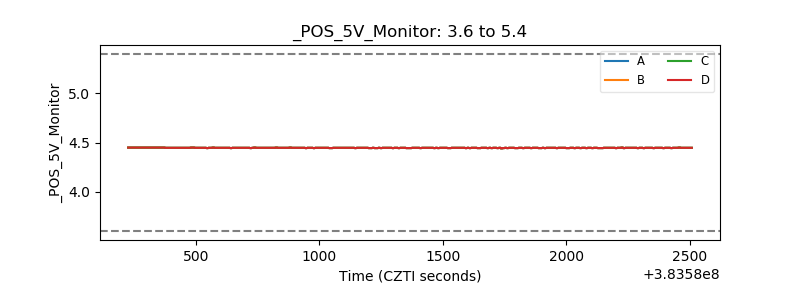 |
| _ROLL_ROT | 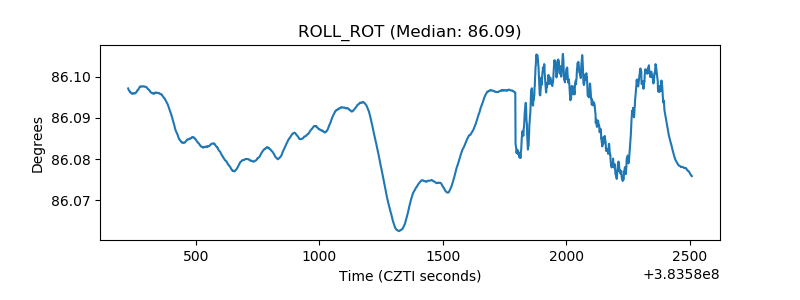 |
| _Roll_DEC | 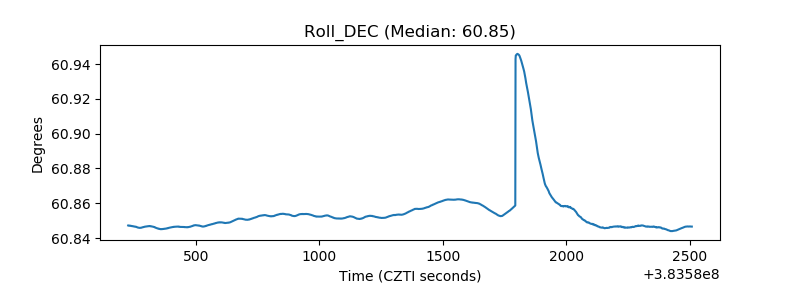 |
| _Roll_RA | 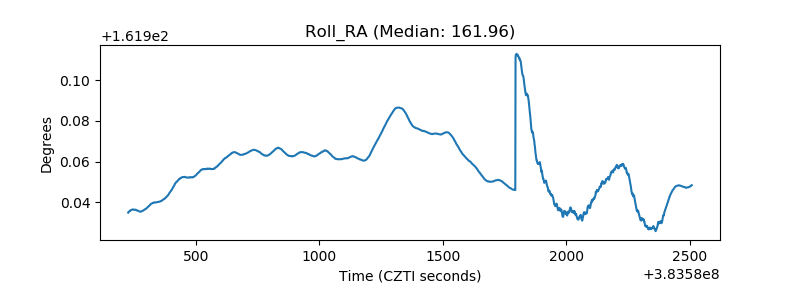 |
| Veto Counter | 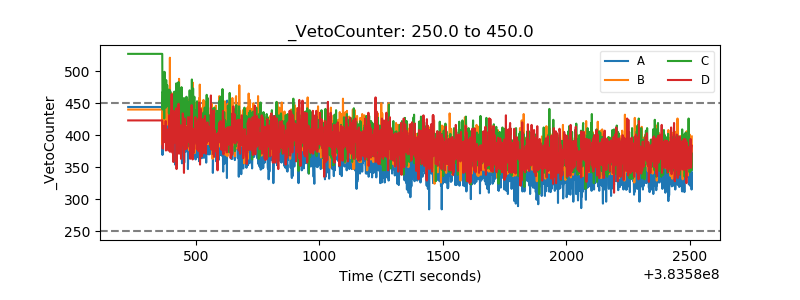 |