| Param | Original file | Final file |
|---|---|---|
| Filename | modeM0/AS1A07_093T11_9000004964_34687cztM0_level2.evt | modeM0/AS1A07_093T11_9000004964_34687cztM0_level2_quad_clean.evt |
| Size (bytes) | 556,963,200 | 99,449,280 |
| Size | 531.2 MB | 94.8 MB |
| Events in quadrant A | 2,706,666 | 681,180 |
| Events in quadrant B | 4,408,872 | 648,089 |
| Events in quadrant C | 2,994,084 | 668,939 |
| Events in quadrant D | 6,368,732 | 611,330 |
| Mode M9 | |||
|---|---|---|---|
| Quadrant | BADHDUFLAG | Total packets | Discarded packets |
| A | 0 | 17 | 0 |
| B | 0 | 17 | 0 |
| C | 0 | 17 | 0 |
| D | 0 | 18 | 0 |
| Mode M0 | |||
|---|---|---|---|
| Quadrant | BADHDUFLAG | Total packets | Discarded packets |
| A | 0 | 11861 | 3 |
| B | 0 | 16875 | 2 |
| C | 0 | 12216 | 2 |
| D | 0 | 22933 | 2 |
| Mode SS | |||
|---|---|---|---|
| Quadrant | BADHDUFLAG | Total packets | Discarded packets |
| A | 0 | 118 | 0 |
| B | 0 | 118 | 0 |
| C | 0 | 118 | 0 |
| D | 0 | 118 | 0 |
| Quadrant | Total seconds | Saturated seconds | Saturation percentage |
|---|---|---|---|
| A | 5745 | 21 | 0.365535% |
| B | 5745 | 671 | 11.679721% |
| C | 5745 | 37 | 0.644038% |
| D | 5745 | 503 | 8.755440% |
Noise dominated data is calculated using 1-second bins in cleaned event files. If a bin has >2000 counts, and if more than 50% of those come from <1% of pixels, then it is considered to be noise-dominated and hence unusable.
| Quadrant | # 1 sec bins | Bins with >0 counts | Bins with >2000 counts | High rate bins dominated by noise | Noise dominated (total time) | Noise dominated (detector-on time) | Marked lightcurve |
|---|---|---|---|---|---|---|---|
| A | 7176 | 5746 | 7 | 7 | 0.10% | 0.12% | 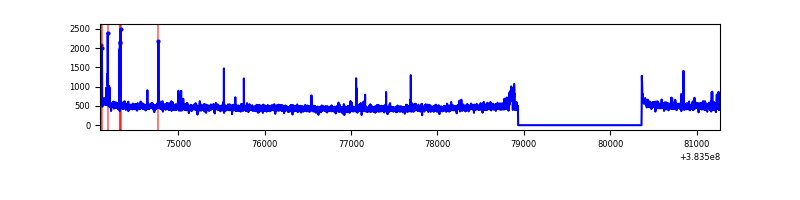 |
| B | 7176 | 5745 | 451 | 451 | 6.28% | 7.85% | 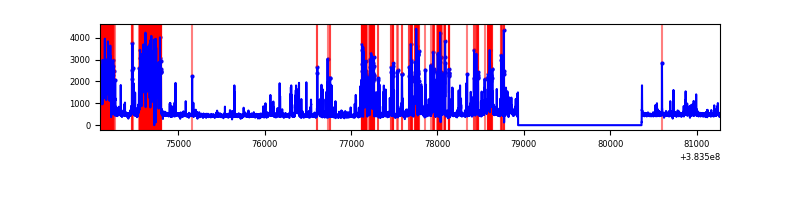 |
| C | 7176 | 5746 | 24 | 24 | 0.33% | 0.42% | 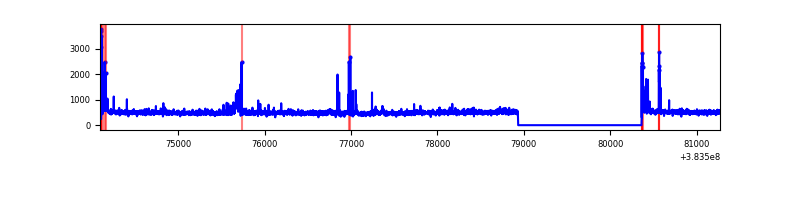 |
| D | 7176 | 5746 | 427 | 427 | 5.95% | 7.43% | 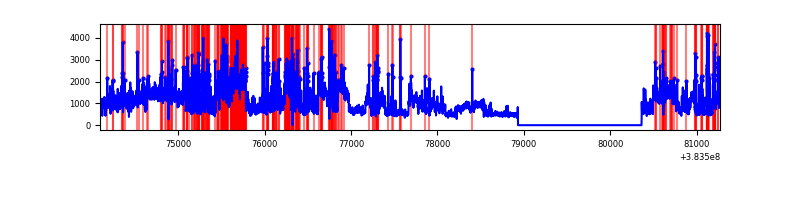 |
Top three noisy pixels from each quadrant. If the there are fewer than three noisy pixels in the level2.evt file, extra rows are filled as -1
| Pixel properties | Quadrant properties | ||||||
|---|---|---|---|---|---|---|---|
| Quadrant | DetID | PixID | Counts | Sigma | Mean | Median | Sigma |
| A | 15 | 174 | 50461 | 377.19 | 658 | 645 | 132.1 |
| A | 10 | 83 | 50290 | 375.9 | 658 | 645 | 132.1 |
| A | 9 | 143 | 19225 | 140.68 | 658 | 645 | 132.1 |
| B | 5 | 172 | 908000 | 7775.07 | 619 | 605 | 116.7 |
| B | 5 | 255 | 823613 | 7051.99 | 619 | 605 | 116.7 |
| B | 4 | 232 | 91587 | 779.58 | 619 | 605 | 116.7 |
| C | 15 | 214 | 248097 | 1673.72 | 636 | 638 | 147.8 |
| C | 0 | 10 | 94064 | 631.9 | 636 | 638 | 147.8 |
| C | 14 | 67 | 56548 | 378.15 | 636 | 638 | 147.8 |
| D | 8 | 195 | 2244084 | 13475.26 | 616 | 603 | 166.5 |
| D | 2 | 250 | 543355 | 3259.99 | 616 | 603 | 166.5 |
| D | 7 | 38 | 450258 | 2700.81 | 616 | 603 | 166.5 |
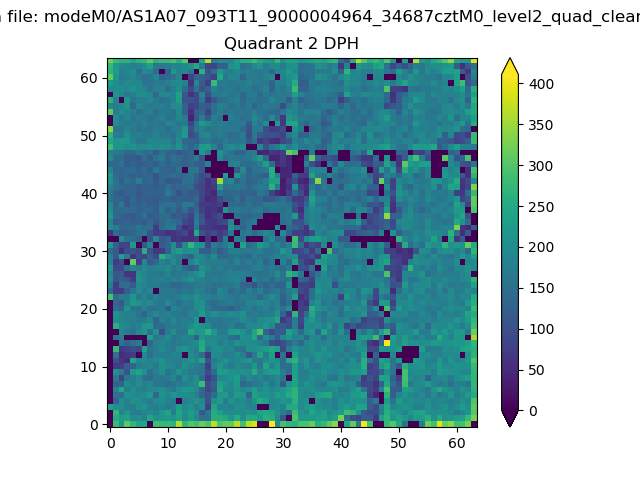
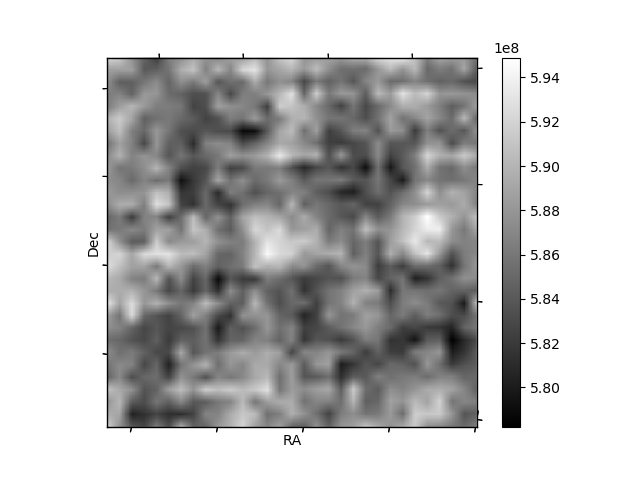
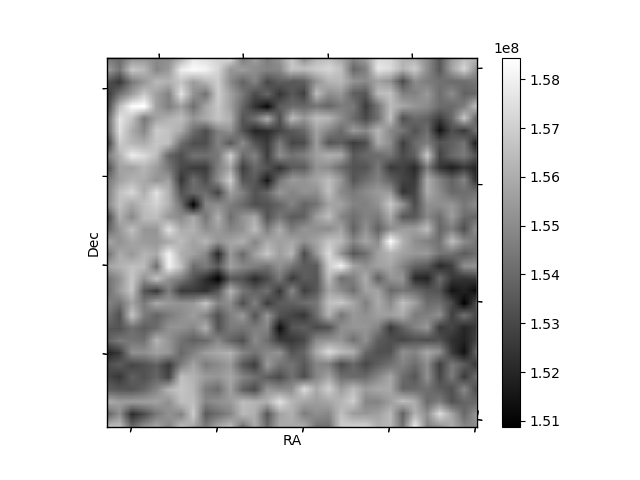
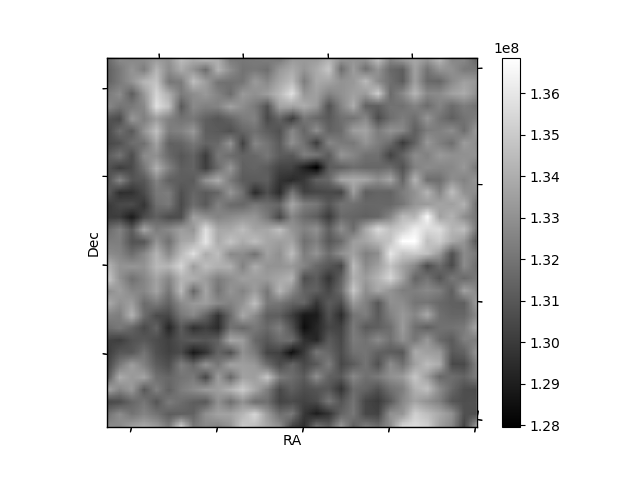
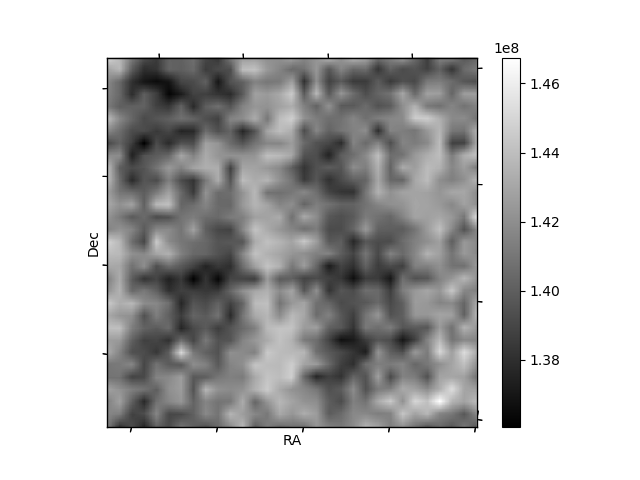
Histogram calculated using DETX and DETY for each event in the final _common_clean file
| Quadrant A | 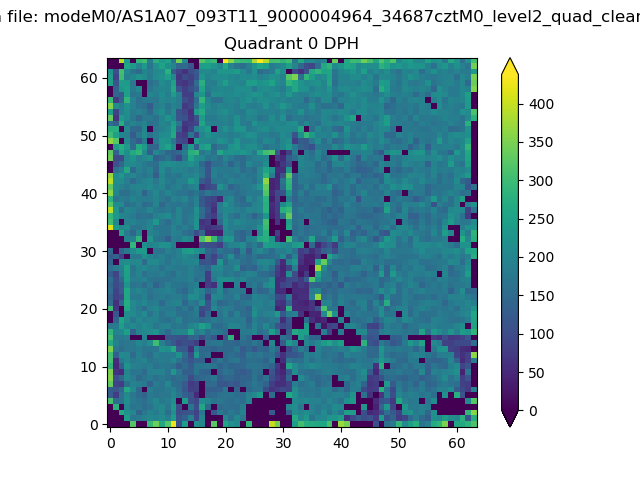 |
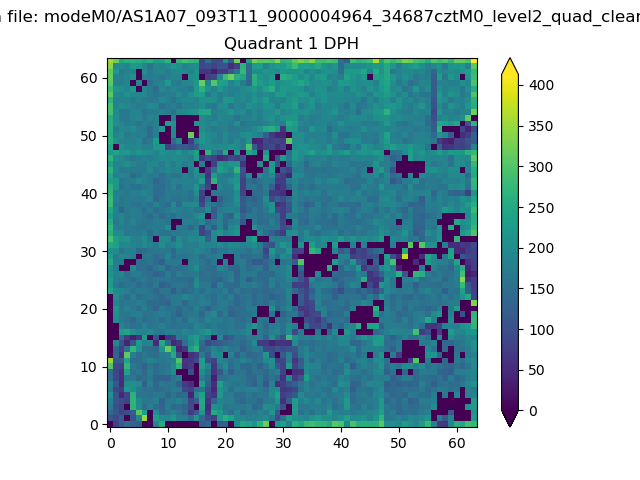 |
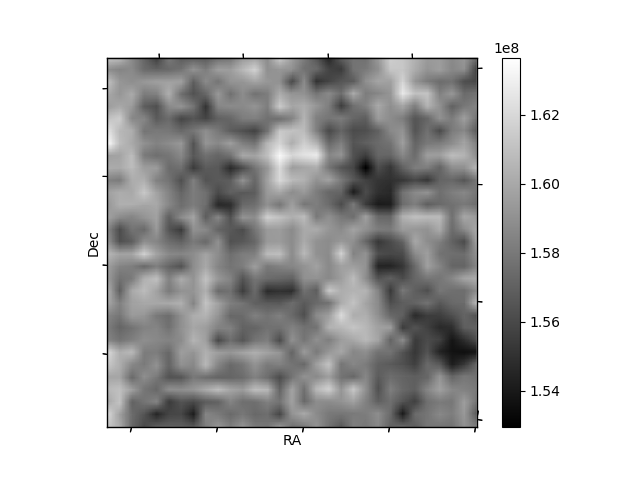
Quadrant B |
|---|---|---|---|
| Quadrant D | 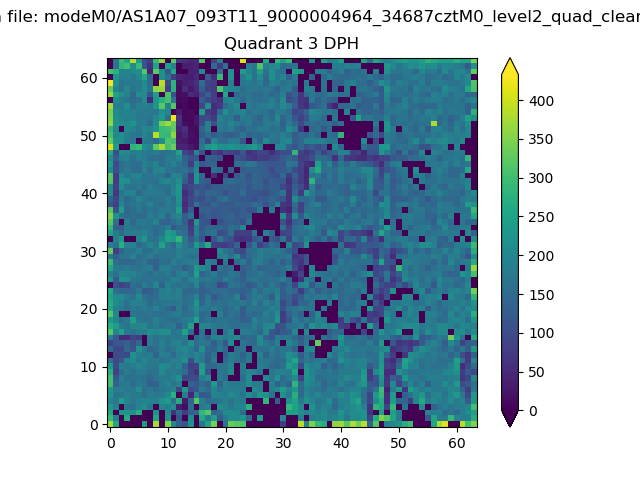 |
 |
Quadrant C |
| Plot type | Count rate plots | Images |
|---|---|---|
| Comparison with Poisson distribution Blue bars denote a histogram of data divided into 1 sec bins. Red curve is a Poisson curve with rate = median count rate of data. |
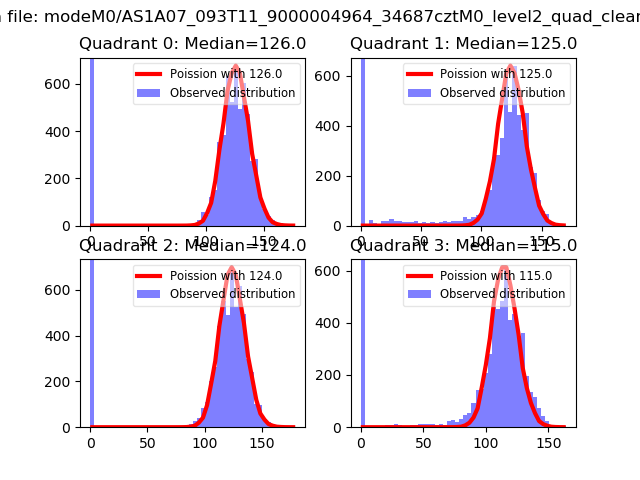 |
 |
| Quadrant-wise count rates Data is divided into 100 sec bins |
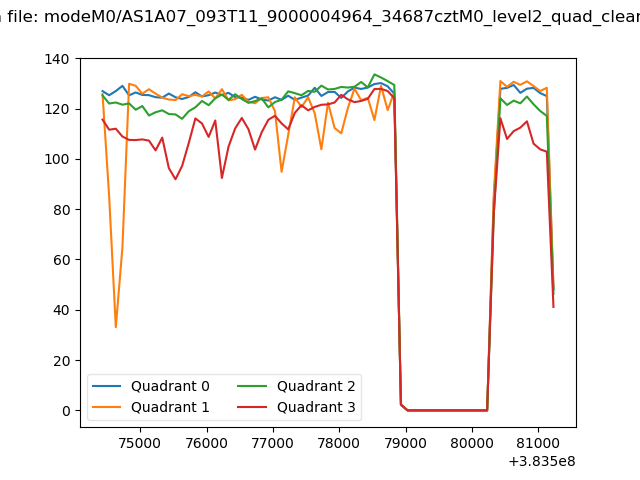 |
|
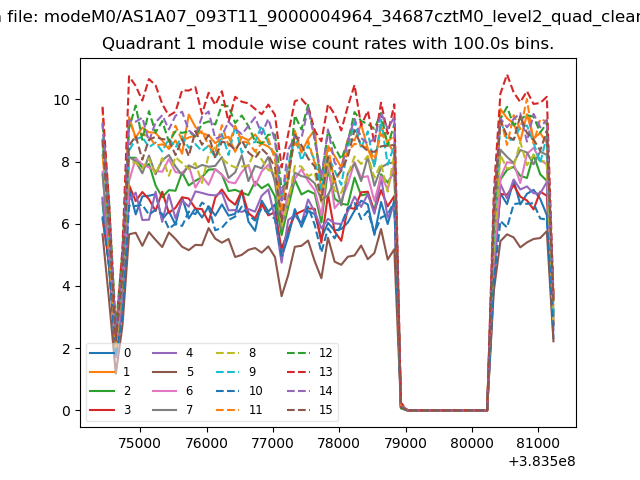
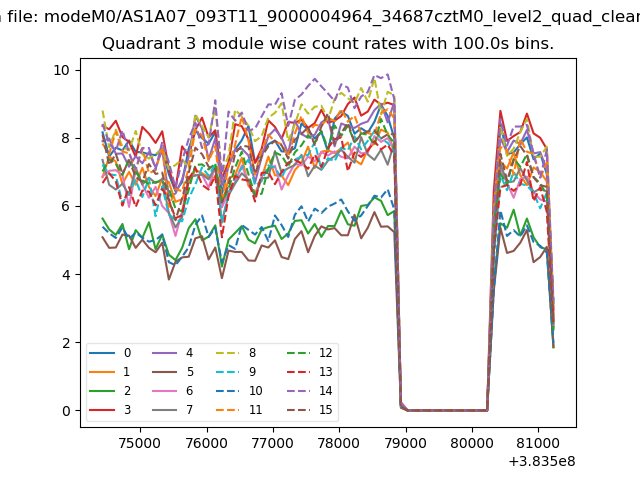
| Module-wise count rates for Quadrant A Data is divided into 100 sec bins |
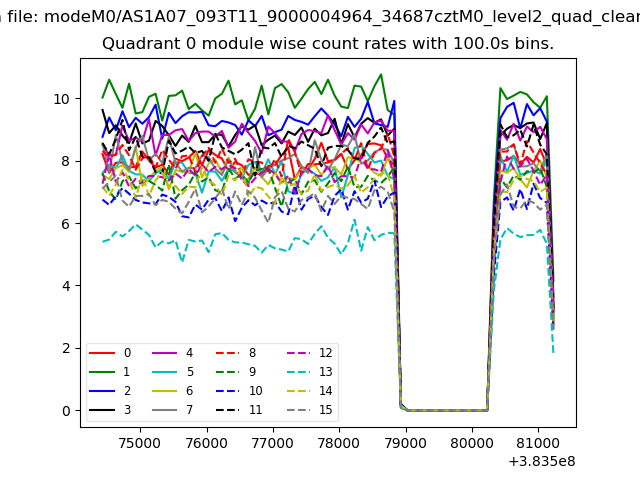 |
 |
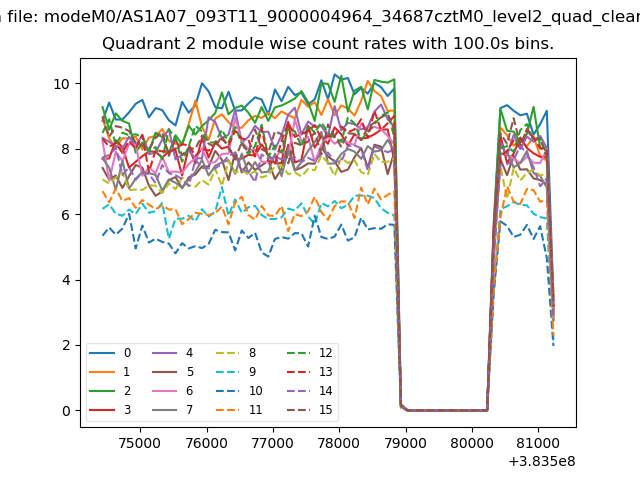
| Module-wise count rates for Quadrant B Data is divided into 100 sec bins |
 |
 |
| Module-wise count rates for Quadrant C Data is divided into 100 sec bins |
 |
 |
| Module-wise count rates for Quadrant D Data is divided into 100 sec bins |
 |
 |
| Parameter | Plot |
|---|---|
| CZT HV Monitor | 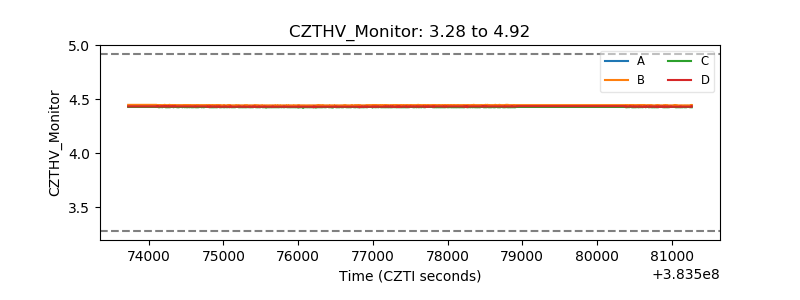 |
| D_VDD | 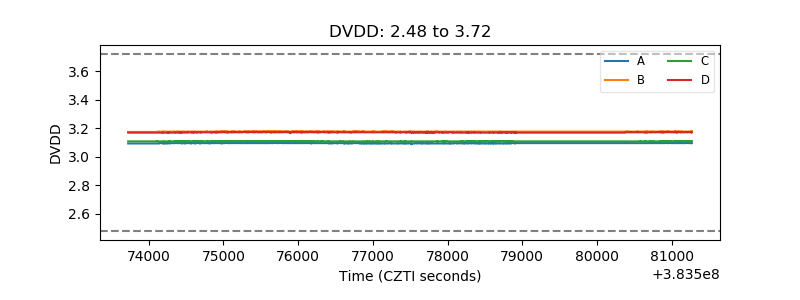 |
| Temperature 1 | 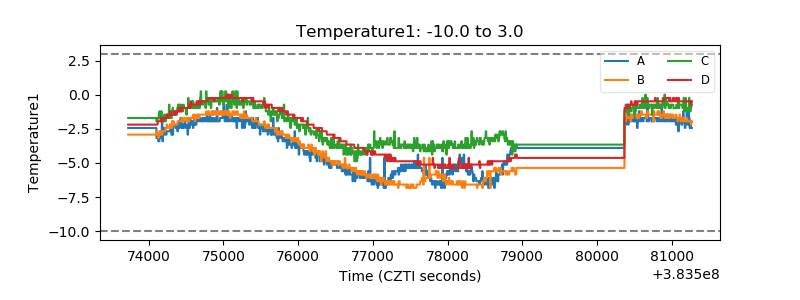 |
| Veto HV Monitor | 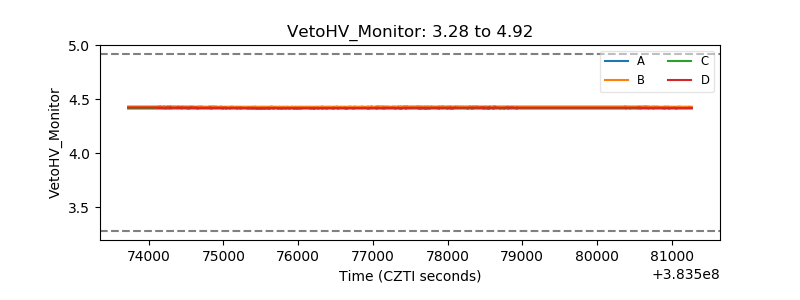 |
| Veto LLD | 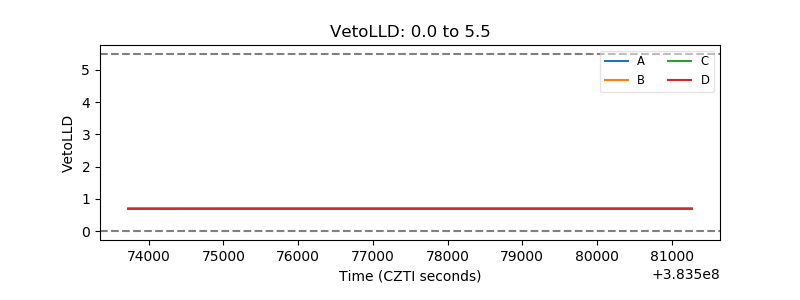 |
| Alpha Counter | 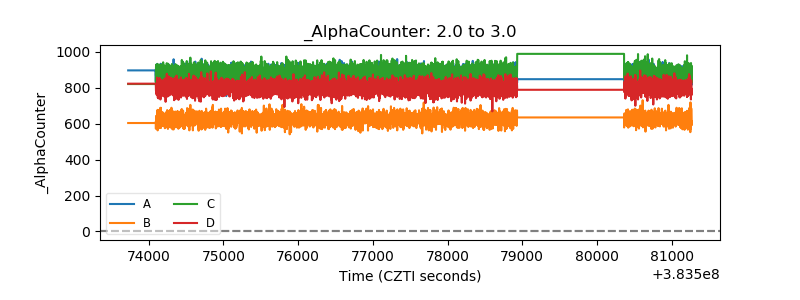 |
| _CPM_Rate | 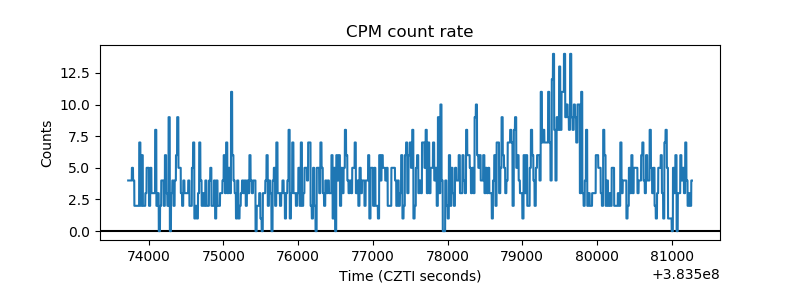 |
| CZT Counter | 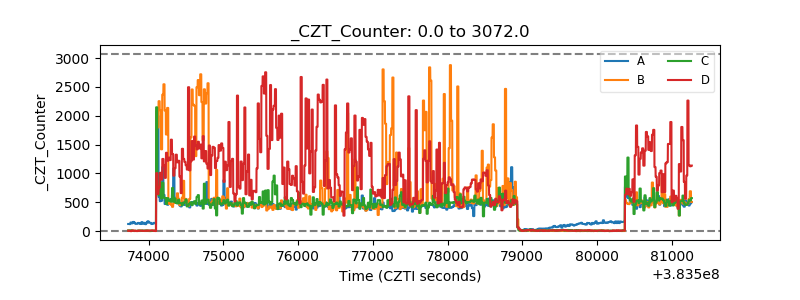 |
| +2.5 Volts monitor | 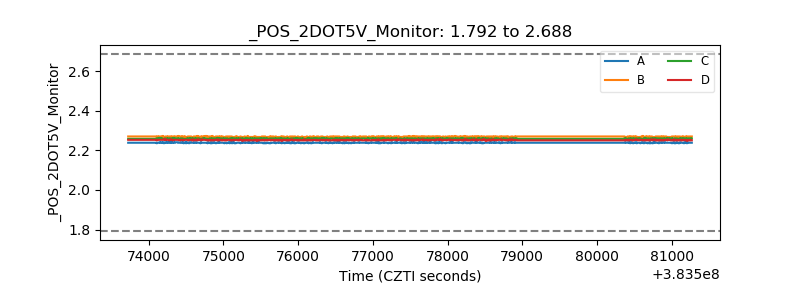 |
| +5 Volts monitor | 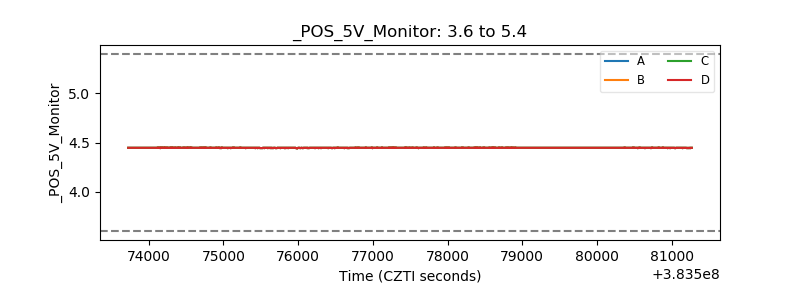 |
| _ROLL_ROT | 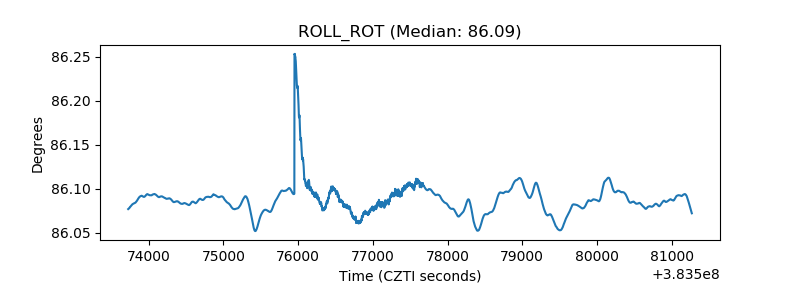 |
| _Roll_DEC | 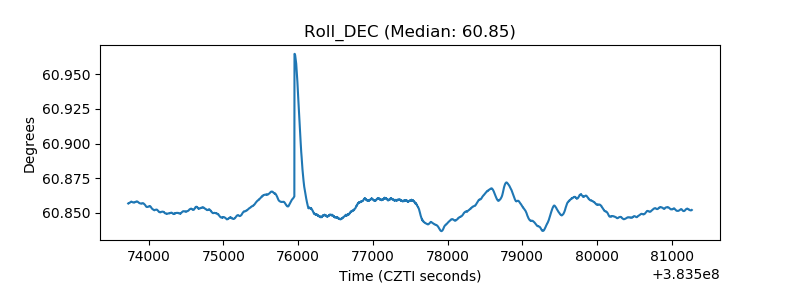 |
| _Roll_RA | 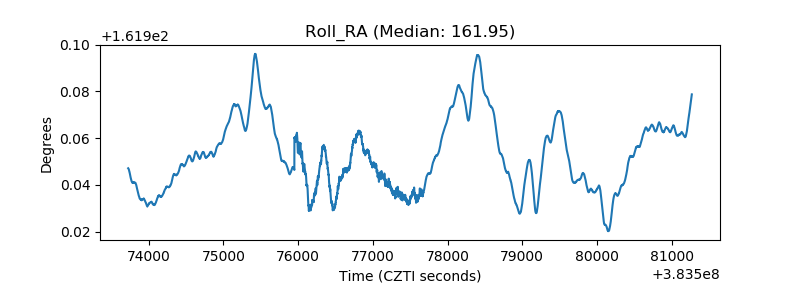 |
| Veto Counter | 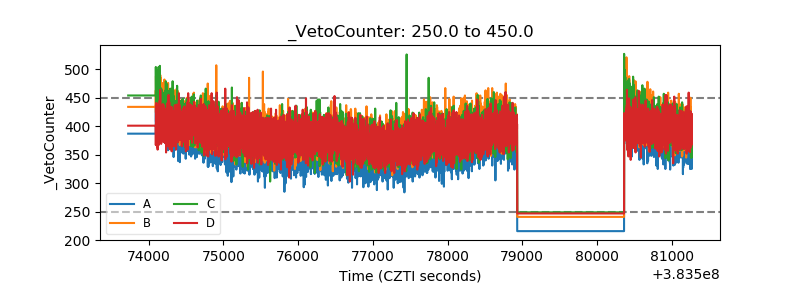 |