| Param | Original file | Final file |
|---|---|---|
| Filename | modeM0/AS1A07_093T11_9000004964_34686cztM0_level2.evt | modeM0/AS1A07_093T11_9000004964_34686cztM0_level2_quad_clean.evt |
| Size (bytes) | 209,206,080 | 30,165,120 |
| Size | 199.5 MB | 28.8 MB |
| Events in quadrant A | 968,161 | 205,357 |
| Events in quadrant B | 2,227,025 | 170,487 |
| Events in quadrant C | 1,030,038 | 204,823 |
| Events in quadrant D | 1,976,734 | 190,756 |
| Mode M9 | |||
|---|---|---|---|
| Quadrant | BADHDUFLAG | Total packets | Discarded packets |
| A | 0 | 17 | 0 |
| B | 0 | 17 | 0 |
| C | 0 | 17 | 0 |
| D | 0 | 17 | 0 |
| Mode M0 | |||
|---|---|---|---|
| Quadrant | BADHDUFLAG | Total packets | Discarded packets |
| A | 0 | 4096 | 2 |
| B | 0 | 7865 | 1 |
| C | 0 | 4141 | 1 |
| D | 0 | 7179 | 1 |
| Mode SS | |||
|---|---|---|---|
| Quadrant | BADHDUFLAG | Total packets | Discarded packets |
| A | 0 | 42 | 0 |
| B | 0 | 42 | 0 |
| C | 0 | 42 | 0 |
| D | 0 | 42 | 0 |
| Quadrant | Total seconds | Saturated seconds | Saturation percentage |
|---|---|---|---|
| A | 1937 | 17 | 0.877646% |
| B | 1937 | 591 | 30.511100% |
| C | 1937 | 19 | 0.980898% |
| D | 1937 | 64 | 3.304078% |
Noise dominated data is calculated using 1-second bins in cleaned event files. If a bin has >2000 counts, and if more than 50% of those come from <1% of pixels, then it is considered to be noise-dominated and hence unusable.
| Quadrant | # 1 sec bins | Bins with >0 counts | Bins with >2000 counts | High rate bins dominated by noise | Noise dominated (total time) | Noise dominated (detector-on time) | Marked lightcurve |
|---|---|---|---|---|---|---|---|
| A | 3669 | 1938 | 9 | 9 | 0.25% | 0.46% | 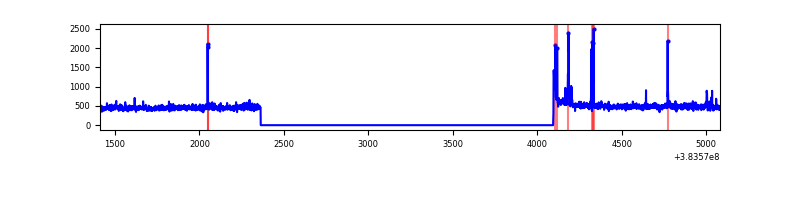 |
| B | 3669 | 1937 | 424 | 424 | 11.56% | 21.89% | 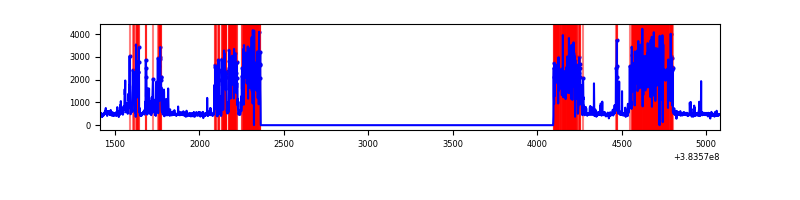 |
| C | 3669 | 1938 | 13 | 13 | 0.35% | 0.67% | 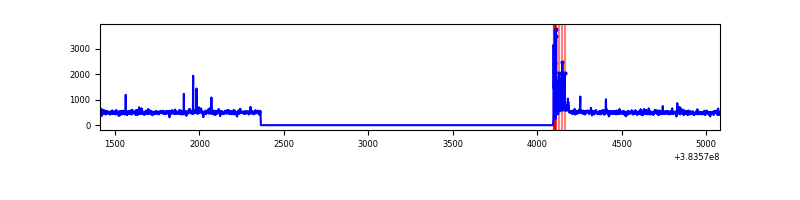 |
| D | 3669 | 1938 | 36 | 36 | 0.98% | 1.86% | 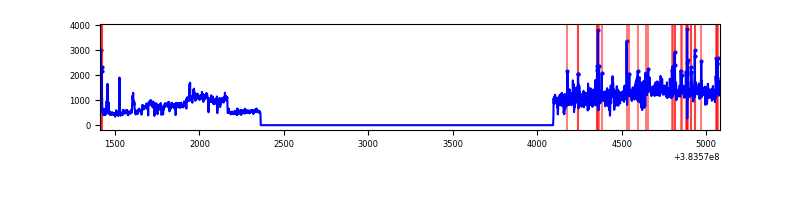 |
Top three noisy pixels from each quadrant. If the there are fewer than three noisy pixels in the level2.evt file, extra rows are filled as -1
| Pixel properties | Quadrant properties | ||||||
|---|---|---|---|---|---|---|---|
| Quadrant | DetID | PixID | Counts | Sigma | Mean | Median | Sigma |
| A | 15 | 174 | 36483 | 771.49 | 227 | 222 | 47.0 |
| A | 10 | 83 | 22037 | 464.14 | 227 | 222 | 47.0 |
| A | 9 | 143 | 11024 | 229.82 | 227 | 222 | 47.0 |
| B | 5 | 255 | 809906 | 21368.98 | 190 | 185 | 37.9 |
| B | 5 | 172 | 644570 | 17005.67 | 190 | 185 | 37.9 |
| B | 4 | 141 | 5874 | 150.14 | 190 | 185 | 37.9 |
| C | 15 | 214 | 84594 | 1629.87 | 218 | 219 | 51.8 |
| C | 0 | 10 | 62067 | 1194.72 | 218 | 219 | 51.8 |
| C | 14 | 67 | 13855 | 263.41 | 218 | 219 | 51.8 |
| D | 8 | 195 | 954954 | 17438.1 | 217 | 211 | 54.8 |
| D | 2 | 249 | 45511 | 827.39 | 217 | 211 | 54.8 |
| D | 10 | 199 | 32985 | 598.61 | 217 | 211 | 54.8 |
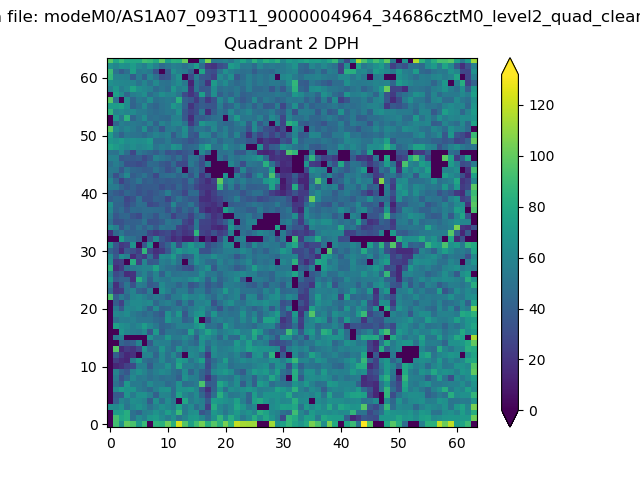
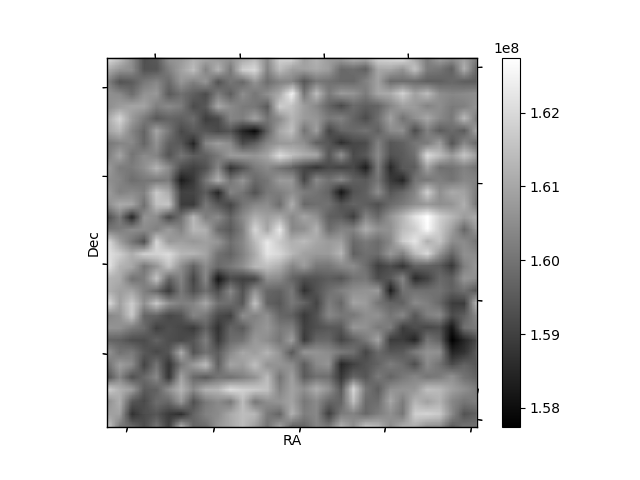
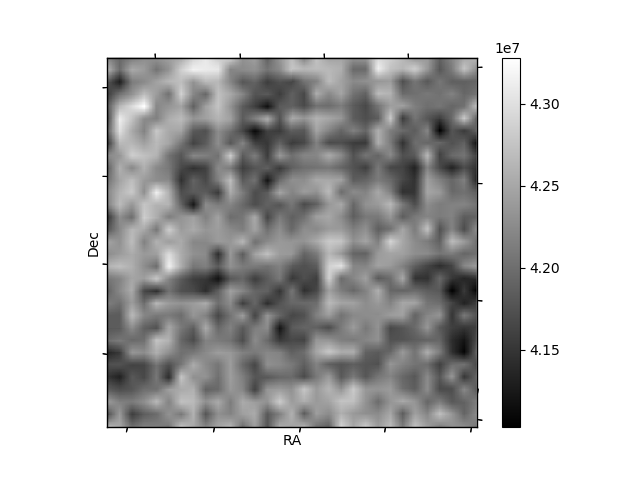
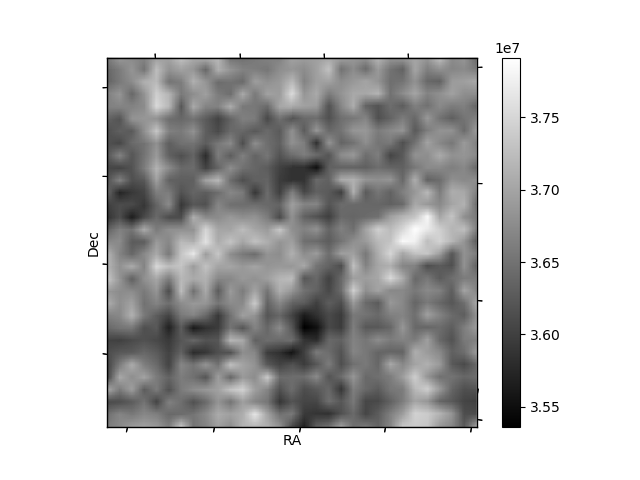
Histogram calculated using DETX and DETY for each event in the final _common_clean file
| Quadrant A | 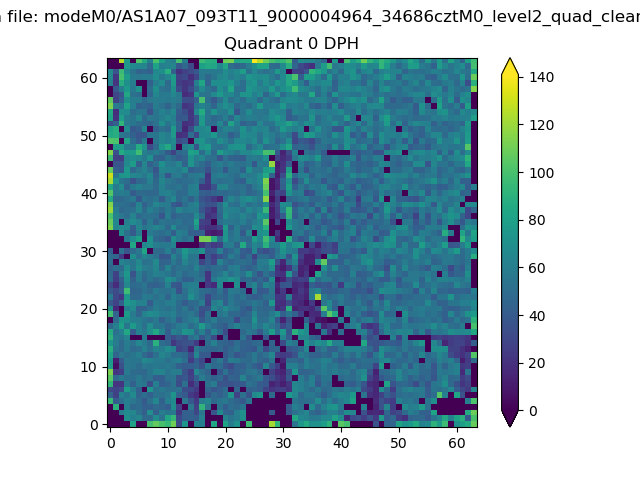 |
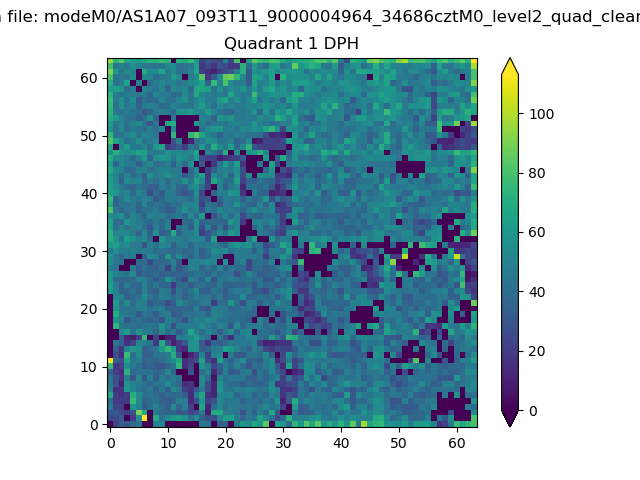 |
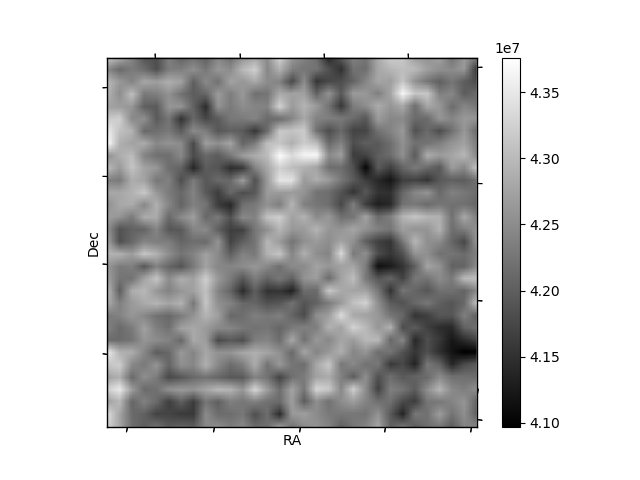
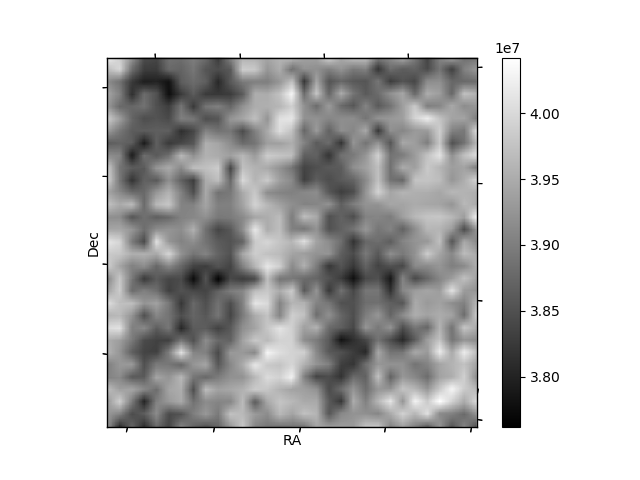
Quadrant B |
|---|---|---|---|
| Quadrant D | 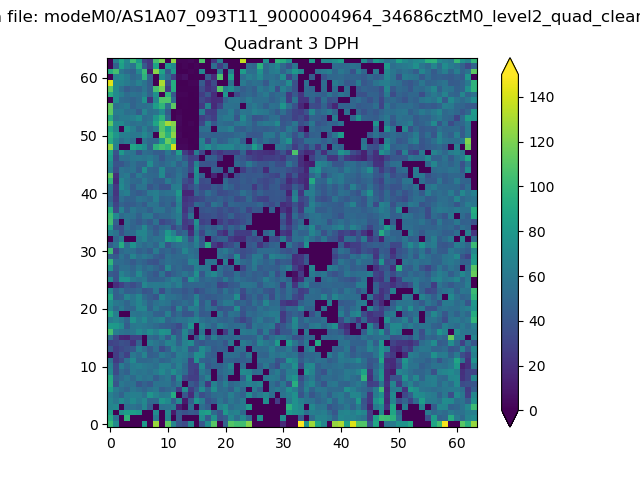 |
 |
Quadrant C |
| Plot type | Count rate plots | Images |
|---|---|---|
| Comparison with Poisson distribution Blue bars denote a histogram of data divided into 1 sec bins. Red curve is a Poisson curve with rate = median count rate of data. |
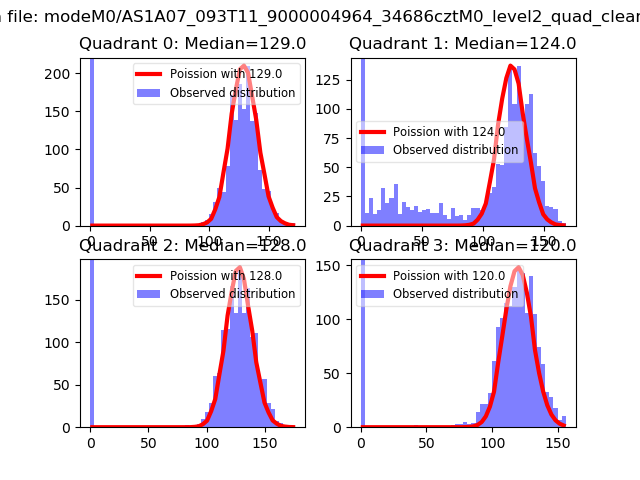 |
 |
| Quadrant-wise count rates Data is divided into 100 sec bins |
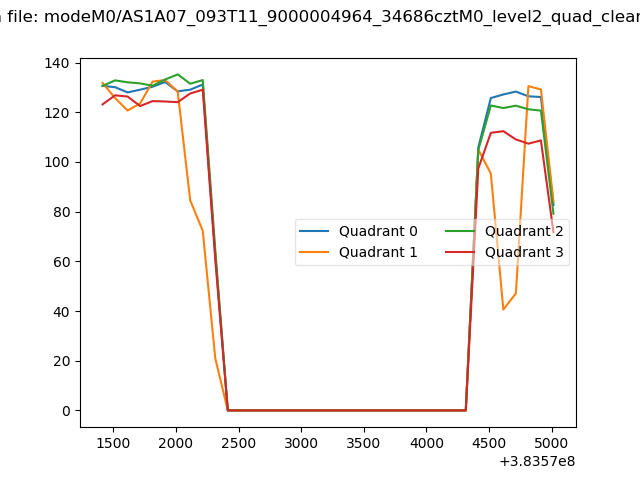 |
|
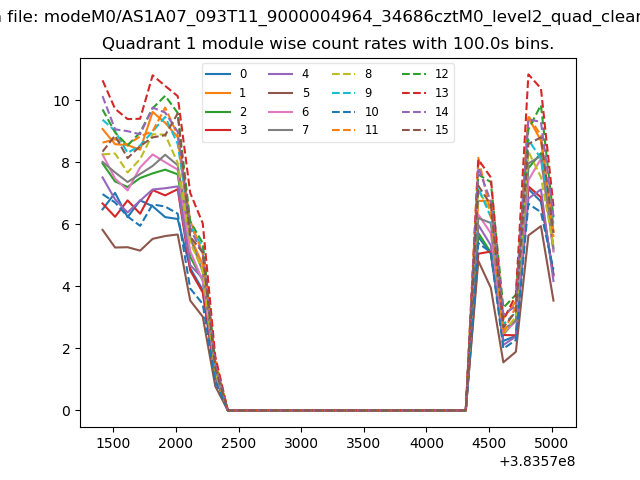
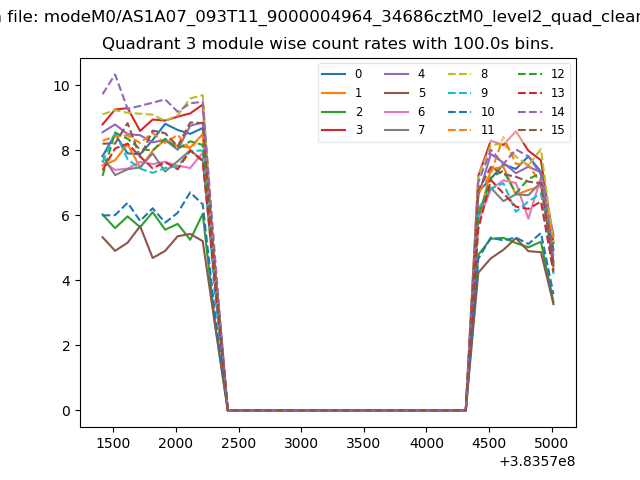
| Module-wise count rates for Quadrant A Data is divided into 100 sec bins |
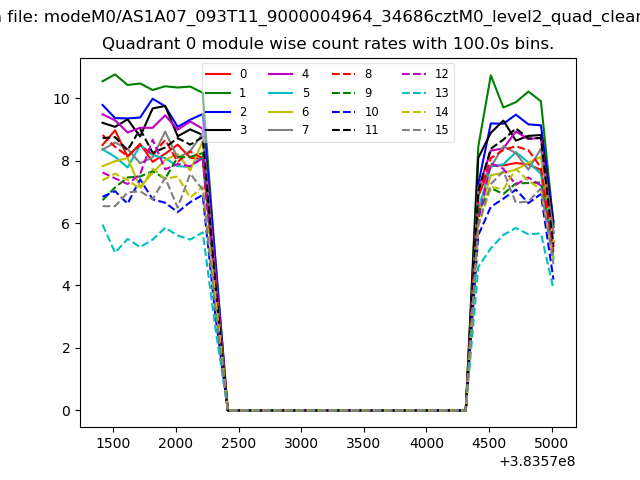 |
 |
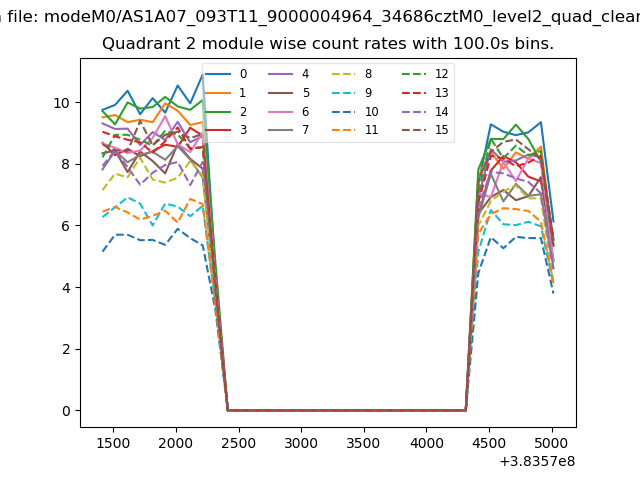
| Module-wise count rates for Quadrant B Data is divided into 100 sec bins |
 |
 |
| Module-wise count rates for Quadrant C Data is divided into 100 sec bins |
 |
 |
| Module-wise count rates for Quadrant D Data is divided into 100 sec bins |
 |
 |
| Parameter | Plot |
|---|---|
| CZT HV Monitor | 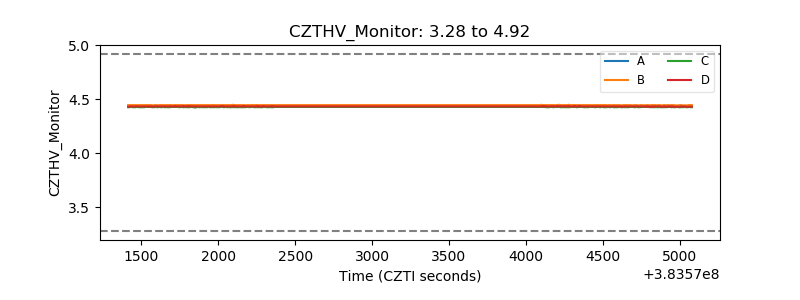 |
| D_VDD | 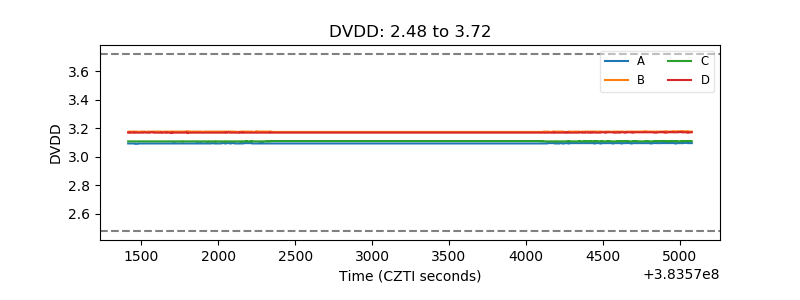 |
| Temperature 1 | 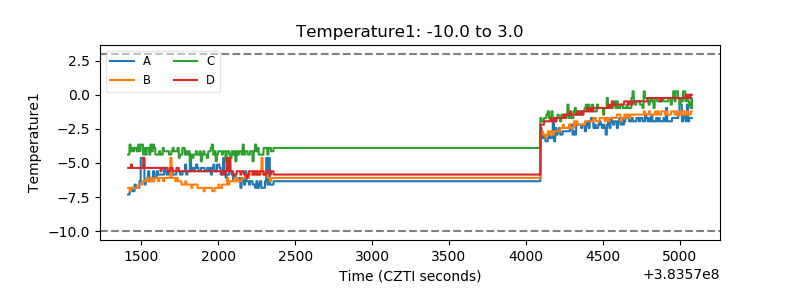 |
| Veto HV Monitor | 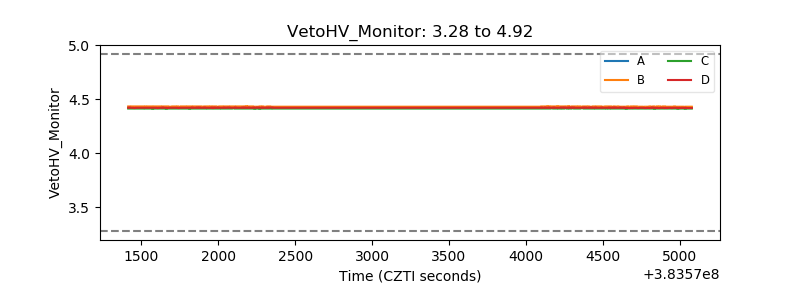 |
| Veto LLD | 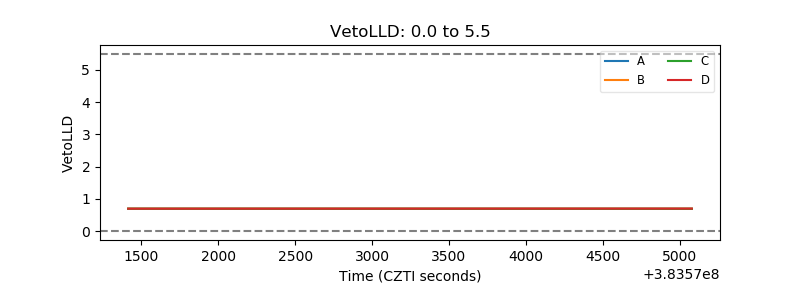 |
| Alpha Counter | 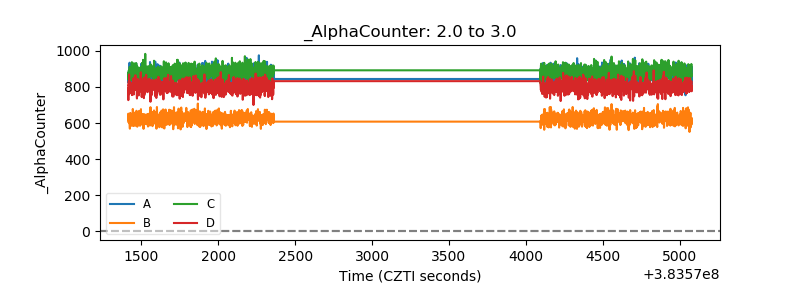 |
| _CPM_Rate | 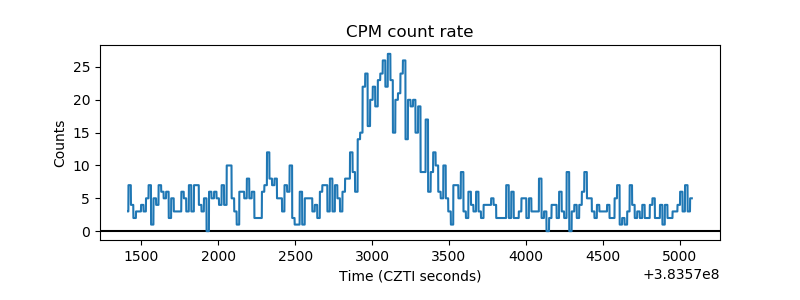 |
| CZT Counter | 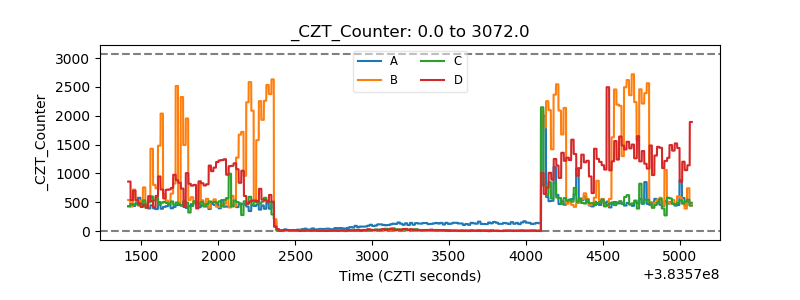 |
| +2.5 Volts monitor | 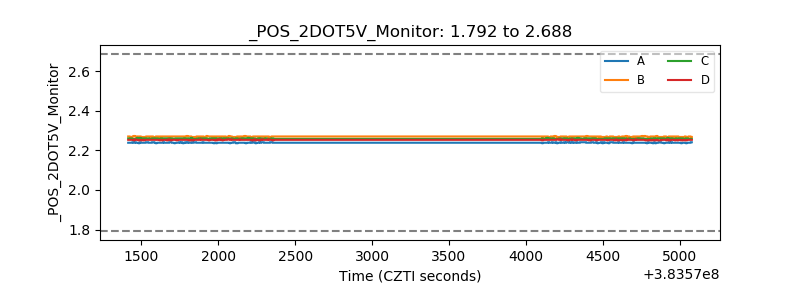 |
| +5 Volts monitor | 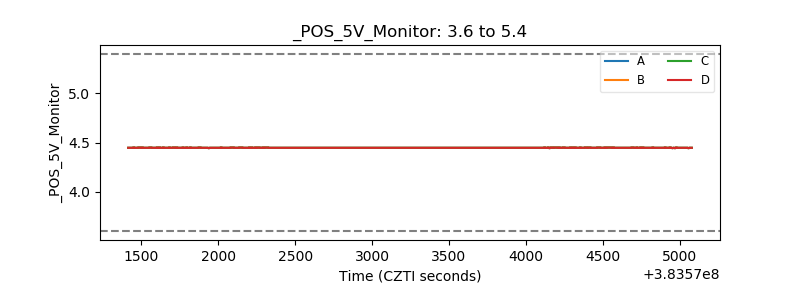 |
| _ROLL_ROT | 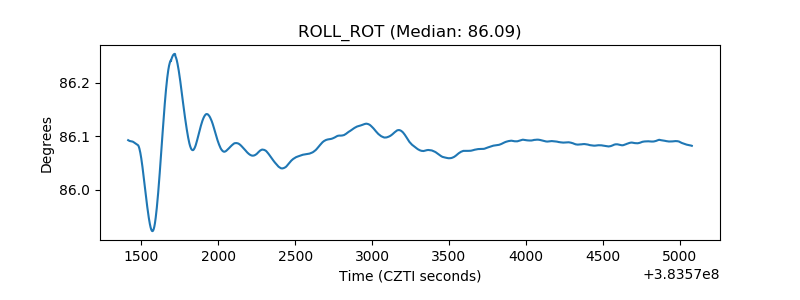 |
| _Roll_DEC | 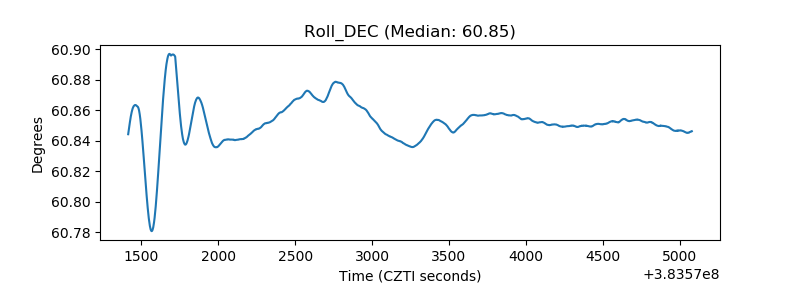 |
| _Roll_RA | 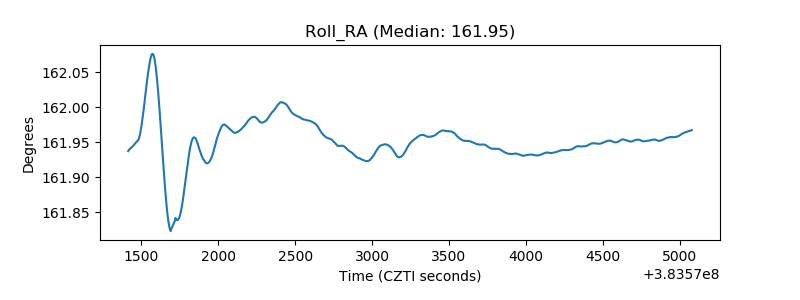 |
| Veto Counter | 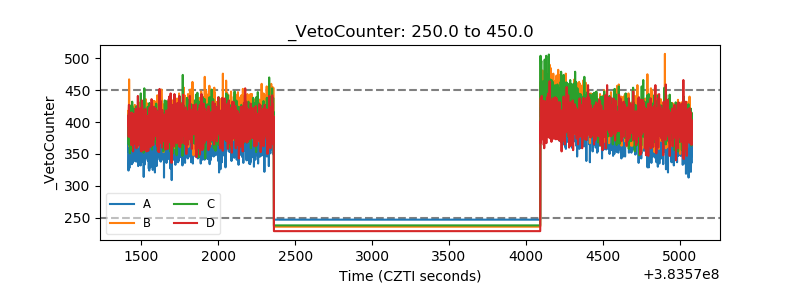 |