| Param | Original file | Final file |
|---|---|---|
| Filename | modeM0/AS1T04_078T01_9000004962_34685cztM0_level2.evt | modeM0/AS1T04_078T01_9000004962_34685cztM0_level2_quad_clean.evt |
| Size (bytes) | 507,355,200 | 47,776,320 |
| Size | 483.9 MB | 45.6 MB |
| Events in quadrant A | 2,674,437 | 278,245 |
| Events in quadrant B | 3,665,392 | 272,667 |
| Events in quadrant C | 3,238,855 | 270,346 |
| Events in quadrant D | 5,434,069 | 259,973 |
| Mode M0 | |||
|---|---|---|---|
| Quadrant | BADHDUFLAG | Total packets | Discarded packets |
| A | 0 | 10942 | 3 |
| B | 0 | 14101 | 2 |
| C | 0 | 12602 | 2 |
| D | 0 | 19897 | 2 |
| Mode M9 | |||
|---|---|---|---|
| Quadrant | BADHDUFLAG | Total packets | Discarded packets |
| A | 0 | 25 | 0 |
| B | 0 | 25 | 0 |
| C | 0 | 25 | 0 |
| D | 0 | 26 | 0 |
| Mode SS | |||
|---|---|---|---|
| Quadrant | BADHDUFLAG | Total packets | Discarded packets |
| A | 0 | 106 | 0 |
| B | 0 | 106 | 0 |
| C | 0 | 106 | 0 |
| D | 0 | 106 | 0 |
| Quadrant | Total seconds | Saturated seconds | Saturation percentage |
|---|---|---|---|
| A | 5209 | 15 | 0.287963% |
| B | 5209 | 349 | 6.699942% |
| C | 5209 | 98 | 1.881359% |
| D | 5209 | 141 | 2.706854% |
Noise dominated data is calculated using 1-second bins in cleaned event files. If a bin has >2000 counts, and if more than 50% of those come from <1% of pixels, then it is considered to be noise-dominated and hence unusable.
| Quadrant | # 1 sec bins | Bins with >0 counts | Bins with >2000 counts | High rate bins dominated by noise | Noise dominated (total time) | Noise dominated (detector-on time) | Marked lightcurve |
|---|---|---|---|---|---|---|---|
| A | 7244 | 5210 | 6 | 6 | 0.08% | 0.12% | 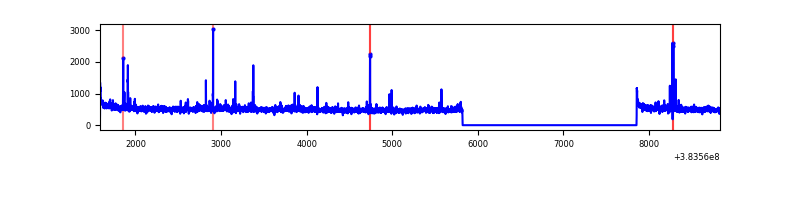 |
| B | 7244 | 5210 | 204 | 204 | 2.82% | 3.92% | 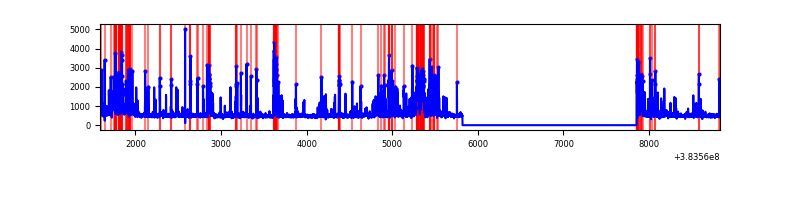 |
| C | 7244 | 5210 | 91 | 91 | 1.26% | 1.75% | 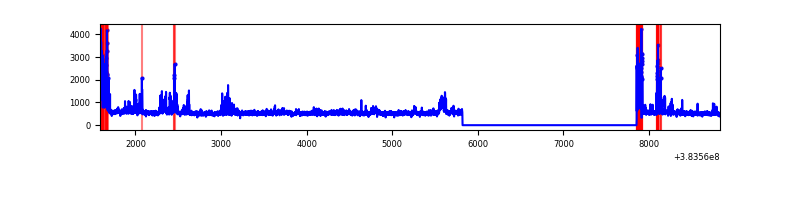 |
| D | 7244 | 5210 | 106 | 106 | 1.46% | 2.03% | 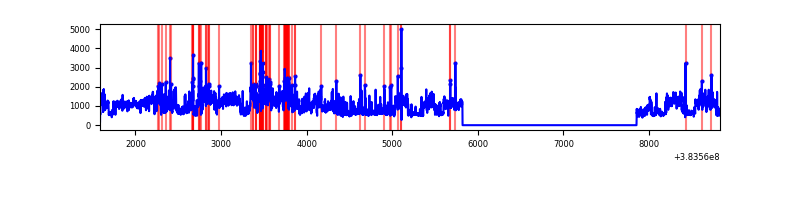 |
Top three noisy pixels from each quadrant. If the there are fewer than three noisy pixels in the level2.evt file, extra rows are filled as -1
| Pixel properties | Quadrant properties | ||||||
|---|---|---|---|---|---|---|---|
| Quadrant | DetID | PixID | Counts | Sigma | Mean | Median | Sigma |
| A | 10 | 83 | 47710 | 367.3 | 643 | 630 | 128.2 |
| A | 9 | 143 | 36475 | 279.65 | 643 | 630 | 128.2 |
| A | 15 | 169 | 33381 | 255.51 | 643 | 630 | 128.2 |
| B | 5 | 172 | 770419 | 6478.3 | 620 | 604 | 118.8 |
| B | 5 | 255 | 205107 | 1720.97 | 620 | 604 | 118.8 |
| B | 0 | 218 | 156733 | 1313.89 | 620 | 604 | 118.8 |
| C | 0 | 10 | 255606 | 1806.9 | 611 | 616 | 141.1 |
| C | 15 | 214 | 223405 | 1578.72 | 611 | 616 | 141.1 |
| C | 0 | 207 | 160070 | 1129.92 | 611 | 616 | 141.1 |
| D | 8 | 195 | 2141759 | 12925.77 | 612 | 600 | 165.7 |
| D | 2 | 249 | 272290 | 1640.14 | 612 | 600 | 165.7 |
| D | 7 | 38 | 222805 | 1341.41 | 612 | 600 | 165.7 |
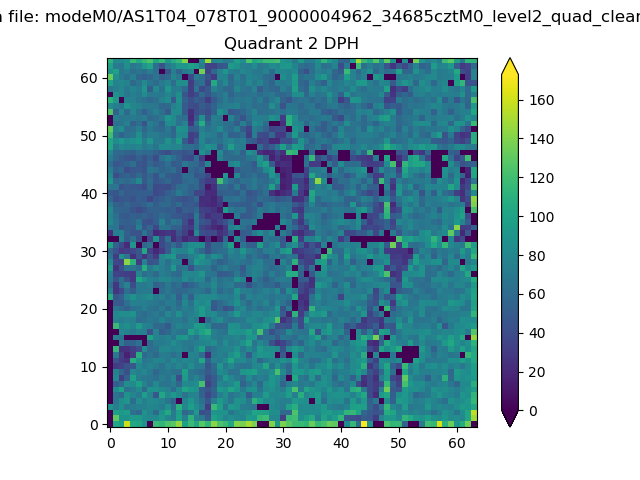
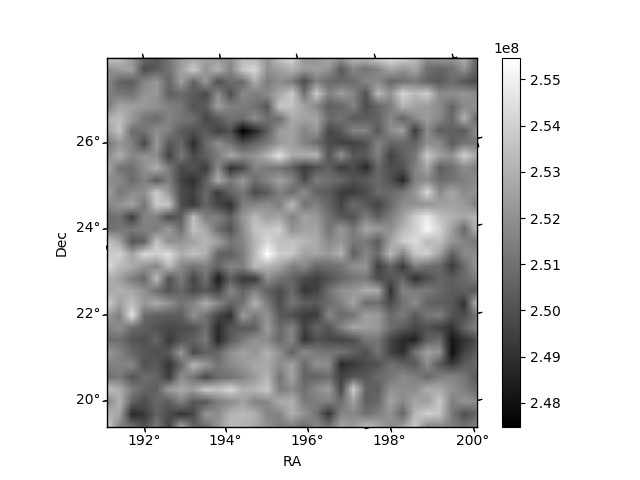
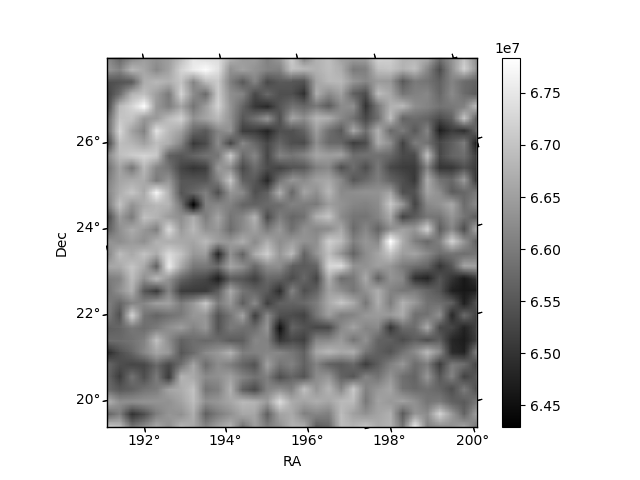
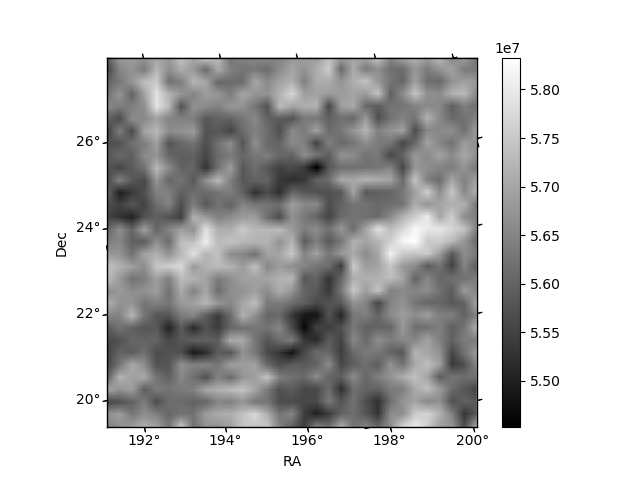
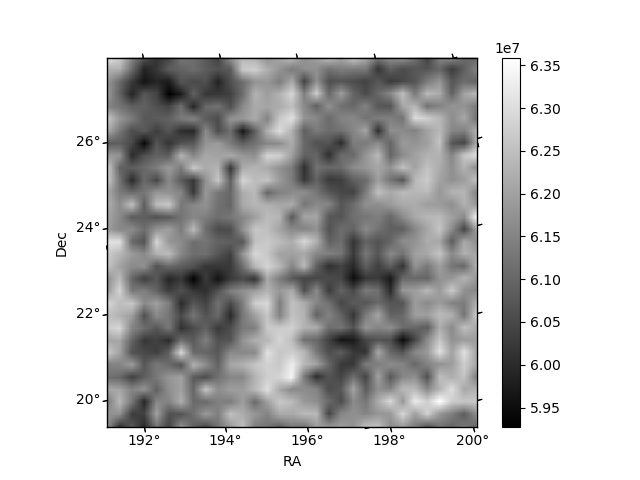
Histogram calculated using DETX and DETY for each event in the final _common_clean file
| Quadrant A | 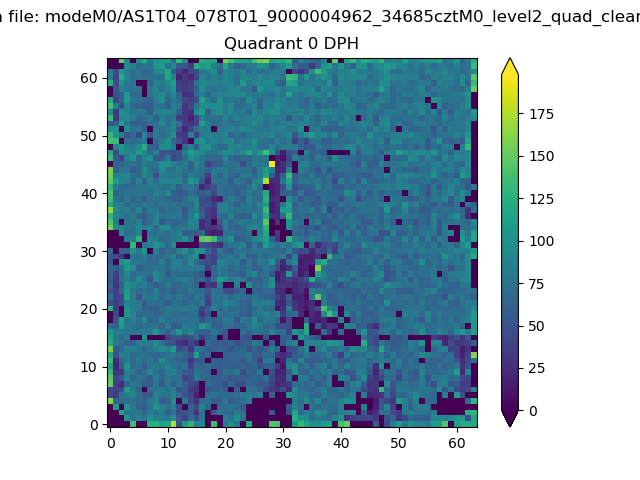 |
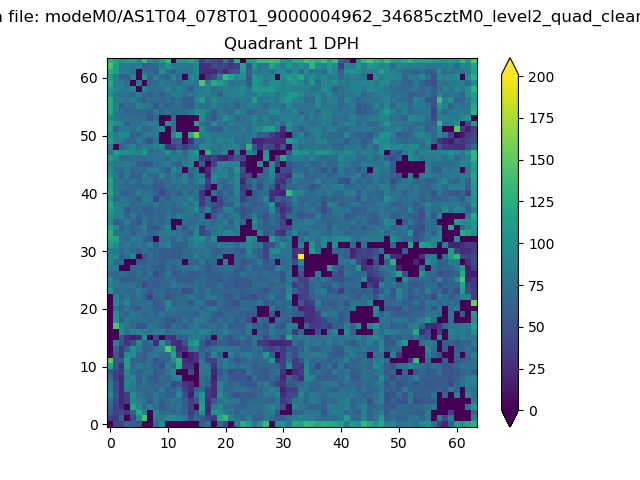 |
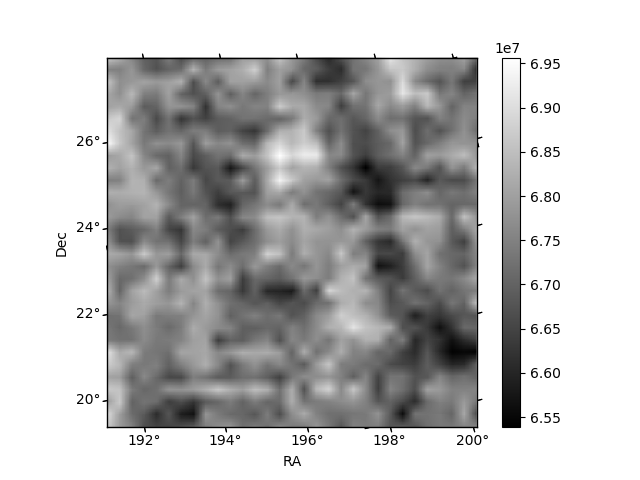
Quadrant B |
|---|---|---|---|
| Quadrant D | 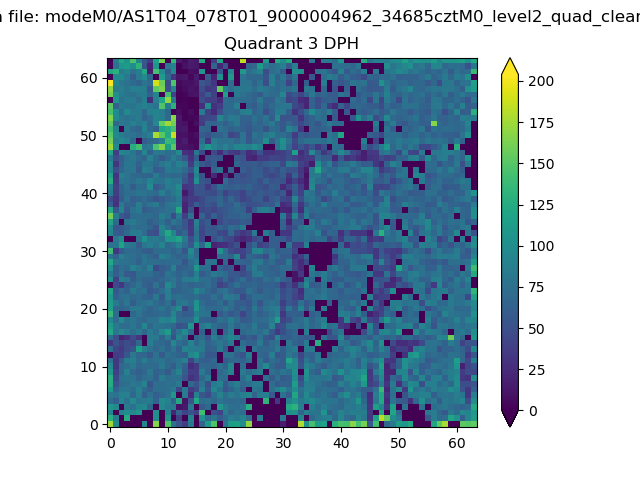 |
 |
Quadrant C |
| Plot type | Count rate plots | Images |
|---|---|---|
| Comparison with Poisson distribution Blue bars denote a histogram of data divided into 1 sec bins. Red curve is a Poisson curve with rate = median count rate of data. |
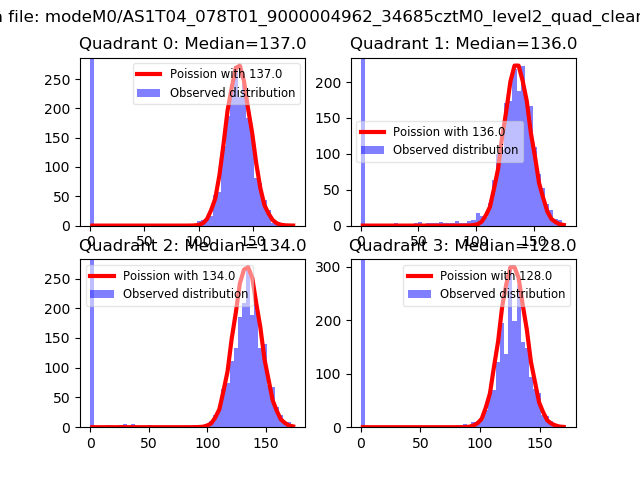 |
 |
| Quadrant-wise count rates Data is divided into 100 sec bins |
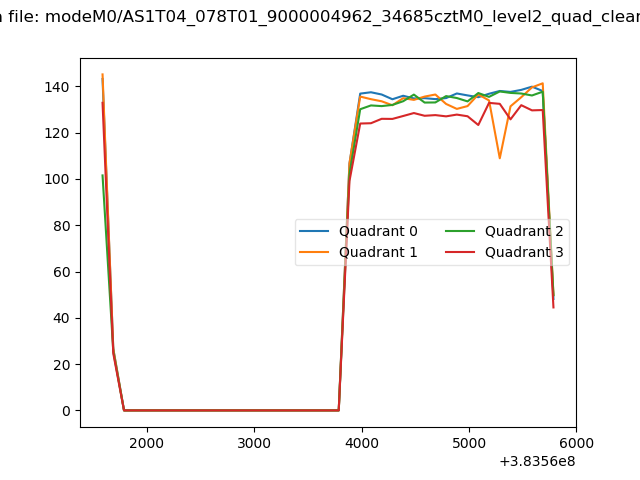 |
|
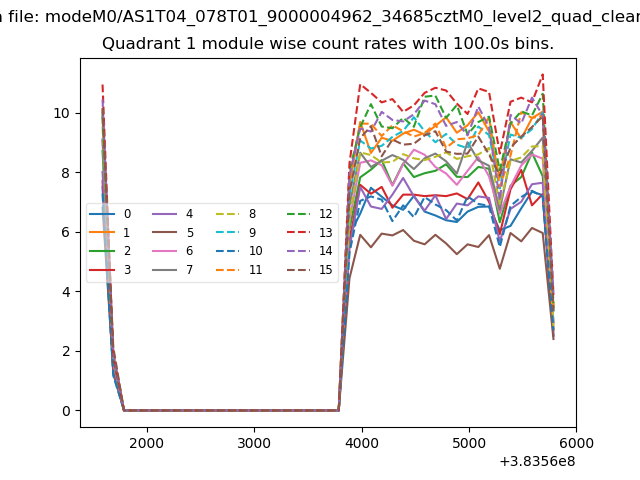
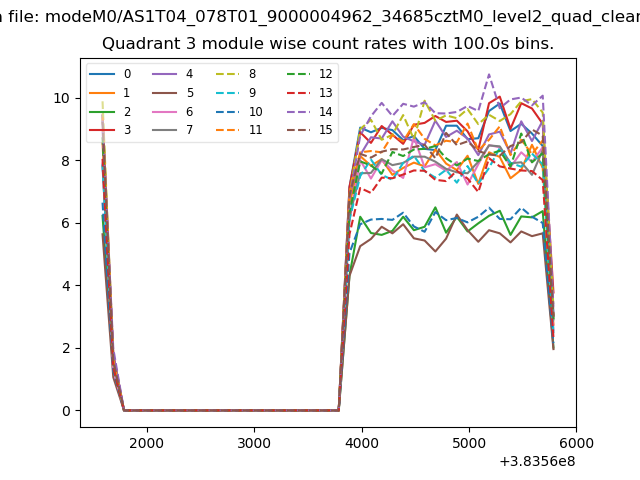
| Module-wise count rates for Quadrant A Data is divided into 100 sec bins |
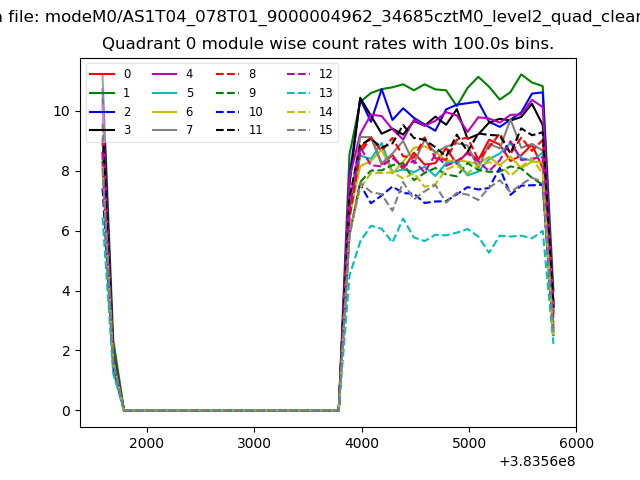 |
 |
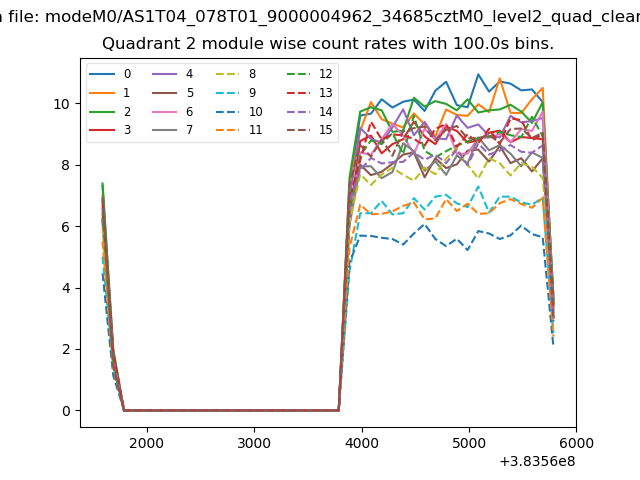
| Module-wise count rates for Quadrant B Data is divided into 100 sec bins |
 |
 |
| Module-wise count rates for Quadrant C Data is divided into 100 sec bins |
 |
 |
| Module-wise count rates for Quadrant D Data is divided into 100 sec bins |
 |
 |
| Parameter | Plot |
|---|---|
| CZT HV Monitor | 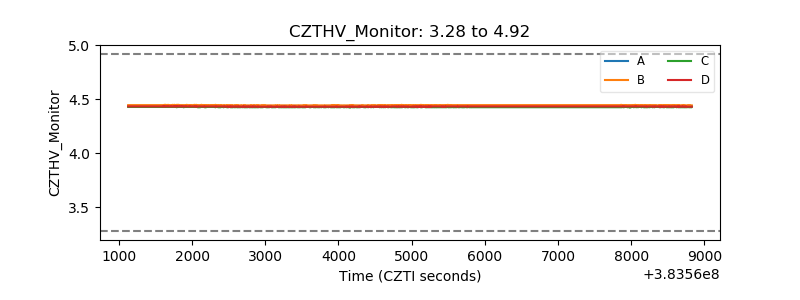 |
| D_VDD | 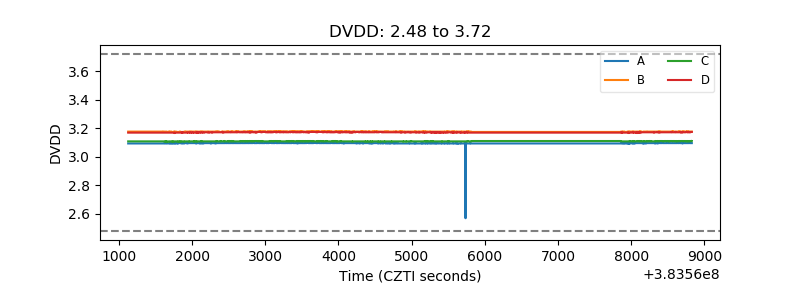 |
| Temperature 1 | 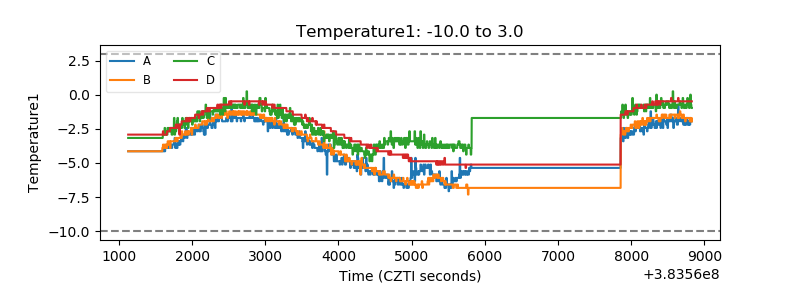 |
| Veto HV Monitor |  |
| Veto LLD |  |
| Alpha Counter | 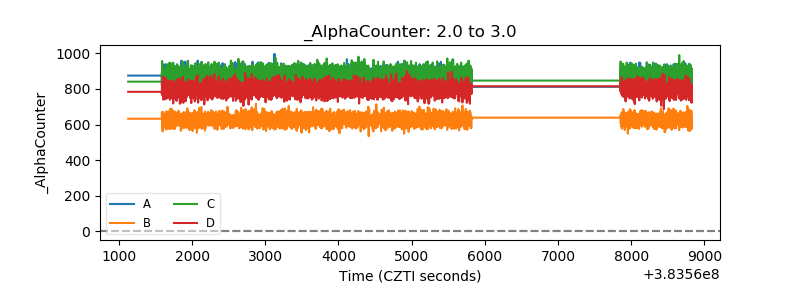 |
| _CPM_Rate | 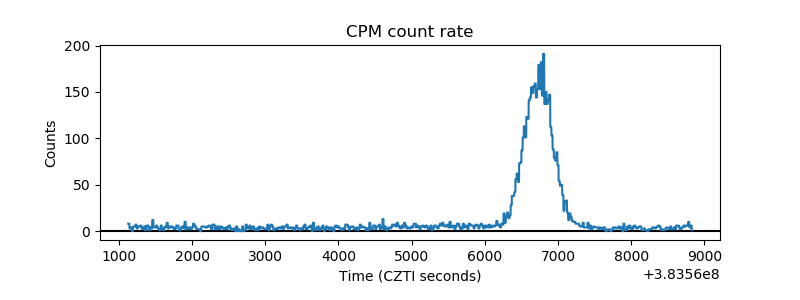 |
| CZT Counter | 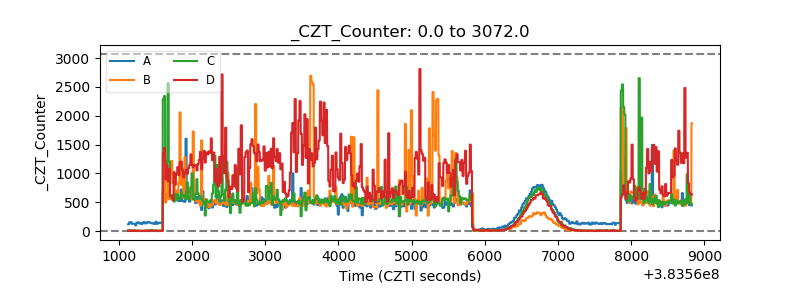 |
| +2.5 Volts monitor | 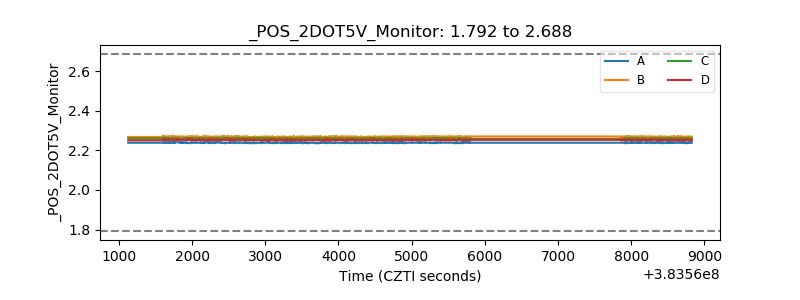 |
| +5 Volts monitor |  |
| _ROLL_ROT | 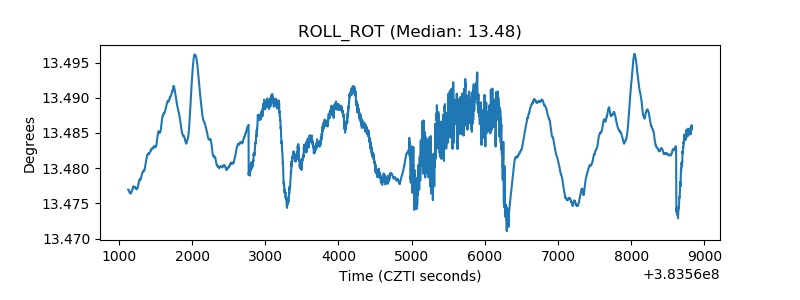 |
| _Roll_DEC | 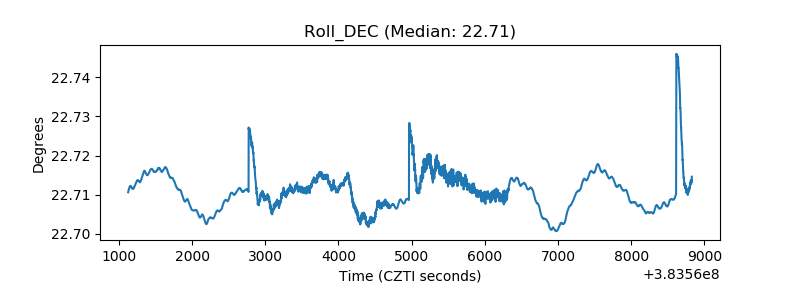 |
| _Roll_RA | 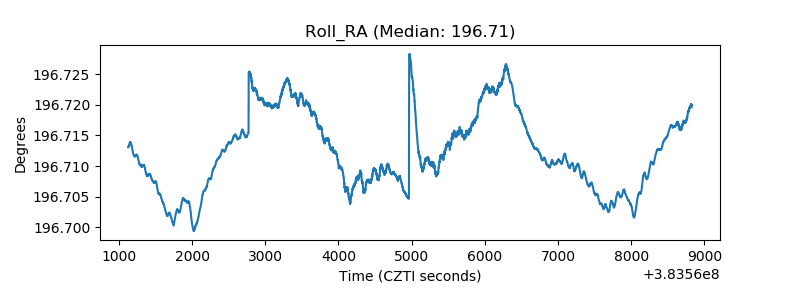 |
| Veto Counter | 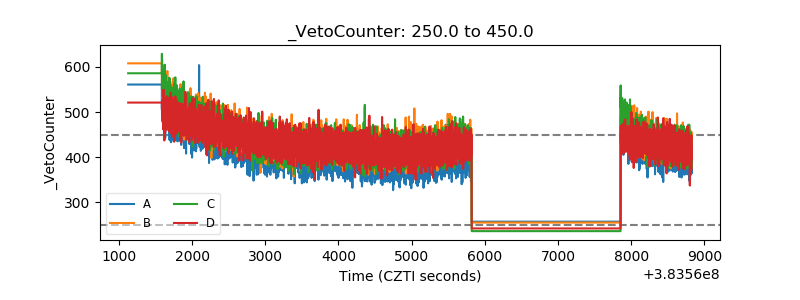 |