| Param | Original file | Final file |
|---|---|---|
| Filename | modeM0/AS1T04_078T01_9000004962_34684cztM0_level2.evt | modeM0/AS1T04_078T01_9000004962_34684cztM0_level2_quad_clean.evt |
| Size (bytes) | 467,634,240 | 49,345,920 |
| Size | 446.0 MB | 47.1 MB |
| Events in quadrant A | 2,557,327 | 299,421 |
| Events in quadrant B | 3,501,886 | 292,594 |
| Events in quadrant C | 2,873,937 | 288,688 |
| Events in quadrant D | 4,905,507 | 277,727 |
| Mode M0 | |||
|---|---|---|---|
| Quadrant | BADHDUFLAG | Total packets | Discarded packets |
| A | 0 | 10237 | 3 |
| B | 0 | 13307 | 2 |
| C | 0 | 11234 | 2 |
| D | 0 | 18044 | 2 |
| Mode M9 | |||
|---|---|---|---|
| Quadrant | BADHDUFLAG | Total packets | Discarded packets |
| A | 0 | 25 | 0 |
| B | 0 | 25 | 0 |
| C | 0 | 25 | 0 |
| D | 0 | 26 | 0 |
| Mode SS | |||
|---|---|---|---|
| Quadrant | BADHDUFLAG | Total packets | Discarded packets |
| A | 0 | 100 | 0 |
| B | 0 | 100 | 0 |
| C | 0 | 100 | 0 |
| D | 0 | 100 | 0 |
| Quadrant | Total seconds | Saturated seconds | Saturation percentage |
|---|---|---|---|
| A | 4768 | 12 | 0.251678% |
| B | 4768 | 283 | 5.935403% |
| C | 4768 | 62 | 1.300336% |
| D | 4768 | 344 | 7.214765% |
Noise dominated data is calculated using 1-second bins in cleaned event files. If a bin has >2000 counts, and if more than 50% of those come from <1% of pixels, then it is considered to be noise-dominated and hence unusable.
| Quadrant | # 1 sec bins | Bins with >0 counts | Bins with >2000 counts | High rate bins dominated by noise | Noise dominated (total time) | Noise dominated (detector-on time) | Marked lightcurve |
|---|---|---|---|---|---|---|---|
| A | 6922 | 4769 | 5 | 5 | 0.07% | 0.10% |  |
| B | 6922 | 4769 | 177 | 177 | 2.56% | 3.71% | 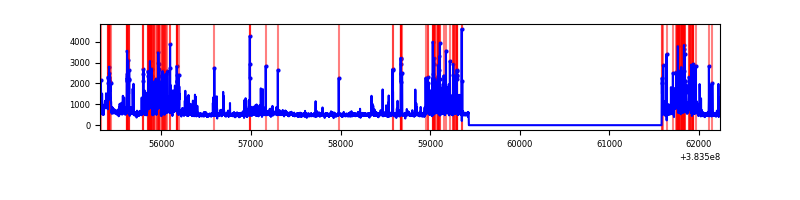 |
| C | 6922 | 4769 | 50 | 50 | 0.72% | 1.05% | 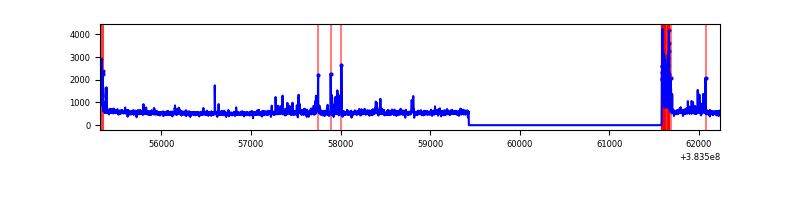 |
| D | 6922 | 4769 | 322 | 322 | 4.65% | 6.75% | 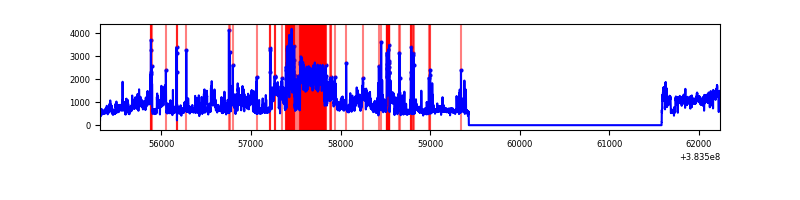 |
Top three noisy pixels from each quadrant. If the there are fewer than three noisy pixels in the level2.evt file, extra rows are filled as -1
| Pixel properties | Quadrant properties | ||||||
|---|---|---|---|---|---|---|---|
| Quadrant | DetID | PixID | Counts | Sigma | Mean | Median | Sigma |
| A | 15 | 169 | 68478 | 554.15 | 614 | 603 | 122.5 |
| A | 10 | 83 | 46608 | 375.59 | 614 | 603 | 122.5 |
| A | 15 | 174 | 31400 | 251.43 | 614 | 603 | 122.5 |
| B | 5 | 172 | 713475 | 6362.7 | 591 | 577 | 112.0 |
| B | 5 | 255 | 207688 | 1848.49 | 591 | 577 | 112.0 |
| B | 4 | 81 | 107397 | 953.38 | 591 | 577 | 112.0 |
| C | 15 | 214 | 205716 | 1532.0 | 580 | 584 | 133.9 |
| C | 0 | 10 | 198979 | 1481.69 | 580 | 584 | 133.9 |
| C | 0 | 207 | 137488 | 1022.45 | 580 | 584 | 133.9 |
| D | 8 | 195 | 1491341 | 10487.83 | 581 | 567 | 142.1 |
| D | 7 | 38 | 786737 | 5530.83 | 581 | 567 | 142.1 |
| D | 2 | 250 | 62811 | 437.9 | 581 | 567 | 142.1 |
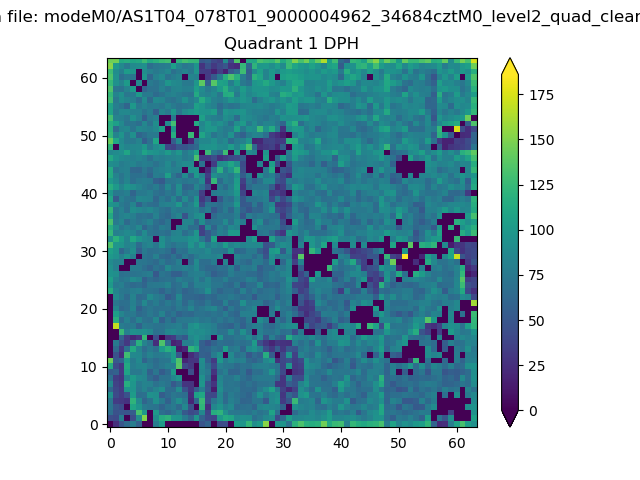
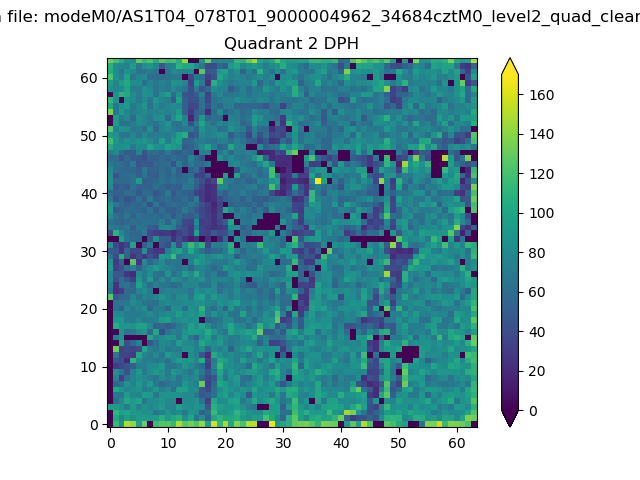
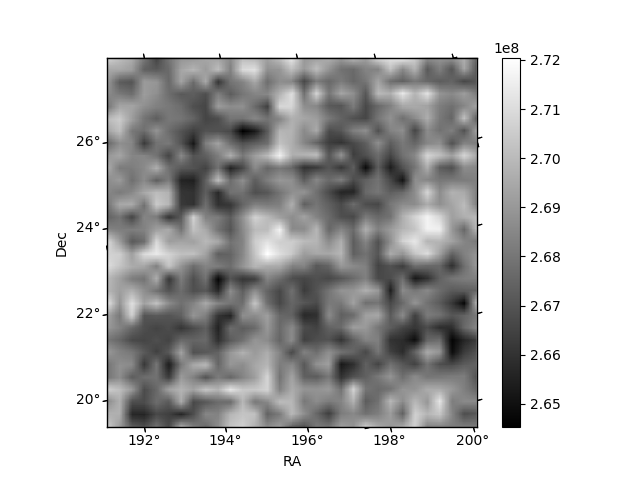
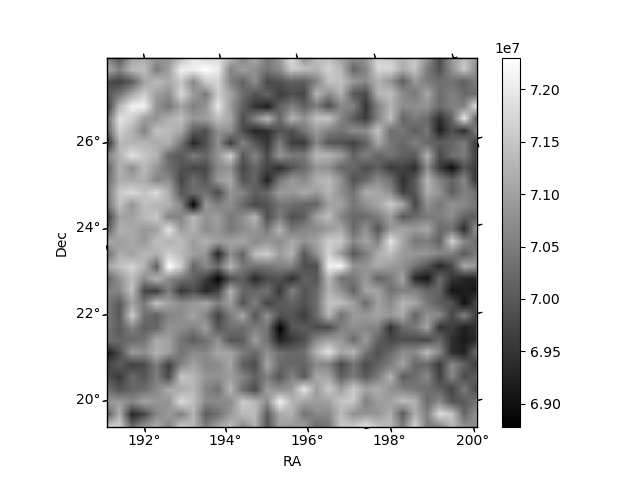
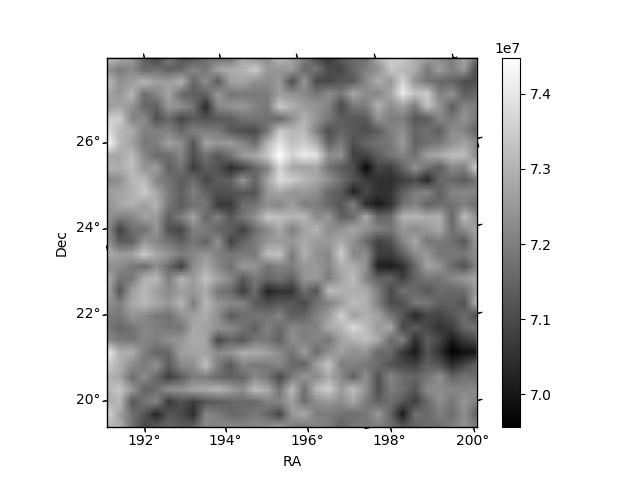
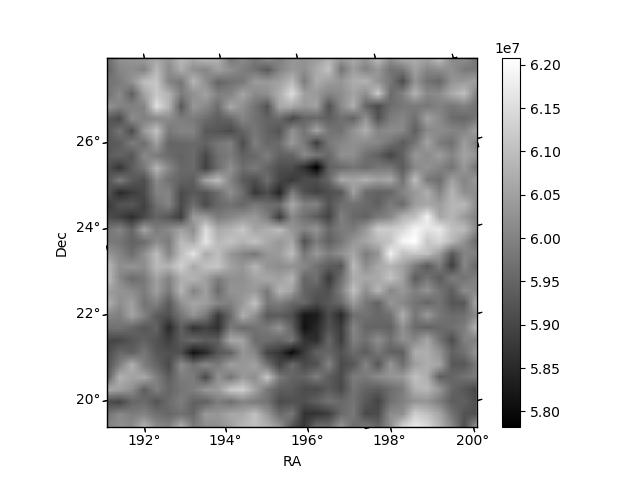
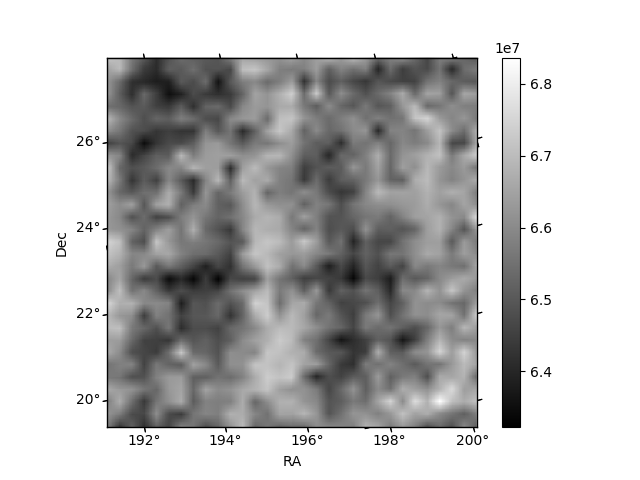
Histogram calculated using DETX and DETY for each event in the final _common_clean file
| Quadrant A | 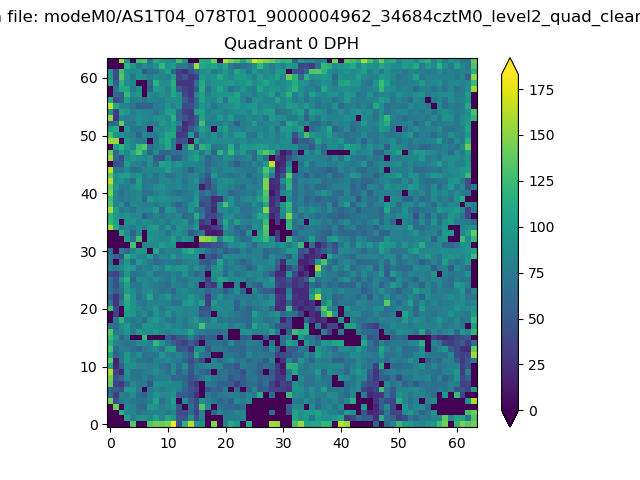 |
 |
Quadrant B |
|---|---|---|---|
| Quadrant D | 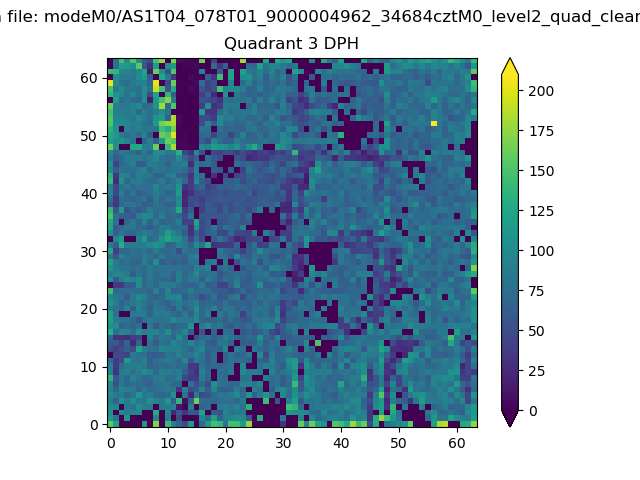 |
 |
Quadrant C |
| Plot type | Count rate plots | Images |
|---|---|---|
| Comparison with Poisson distribution Blue bars denote a histogram of data divided into 1 sec bins. Red curve is a Poisson curve with rate = median count rate of data. |
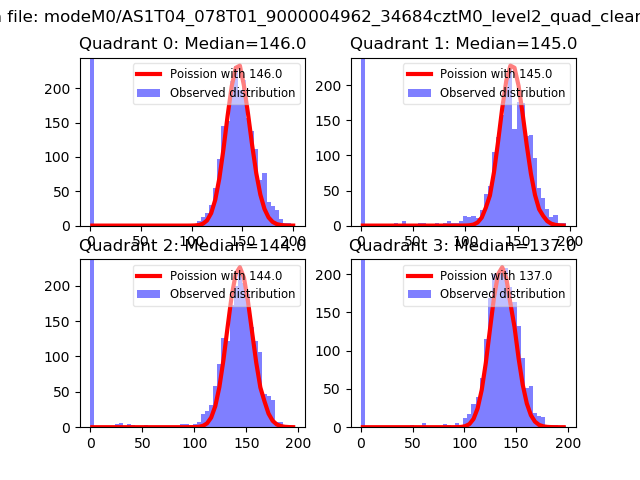 |
 |
| Quadrant-wise count rates Data is divided into 100 sec bins |
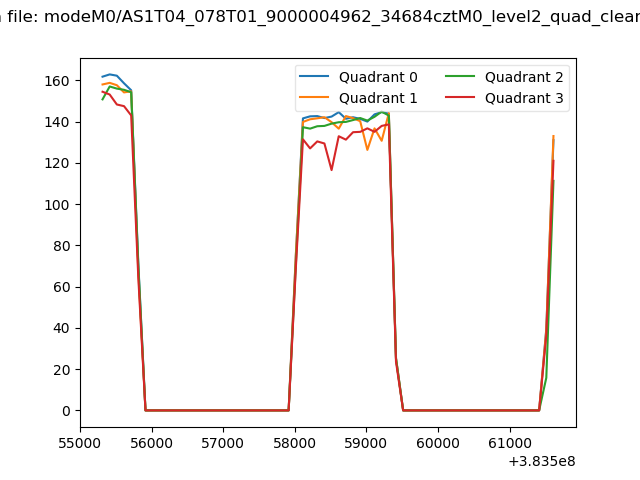 |
|
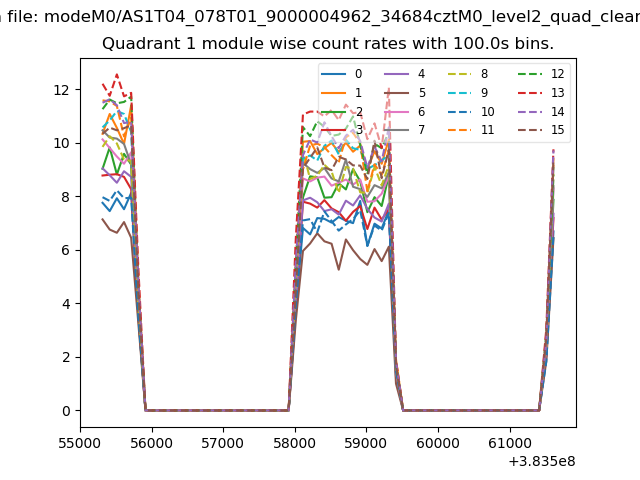
| Module-wise count rates for Quadrant A Data is divided into 100 sec bins |
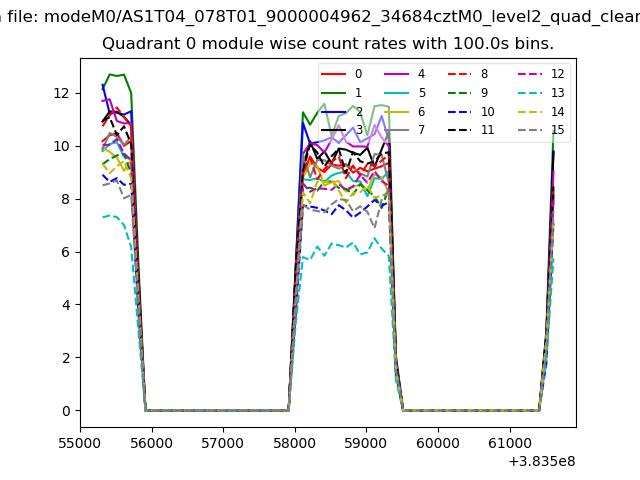 |
 |
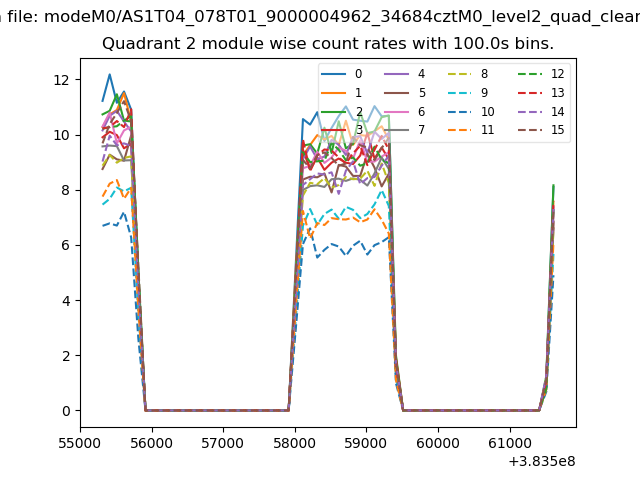
| Module-wise count rates for Quadrant B Data is divided into 100 sec bins |
 |
 |
| Module-wise count rates for Quadrant C Data is divided into 100 sec bins |
 |
 |
| Module-wise count rates for Quadrant D Data is divided into 100 sec bins |
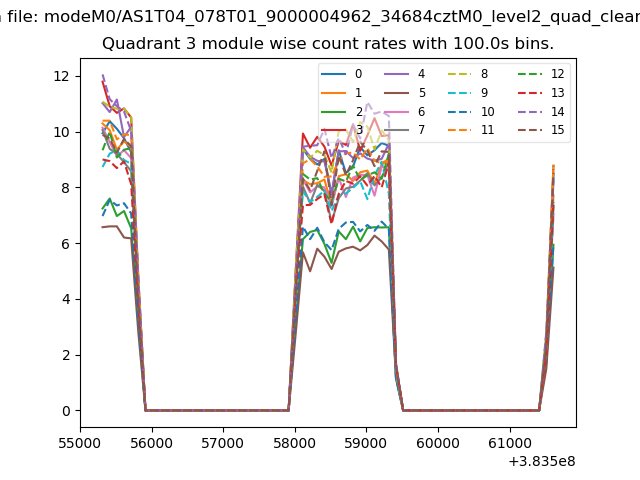 |
 |
| Parameter | Plot |
|---|---|
| CZT HV Monitor |  |
| D_VDD | 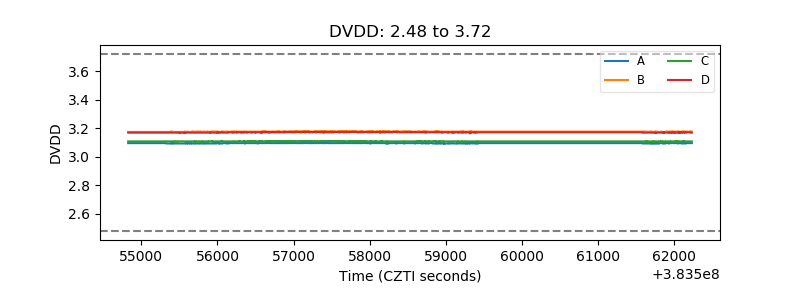 |
| Temperature 1 | 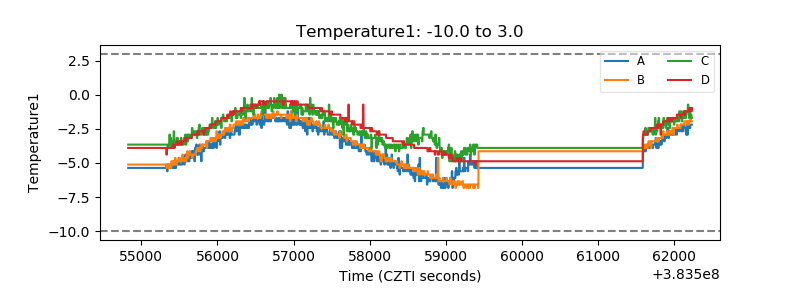 |
| Veto HV Monitor | 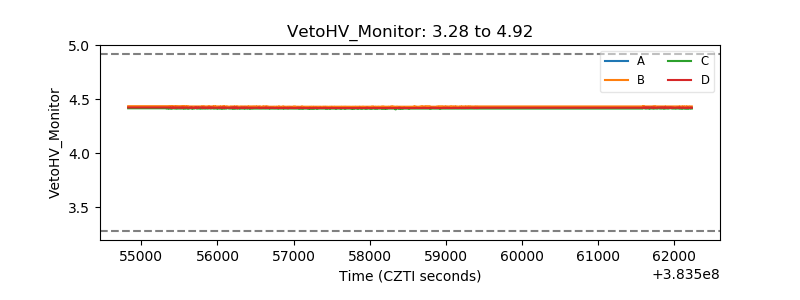 |
| Veto LLD | 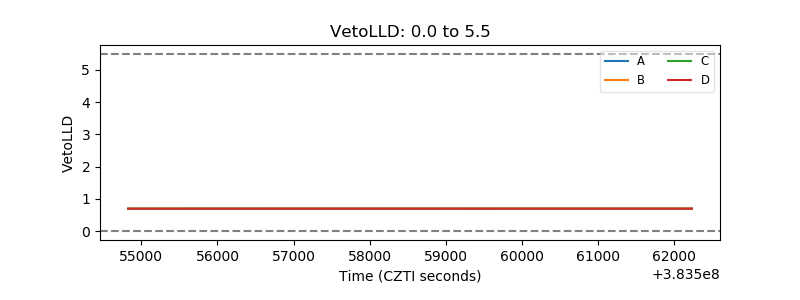 |
| Alpha Counter | 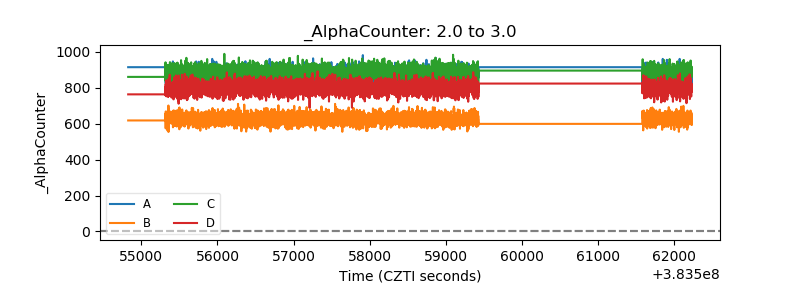 |
| _CPM_Rate | 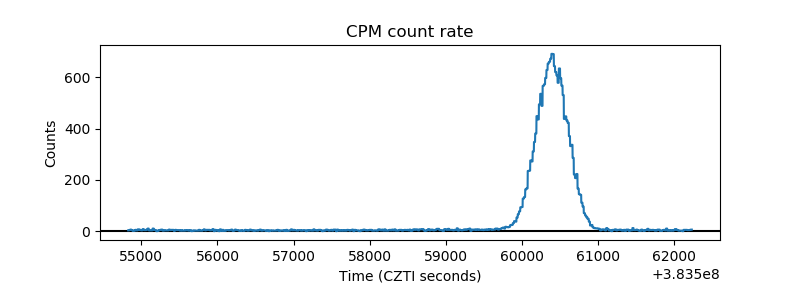 |
| CZT Counter | 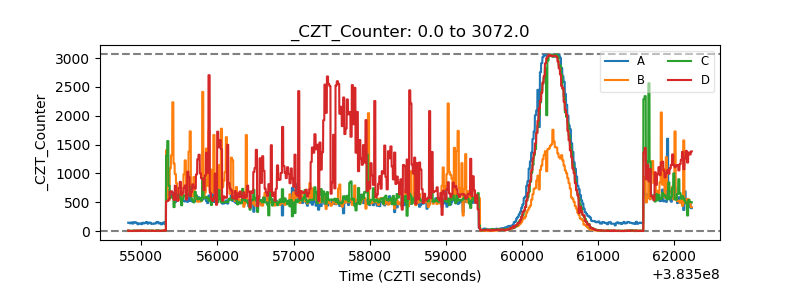 |
| +2.5 Volts monitor | 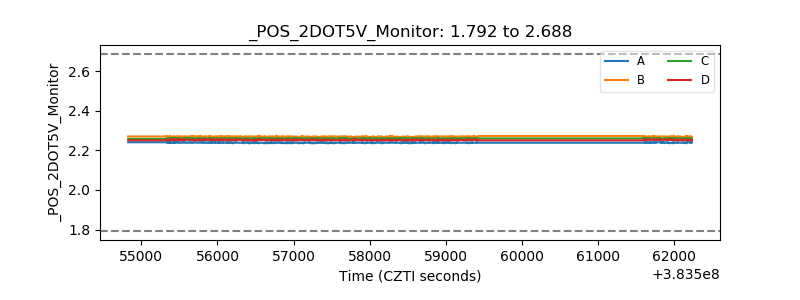 |
| +5 Volts monitor | 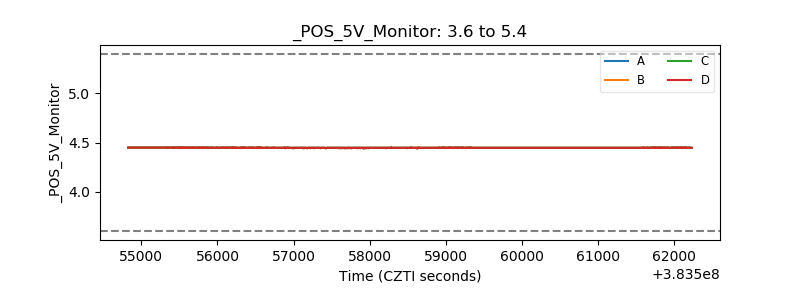 |
| _ROLL_ROT | 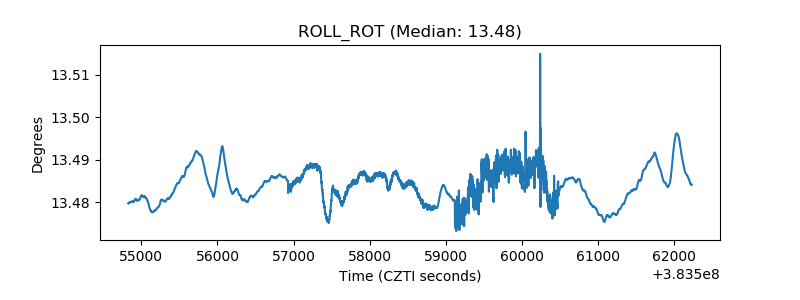 |
| _Roll_DEC | 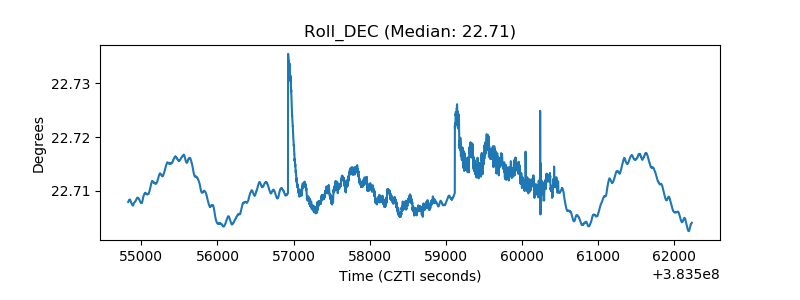 |
| _Roll_RA | 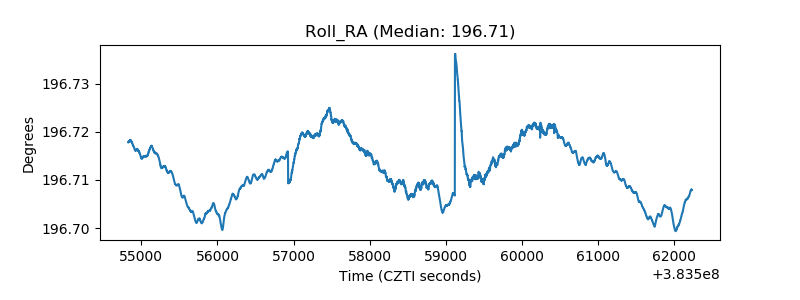 |
| Veto Counter | 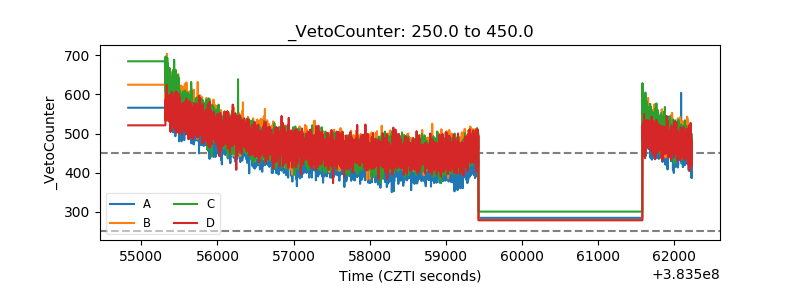 |