| Param | Original file | Final file |
|---|---|---|
| Filename | modeM0/AS1T04_078T01_9000004962_34682cztM0_level2.evt | modeM0/AS1T04_078T01_9000004962_34682cztM0_level2_quad_clean.evt |
| Size (bytes) | 511,594,560 | 67,250,880 |
| Size | 487.9 MB | 64.1 MB |
| Events in quadrant A | 2,795,833 | 434,667 |
| Events in quadrant B | 4,076,316 | 420,115 |
| Events in quadrant C | 3,136,418 | 425,569 |
| Events in quadrant D | 5,138,225 | 396,500 |
| Mode M0 | |||
|---|---|---|---|
| Quadrant | BADHDUFLAG | Total packets | Discarded packets |
| A | 0 | 11177 | 2 |
| B | 0 | 15237 | 1 |
| C | 0 | 12454 | 1 |
| D | 0 | 18921 | 1 |
| Mode M9 | |||
|---|---|---|---|
| Quadrant | BADHDUFLAG | Total packets | Discarded packets |
| A | 0 | 21 | 0 |
| B | 0 | 21 | 0 |
| C | 0 | 21 | 0 |
| D | 0 | 21 | 0 |
| Mode SS | |||
|---|---|---|---|
| Quadrant | BADHDUFLAG | Total packets | Discarded packets |
| A | 0 | 102 | 0 |
| B | 0 | 102 | 0 |
| C | 0 | 102 | 0 |
| D | 0 | 102 | 0 |
| Quadrant | Total seconds | Saturated seconds | Saturation percentage |
|---|---|---|---|
| A | 5136 | 13 | 0.253115% |
| B | 5136 | 486 | 9.462617% |
| C | 5136 | 31 | 0.603583% |
| D | 5136 | 145 | 2.823209% |
Noise dominated data is calculated using 1-second bins in cleaned event files. If a bin has >2000 counts, and if more than 50% of those come from <1% of pixels, then it is considered to be noise-dominated and hence unusable.
| Quadrant | # 1 sec bins | Bins with >0 counts | Bins with >2000 counts | High rate bins dominated by noise | Noise dominated (total time) | Noise dominated (detector-on time) | Marked lightcurve |
|---|---|---|---|---|---|---|---|
| A | 7198 | 5137 | 3 | 3 | 0.04% | 0.06% | 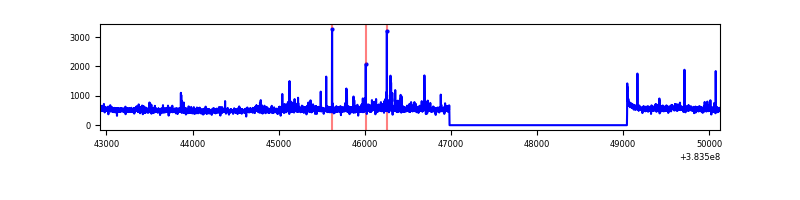 |
| B | 7198 | 5137 | 353 | 353 | 4.90% | 6.87% | 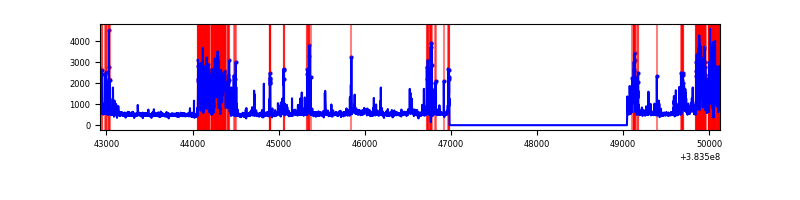 |
| C | 7198 | 5137 | 16 | 16 | 0.22% | 0.31% | 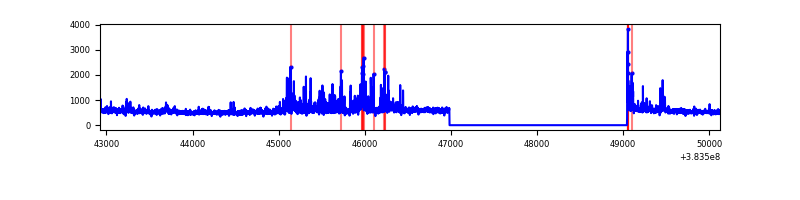 |
| D | 7198 | 5137 | 76 | 76 | 1.06% | 1.48% | 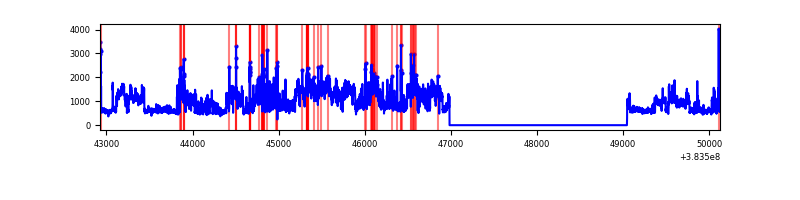 |
Top three noisy pixels from each quadrant. If the there are fewer than three noisy pixels in the level2.evt file, extra rows are filled as -1
| Pixel properties | Quadrant properties | ||||||
|---|---|---|---|---|---|---|---|
| Quadrant | DetID | PixID | Counts | Sigma | Mean | Median | Sigma |
| A | 15 | 169 | 114335 | 853.36 | 669 | 657 | 133.2 |
| A | 10 | 83 | 33317 | 245.17 | 669 | 657 | 133.2 |
| A | 9 | 143 | 22437 | 163.5 | 669 | 657 | 133.2 |
| B | 5 | 172 | 850810 | 7129.67 | 632 | 618 | 119.2 |
| B | 5 | 255 | 454760 | 3808.41 | 632 | 618 | 119.2 |
| B | 0 | 190 | 121465 | 1013.42 | 632 | 618 | 119.2 |
| C | 15 | 159 | 282214 | 1926.35 | 633 | 640 | 146.2 |
| C | 15 | 214 | 220039 | 1500.98 | 633 | 640 | 146.2 |
| C | 14 | 67 | 73241 | 496.69 | 633 | 640 | 146.2 |
| D | 8 | 195 | 2147232 | 13936.57 | 635 | 619 | 154.0 |
| D | 2 | 249 | 176913 | 1144.56 | 635 | 619 | 154.0 |
| D | 10 | 118 | 53381 | 342.55 | 635 | 619 | 154.0 |
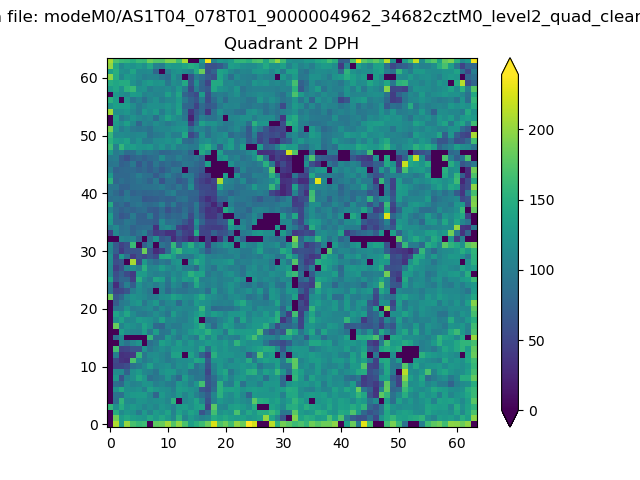
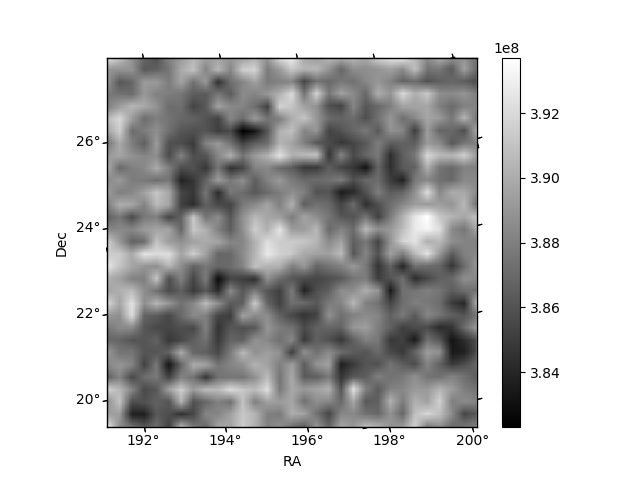
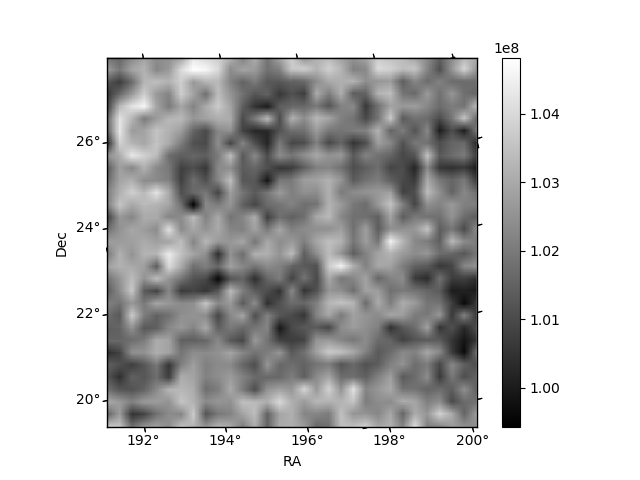
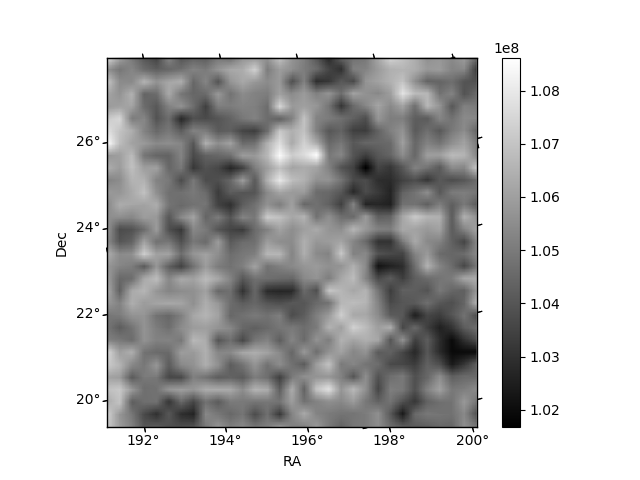
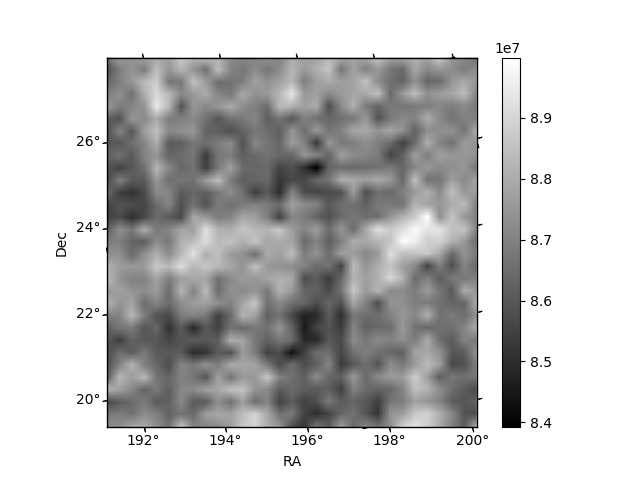
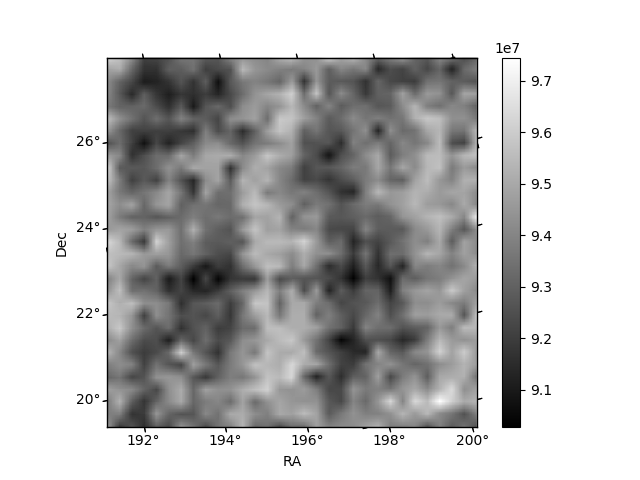
Histogram calculated using DETX and DETY for each event in the final _common_clean file
| Quadrant A | 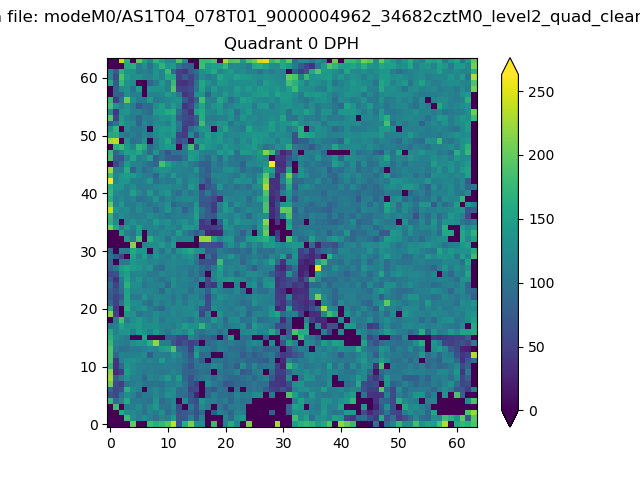 |
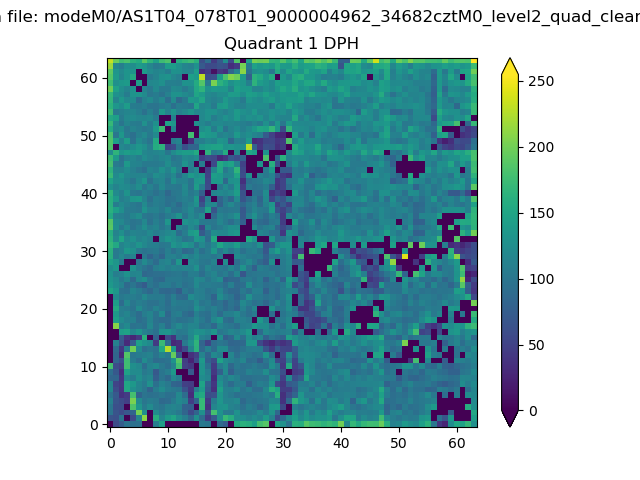 |
Quadrant B |
|---|---|---|---|
| Quadrant D | 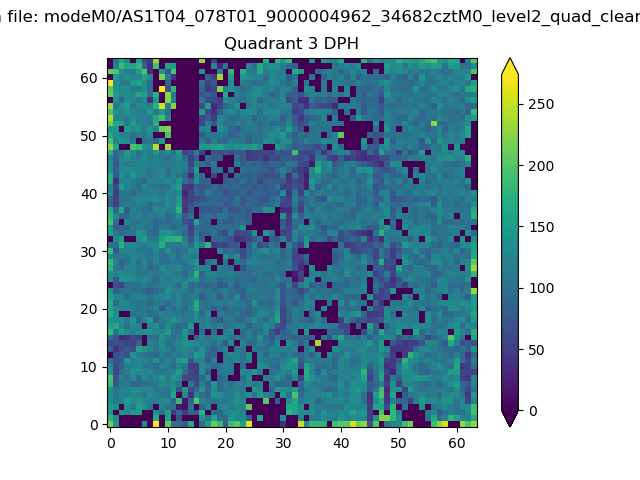 |
 |
Quadrant C |
| Plot type | Count rate plots | Images |
|---|---|---|
| Comparison with Poisson distribution Blue bars denote a histogram of data divided into 1 sec bins. Red curve is a Poisson curve with rate = median count rate of data. |
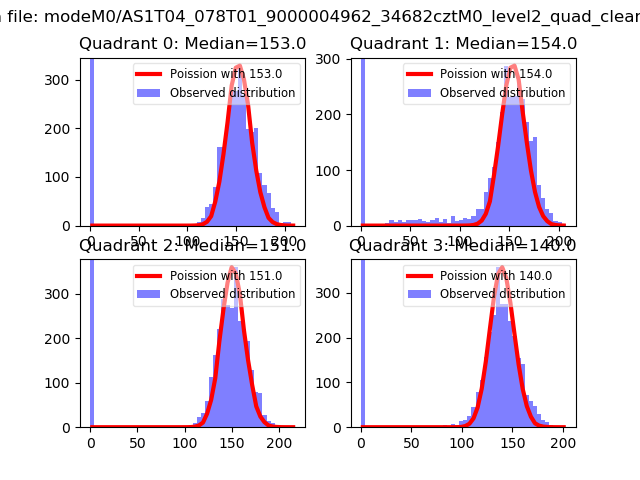 |
 |
| Quadrant-wise count rates Data is divided into 100 sec bins |
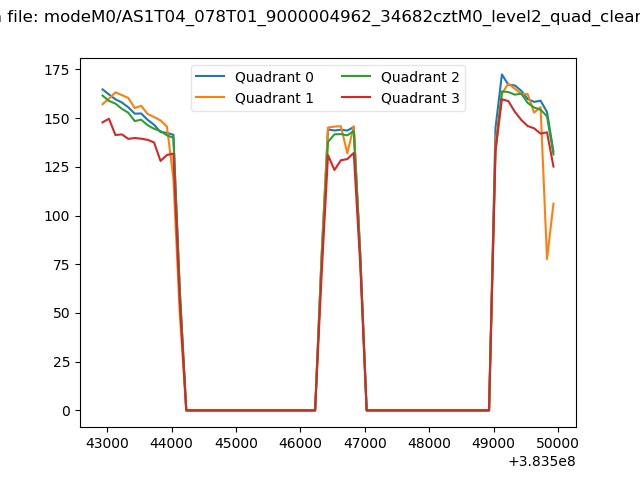 |
|
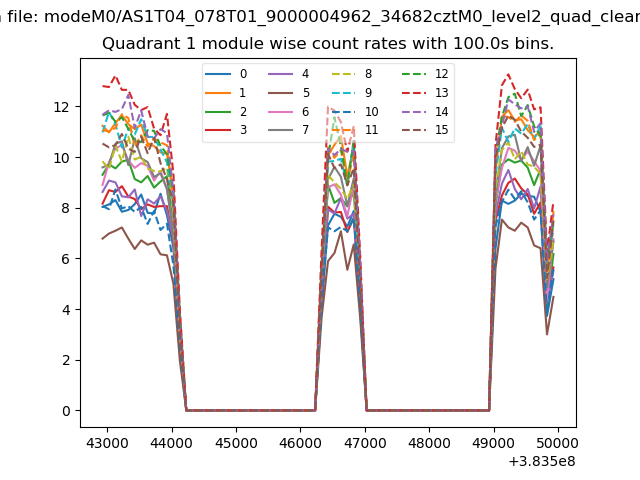
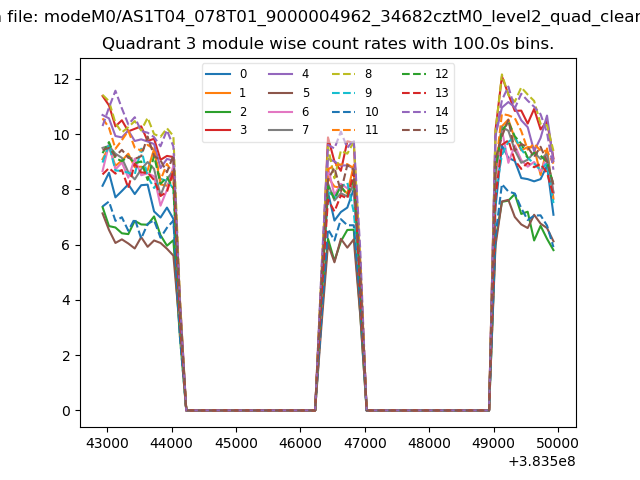
| Module-wise count rates for Quadrant A Data is divided into 100 sec bins |
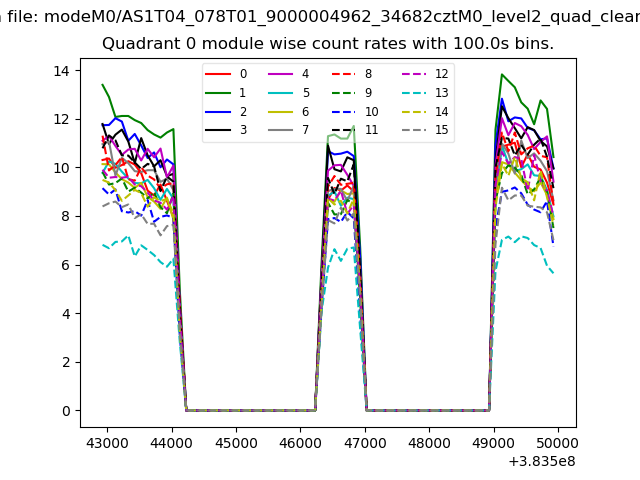 |
 |
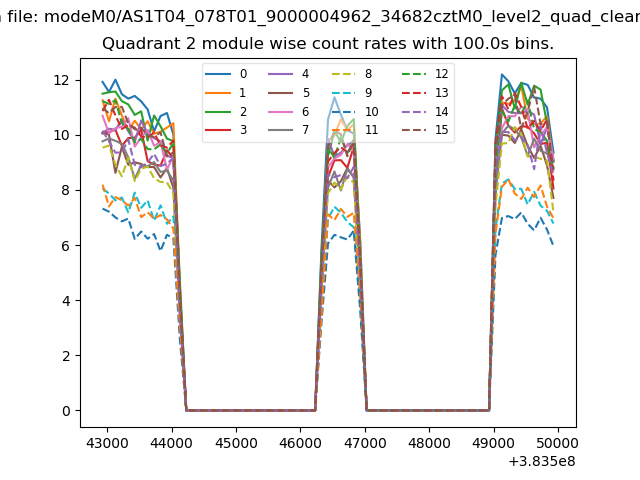
| Module-wise count rates for Quadrant B Data is divided into 100 sec bins |
 |
 |
| Module-wise count rates for Quadrant C Data is divided into 100 sec bins |
 |
 |
| Module-wise count rates for Quadrant D Data is divided into 100 sec bins |
 |
 |
| Parameter | Plot |
|---|---|
| CZT HV Monitor | 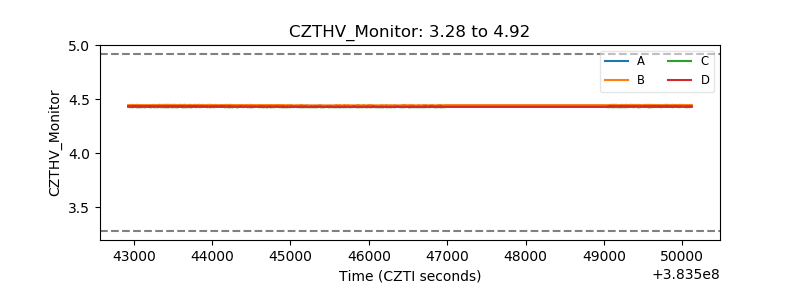 |
| D_VDD | 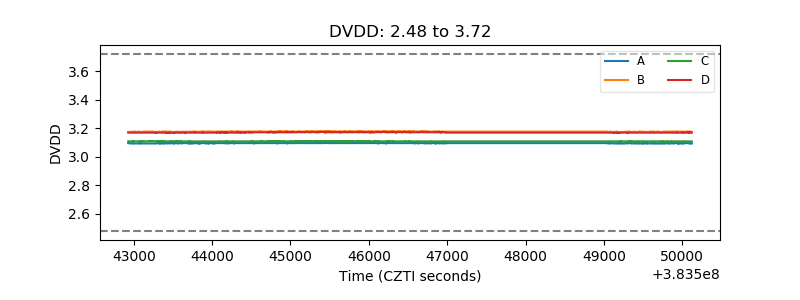 |
| Temperature 1 | 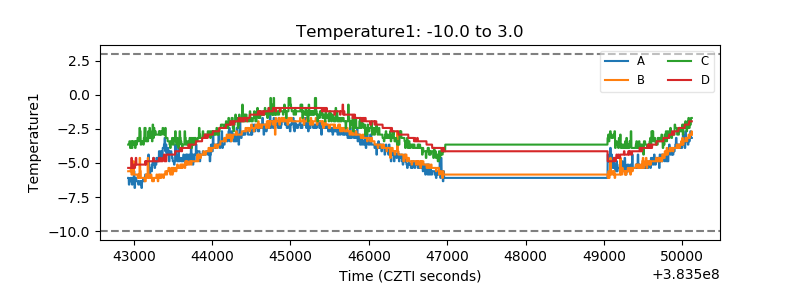 |
| Veto HV Monitor | 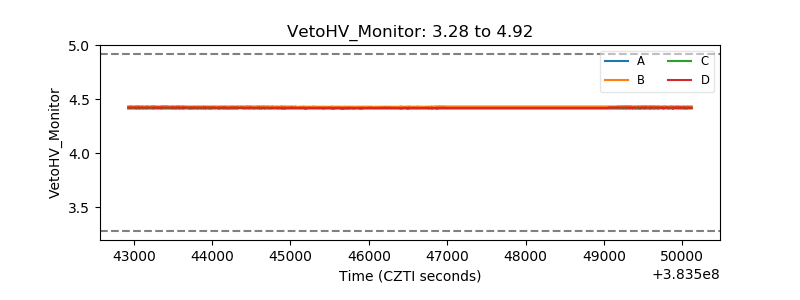 |
| Veto LLD | 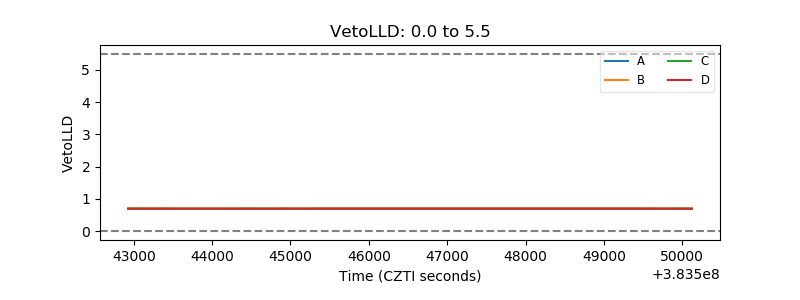 |
| Alpha Counter | 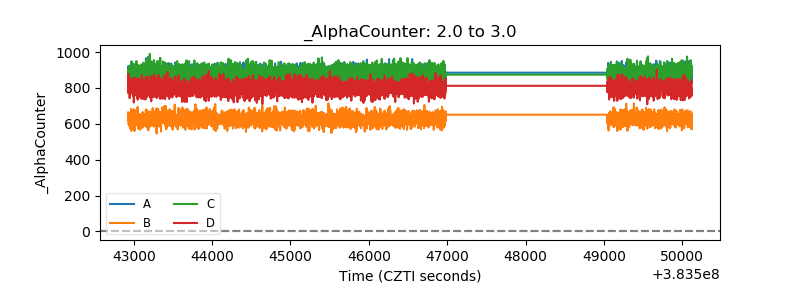 |
| _CPM_Rate | 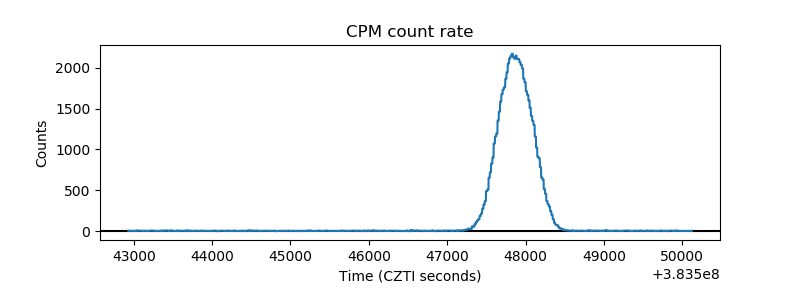 |
| CZT Counter | 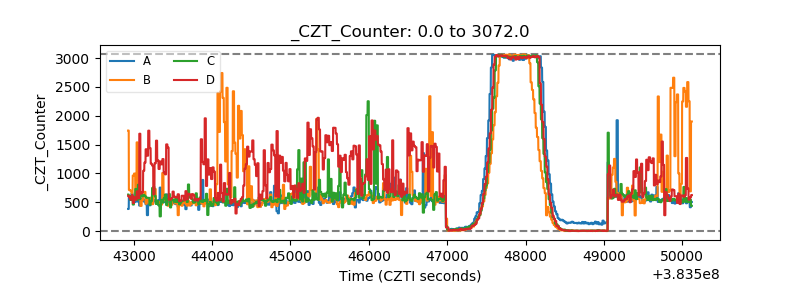 |
| +2.5 Volts monitor | 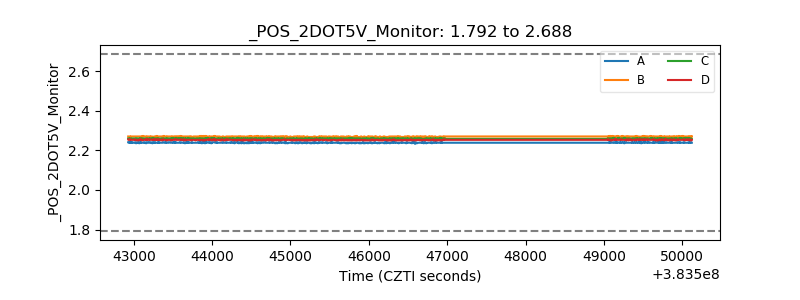 |
| +5 Volts monitor | 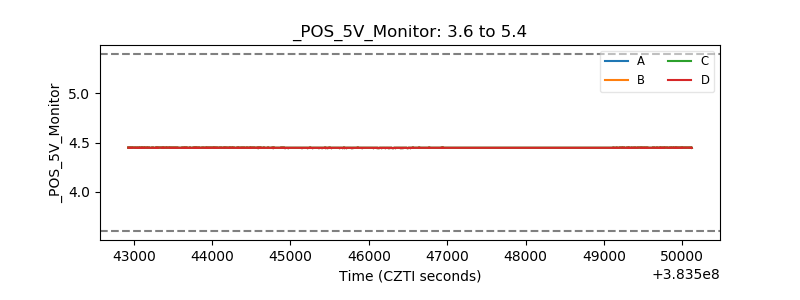 |
| _ROLL_ROT | 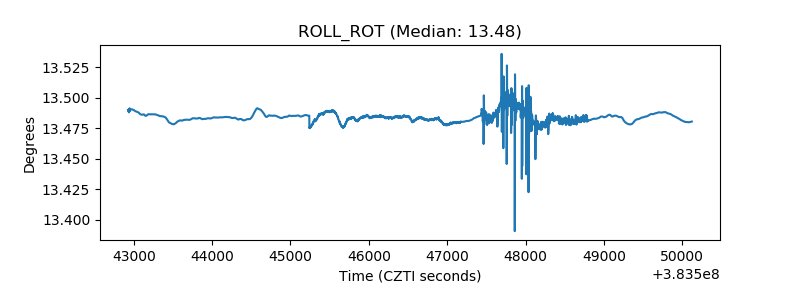 |
| _Roll_DEC | 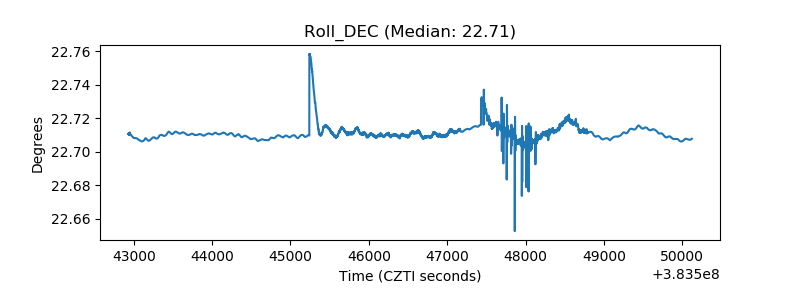 |
| _Roll_RA | 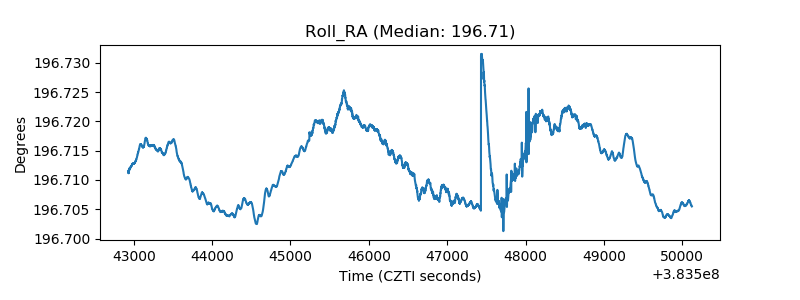 |
| Veto Counter | 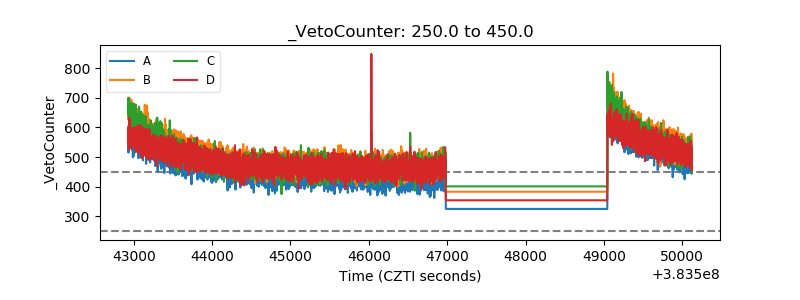 |