| Param | Original file | Final file |
|---|---|---|
| Filename | modeM0/AS1T04_078T01_9000004962_34680cztM0_level2.evt | modeM0/AS1T04_078T01_9000004962_34680cztM0_level2_quad_clean.evt |
| Size (bytes) | 421,027,200 | 64,203,840 |
| Size | 401.5 MB | 61.2 MB |
| Events in quadrant A | 2,554,469 | 417,971 |
| Events in quadrant B | 4,061,450 | 390,474 |
| Events in quadrant C | 2,393,740 | 420,446 |
| Events in quadrant D | 3,429,654 | 392,900 |
| Mode M0 | |||
|---|---|---|---|
| Quadrant | BADHDUFLAG | Total packets | Discarded packets |
| A | 0 | 12417 | 1736 |
| B | 0 | 17331 | 2384 |
| C | 0 | 11159 | 1368 |
| D | 0 | 16020 | 2861 |
| Mode M9 | |||
|---|---|---|---|
| Quadrant | BADHDUFLAG | Total packets | Discarded packets |
| A | 0 | 22 | 5 |
| B | 0 | 22 | 4 |
| C | 0 | 21 | 3 |
| D | 0 | 24 | 5 |
| Mode SS | |||
|---|---|---|---|
| Quadrant | BADHDUFLAG | Total packets | Discarded packets |
| A | 0 | 107 | 11 |
| B | 0 | 104 | 15 |
| C | 0 | 105 | 10 |
| D | 0 | 105 | 11 |
| Quadrant | Total seconds | Saturated seconds | Saturation percentage |
|---|---|---|---|
| A | 4612 | 54 | 1.170859% |
| B | 4538 | 676 | 14.896430% |
| C | 4639 | 16 | 0.344902% |
| D | 4511 | 63 | 1.396586% |
Noise dominated data is calculated using 1-second bins in cleaned event files. If a bin has >2000 counts, and if more than 50% of those come from <1% of pixels, then it is considered to be noise-dominated and hence unusable.
| Quadrant | # 1 sec bins | Bins with >0 counts | Bins with >2000 counts | High rate bins dominated by noise | Noise dominated (total time) | Noise dominated (detector-on time) | Marked lightcurve |
|---|---|---|---|---|---|---|---|
| A | 7365 | 4832 | 38 | 38 | 0.52% | 0.79% | 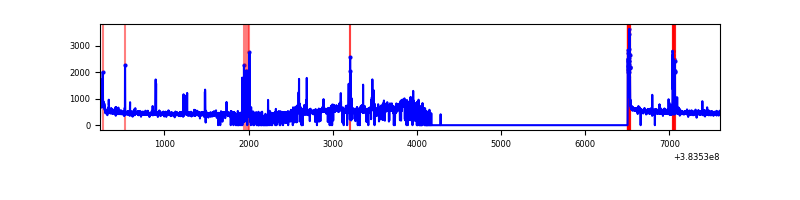 |
| B | 7365 | 4766 | 486 | 486 | 6.60% | 10.20% | 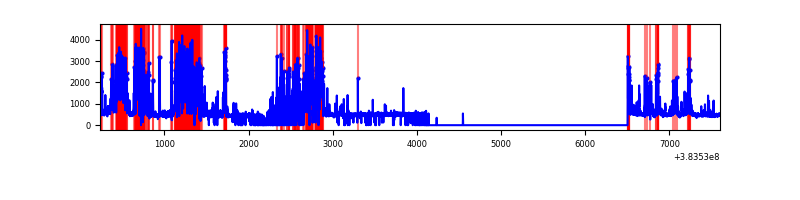 |
| C | 7365 | 4867 | 10 | 10 | 0.14% | 0.21% |  |
| D | 7365 | 4751 | 53 | 53 | 0.72% | 1.12% | 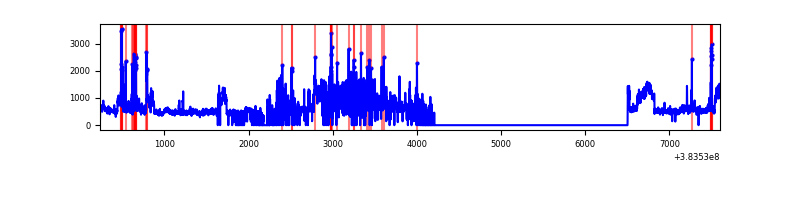 |
Top three noisy pixels from each quadrant. If the there are fewer than three noisy pixels in the level2.evt file, extra rows are filled as -1
| Pixel properties | Quadrant properties | ||||||
|---|---|---|---|---|---|---|---|
| Quadrant | DetID | PixID | Counts | Sigma | Mean | Median | Sigma |
| A | 15 | 169 | 266863 | 2464.03 | 539 | 529 | 108.1 |
| A | 15 | 174 | 82228 | 755.85 | 539 | 529 | 108.1 |
| A | 10 | 83 | 43362 | 396.28 | 539 | 529 | 108.1 |
| B | 5 | 172 | 1532408 | 16092.34 | 497 | 484 | 95.2 |
| B | 5 | 255 | 441604 | 4633.82 | 497 | 484 | 95.2 |
| B | 0 | 190 | 88171 | 921.12 | 497 | 484 | 95.2 |
| C | 15 | 214 | 199687 | 1644.0 | 525 | 529 | 121.1 |
| C | 0 | 10 | 64856 | 531.0 | 525 | 529 | 121.1 |
| C | 14 | 67 | 43518 | 354.86 | 525 | 529 | 121.1 |
| D | 8 | 195 | 1091205 | 8803.82 | 506 | 492 | 123.9 |
| D | 2 | 249 | 134403 | 1080.88 | 506 | 492 | 123.9 |
| D | 7 | 223 | 55443 | 443.54 | 506 | 492 | 123.9 |
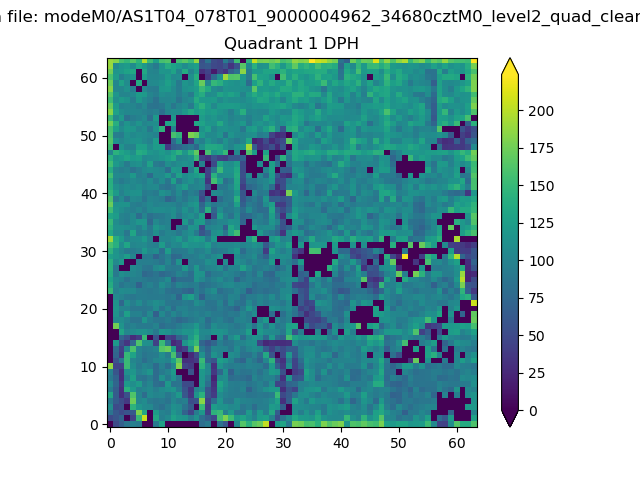
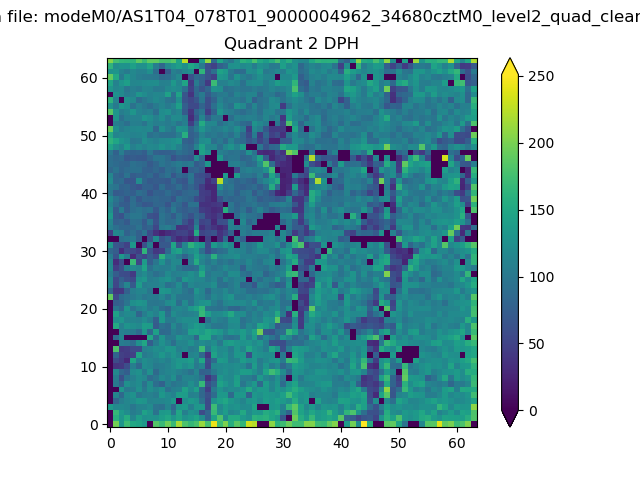
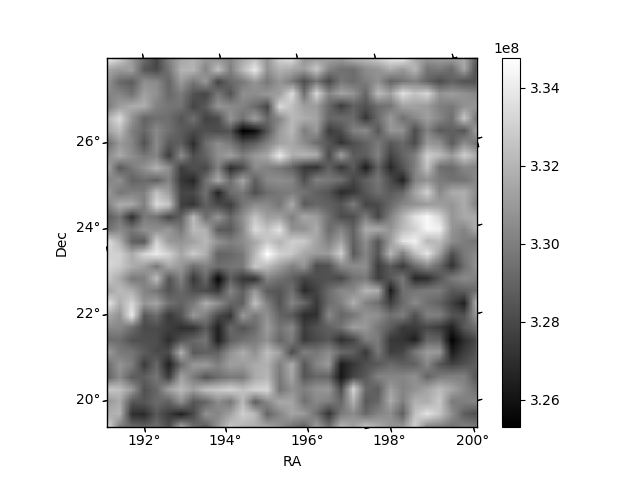
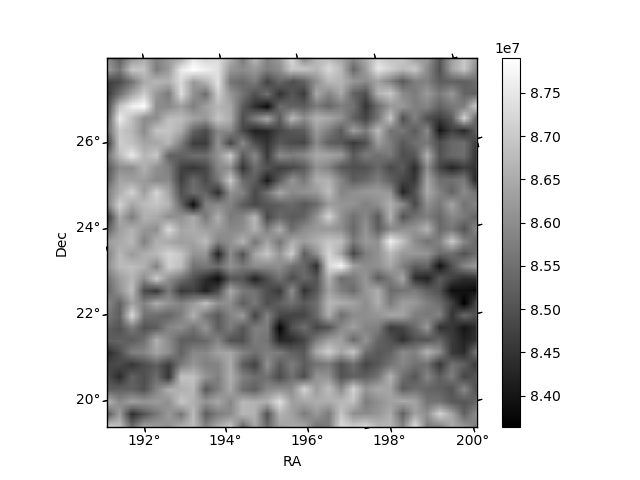
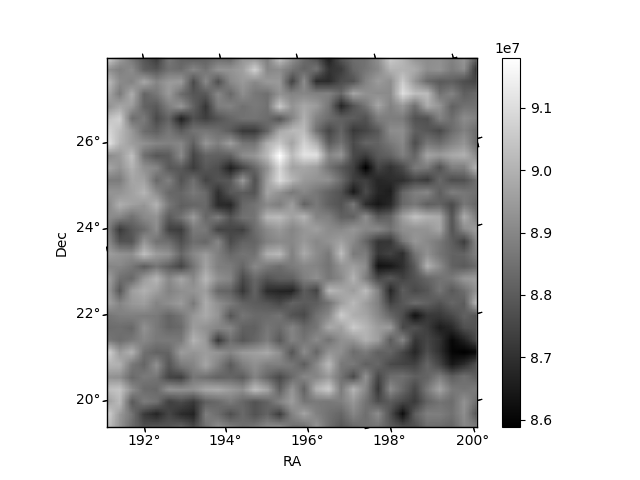
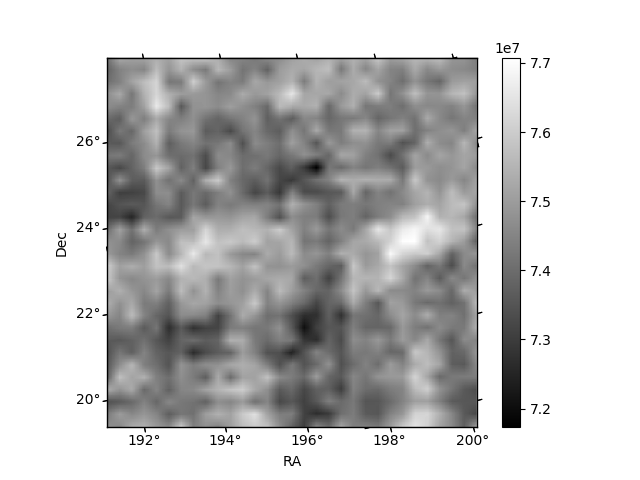
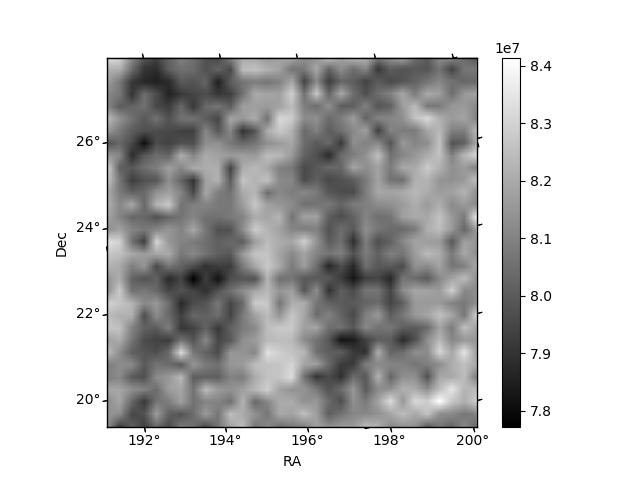
Histogram calculated using DETX and DETY for each event in the final _common_clean file
| Quadrant A | 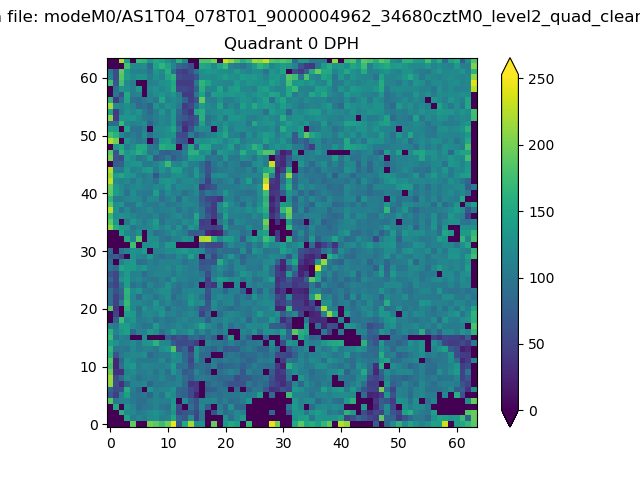 |
 |
Quadrant B |
|---|---|---|---|
| Quadrant D | 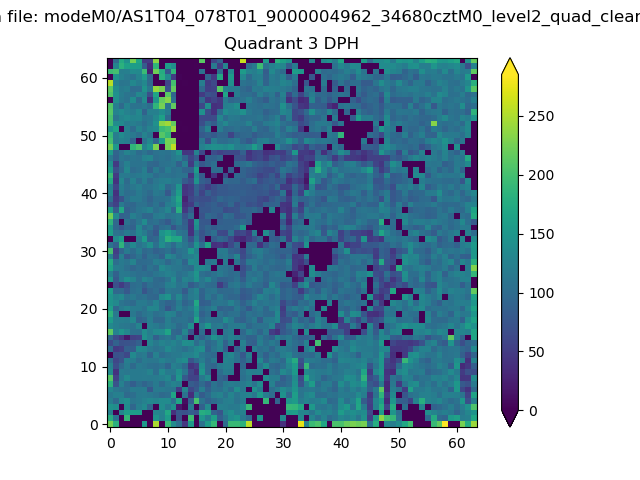 |
 |
Quadrant C |
| Plot type | Count rate plots | Images |
|---|---|---|
| Comparison with Poisson distribution Blue bars denote a histogram of data divided into 1 sec bins. Red curve is a Poisson curve with rate = median count rate of data. |
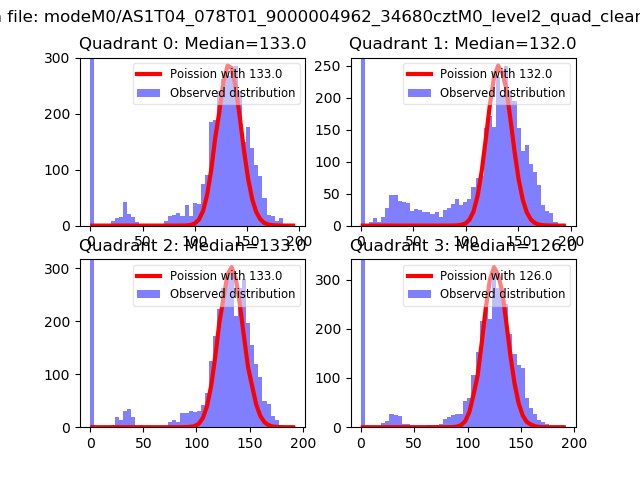 |
 |
| Quadrant-wise count rates Data is divided into 100 sec bins |
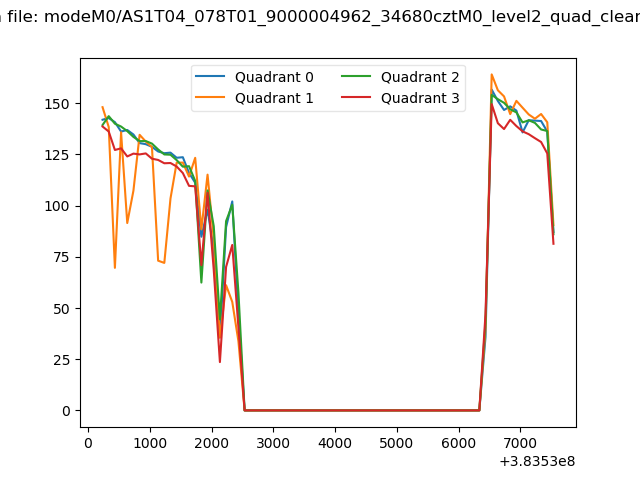 |
|
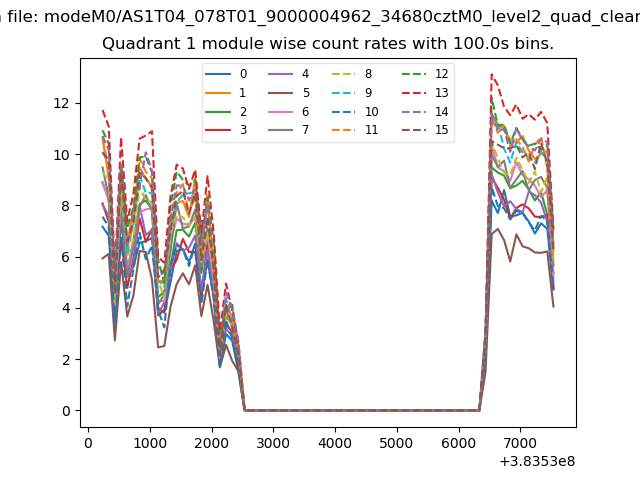
| Module-wise count rates for Quadrant A Data is divided into 100 sec bins |
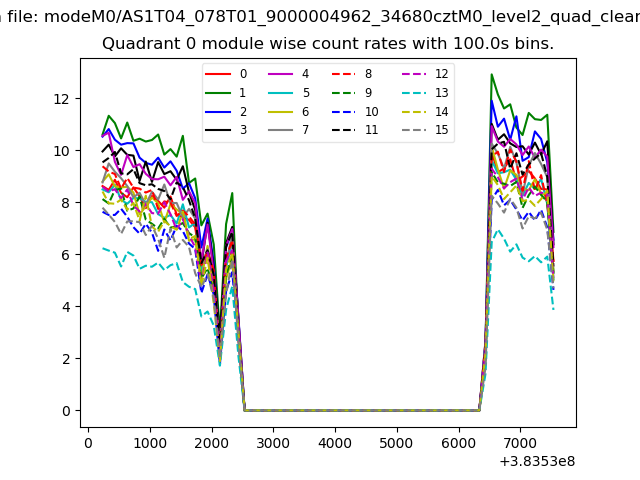 |
 |
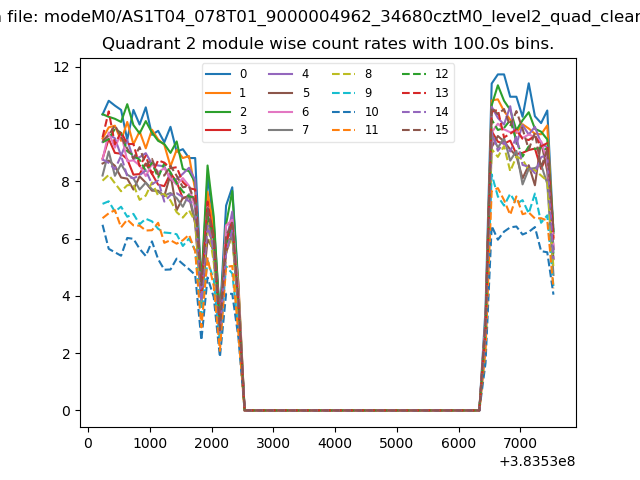
| Module-wise count rates for Quadrant B Data is divided into 100 sec bins |
 |
 |
| Module-wise count rates for Quadrant C Data is divided into 100 sec bins |
 |
 |
| Module-wise count rates for Quadrant D Data is divided into 100 sec bins |
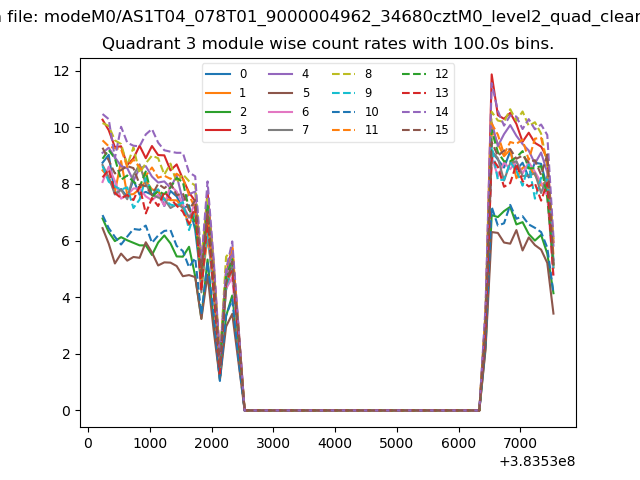 |
 |
| Parameter | Plot |
|---|---|
| CZT HV Monitor | 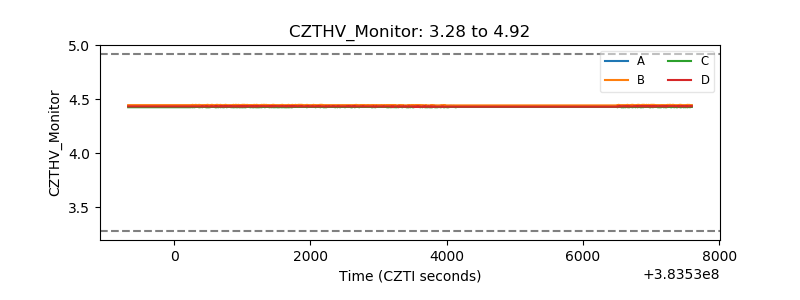 |
| D_VDD | 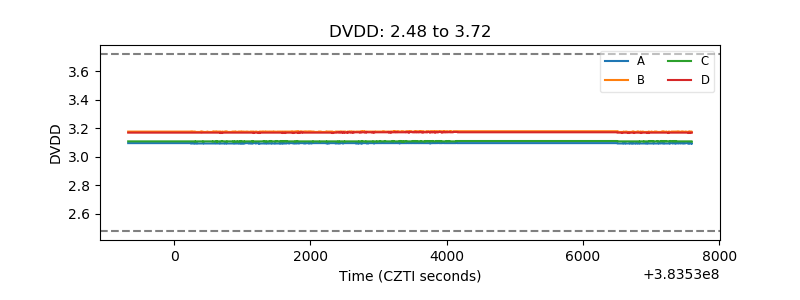 |
| Temperature 1 | 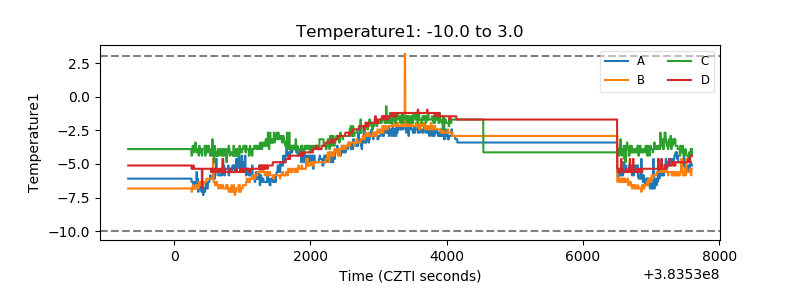 |
| Veto HV Monitor | 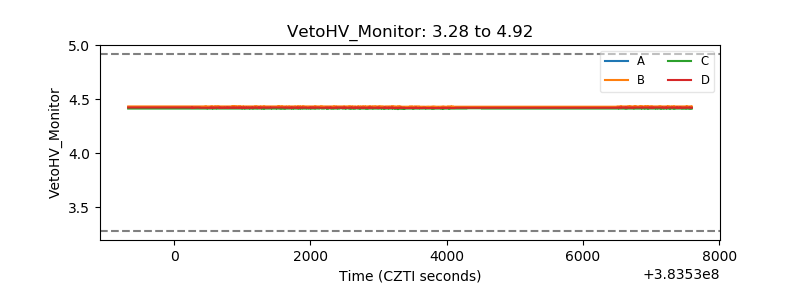 |
| Veto LLD | 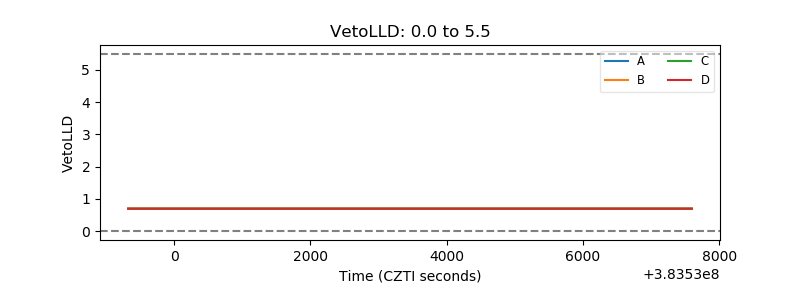 |
| Alpha Counter | 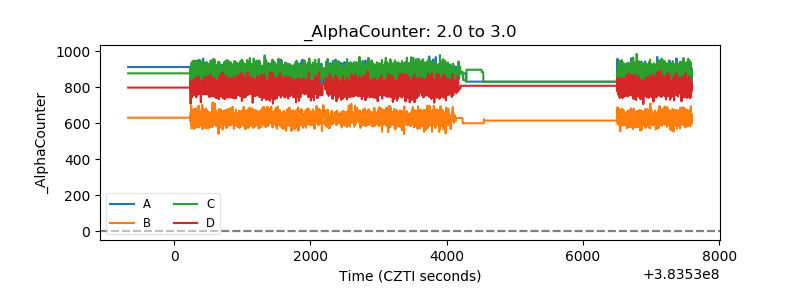 |
| _CPM_Rate | 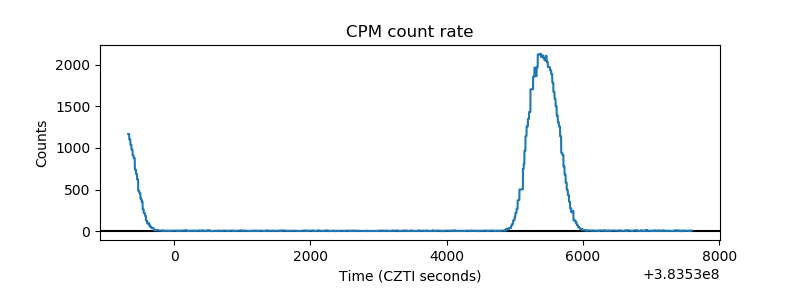 |
| CZT Counter | 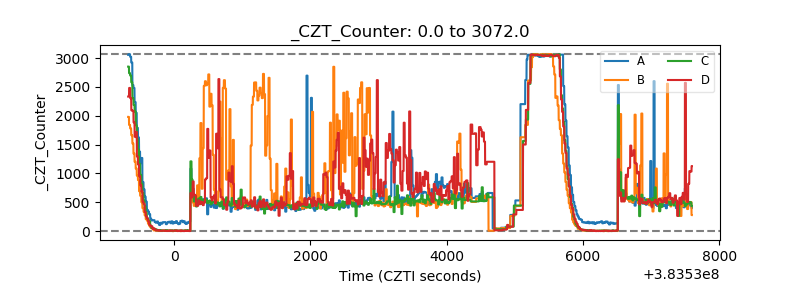 |
| +2.5 Volts monitor | 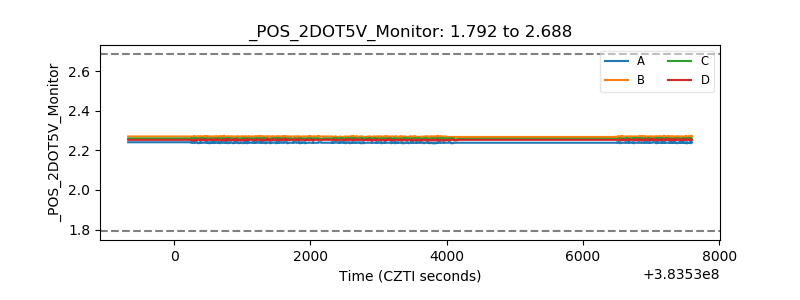 |
| +5 Volts monitor | 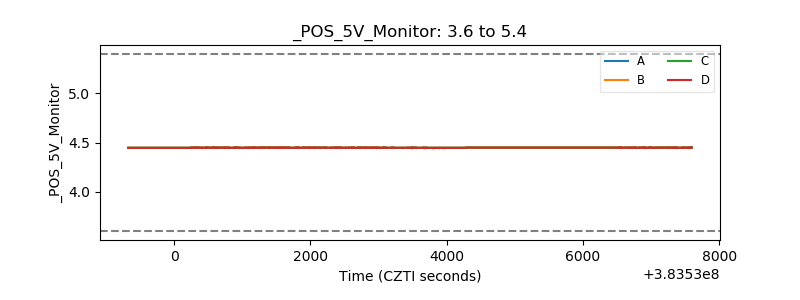 |
| _ROLL_ROT | 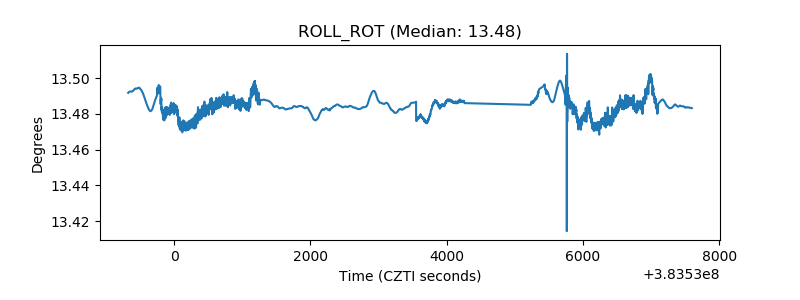 |
| _Roll_DEC | 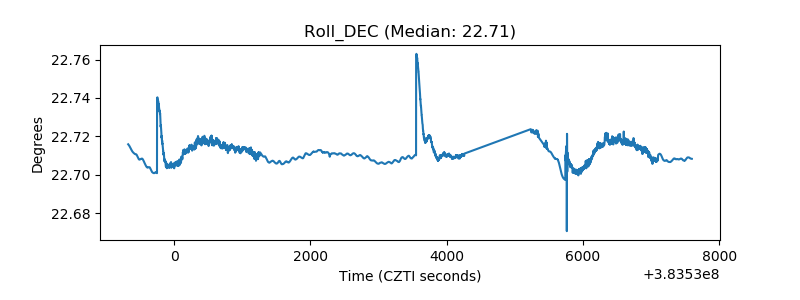 |
| _Roll_RA | 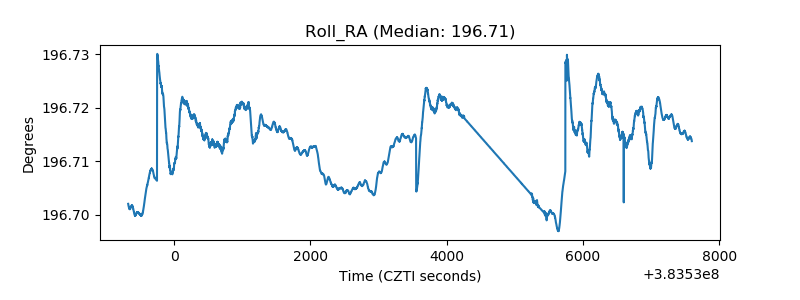 |
| Veto Counter | 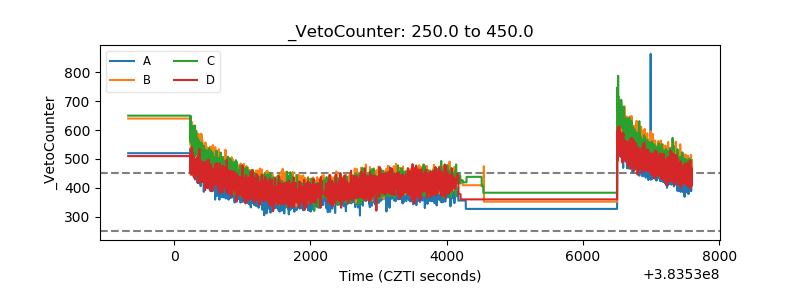 |