| Param | Original file | Final file |
|---|---|---|
| Filename | modeM0/AS1T04_078T01_9000004962_34678cztM0_level2.evt | modeM0/AS1T04_078T01_9000004962_34678cztM0_level2_quad_clean.evt |
| Size (bytes) | 518,944,320 | 71,087,040 |
| Size | 494.9 MB | 67.8 MB |
| Events in quadrant A | 3,219,327 | 447,283 |
| Events in quadrant B | 4,335,944 | 434,569 |
| Events in quadrant C | 2,810,826 | 456,200 |
| Events in quadrant D | 4,975,687 | 427,361 |
| Mode M0 | |||
|---|---|---|---|
| Quadrant | BADHDUFLAG | Total packets | Discarded packets |
| A | 0 | 13118 | 3 |
| B | 0 | 16535 | 2 |
| C | 0 | 11695 | 2 |
| D | 0 | 18598 | 2 |
| Mode M9 | |||
|---|---|---|---|
| Quadrant | BADHDUFLAG | Total packets | Discarded packets |
| A | 0 | 26 | 0 |
| B | 0 | 26 | 0 |
| C | 0 | 26 | 0 |
| D | 0 | 27 | 0 |
| Mode SS | |||
|---|---|---|---|
| Quadrant | BADHDUFLAG | Total packets | Discarded packets |
| A | 0 | 112 | 0 |
| B | 0 | 112 | 0 |
| C | 0 | 112 | 0 |
| D | 0 | 112 | 0 |
| Quadrant | Total seconds | Saturated seconds | Saturation percentage |
|---|---|---|---|
| A | 5530 | 96 | 1.735986% |
| B | 5530 | 474 | 8.571429% |
| C | 5530 | 17 | 0.307414% |
| D | 5530 | 281 | 5.081374% |
Noise dominated data is calculated using 1-second bins in cleaned event files. If a bin has >2000 counts, and if more than 50% of those come from <1% of pixels, then it is considered to be noise-dominated and hence unusable.
| Quadrant | # 1 sec bins | Bins with >0 counts | Bins with >2000 counts | High rate bins dominated by noise | Noise dominated (total time) | Noise dominated (detector-on time) | Marked lightcurve |
|---|---|---|---|---|---|---|---|
| A | 7204 | 5531 | 75 | 75 | 1.04% | 1.36% | 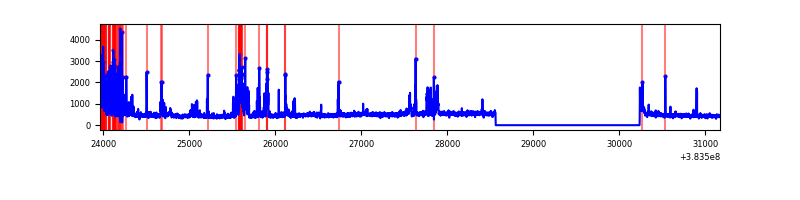 |
| B | 7204 | 5531 | 346 | 346 | 4.80% | 6.26% | 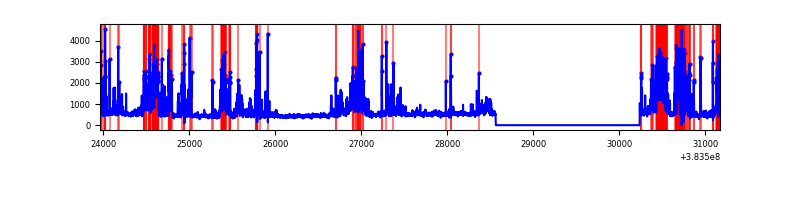 |
| C | 7204 | 5531 | 10 | 10 | 0.14% | 0.18% |  |
| D | 7204 | 5531 | 189 | 189 | 2.62% | 3.42% | 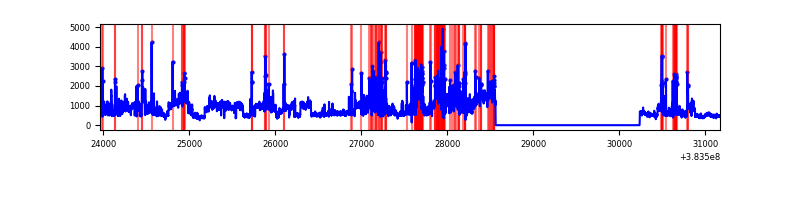 |
Top three noisy pixels from each quadrant. If the there are fewer than three noisy pixels in the level2.evt file, extra rows are filled as -1
| Pixel properties | Quadrant properties | ||||||
|---|---|---|---|---|---|---|---|
| Quadrant | DetID | PixID | Counts | Sigma | Mean | Median | Sigma |
| A | 15 | 169 | 547790 | 4250.86 | 633 | 620 | 128.7 |
| A | 10 | 83 | 45229 | 346.56 | 633 | 620 | 128.7 |
| A | 9 | 143 | 42076 | 322.06 | 633 | 620 | 128.7 |
| B | 5 | 172 | 1182557 | 9924.3 | 614 | 597 | 119.1 |
| B | 5 | 255 | 352264 | 2952.76 | 614 | 597 | 119.1 |
| B | 0 | 190 | 237428 | 1988.54 | 614 | 597 | 119.1 |
| C | 15 | 214 | 235610 | 1635.16 | 619 | 624 | 143.7 |
| C | 0 | 10 | 52881 | 363.63 | 619 | 624 | 143.7 |
| C | 14 | 67 | 51970 | 357.29 | 619 | 624 | 143.7 |
| D | 8 | 195 | 1589614 | 10565.81 | 607 | 589 | 150.4 |
| D | 2 | 249 | 449916 | 2987.68 | 607 | 589 | 150.4 |
| D | 12 | 233 | 103109 | 681.68 | 607 | 589 | 150.4 |
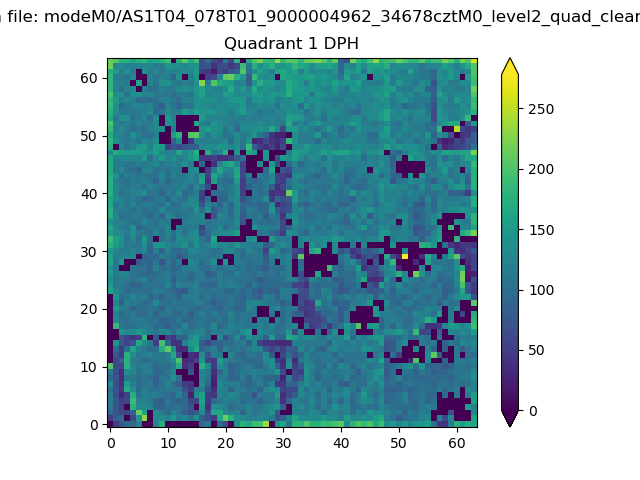
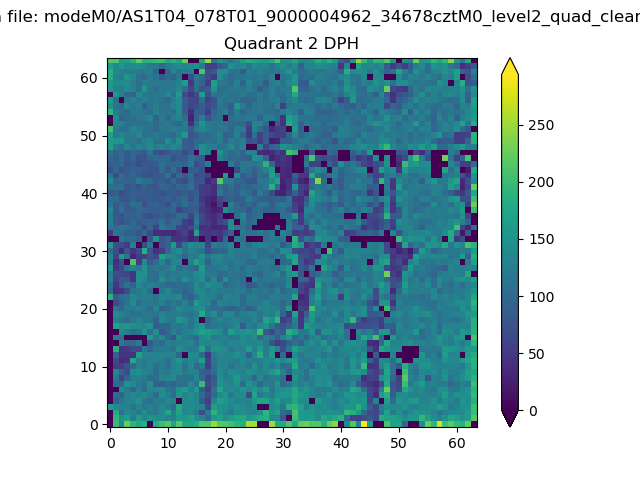
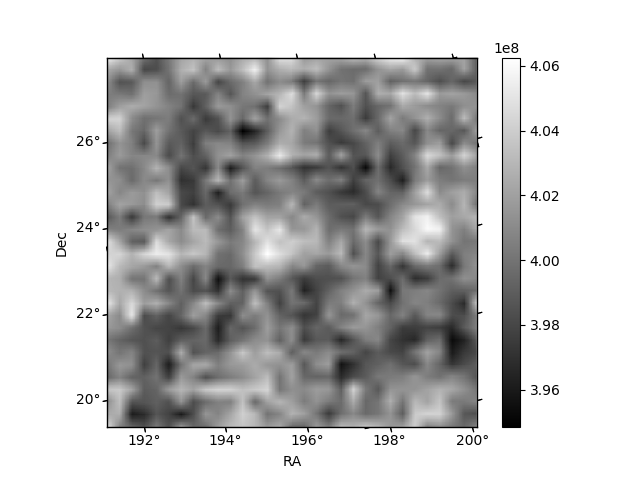
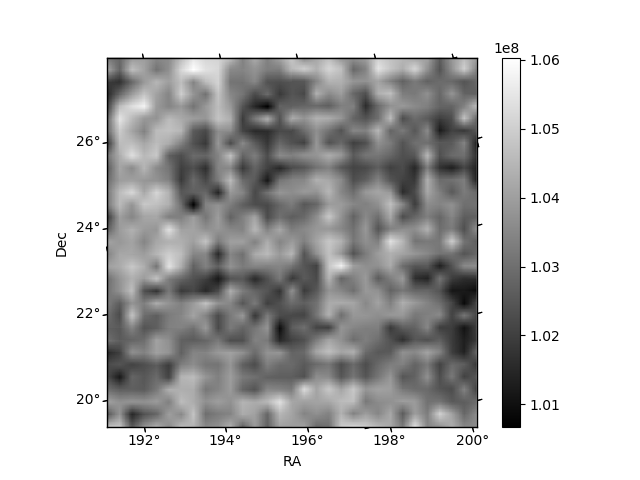
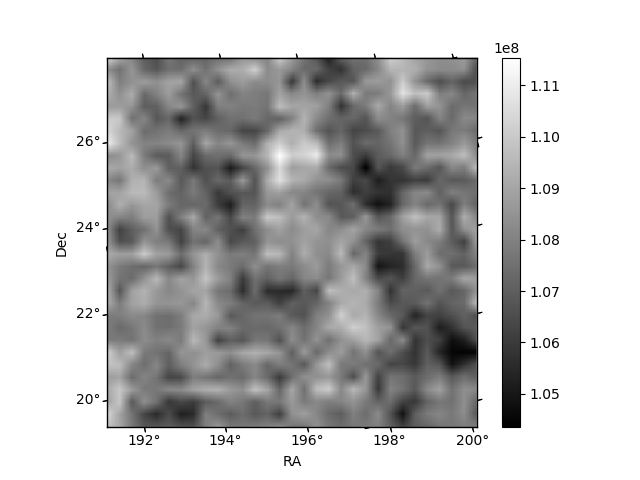
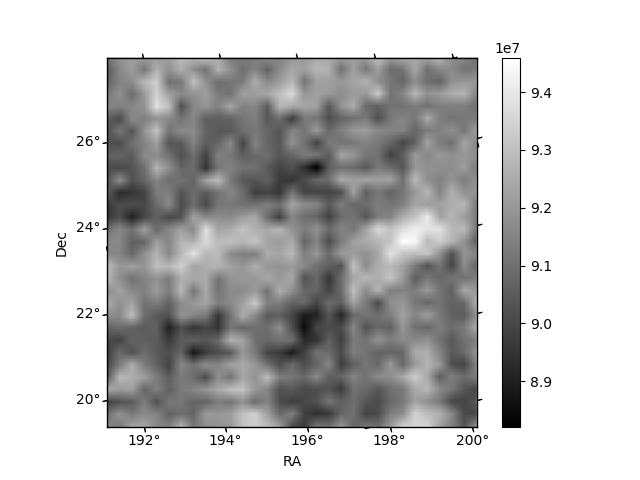
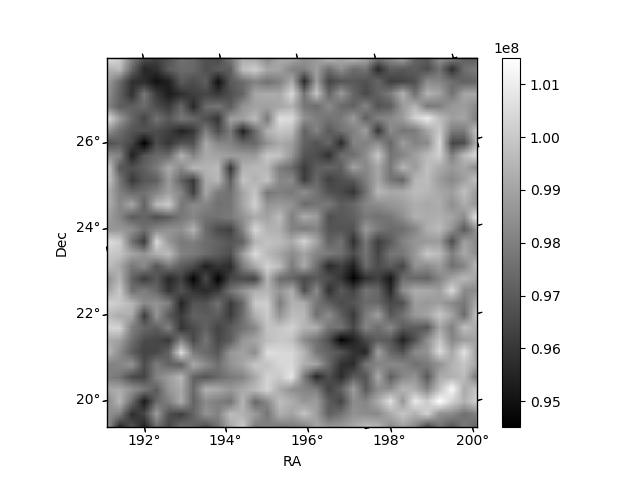
Histogram calculated using DETX and DETY for each event in the final _common_clean file
| Quadrant A | 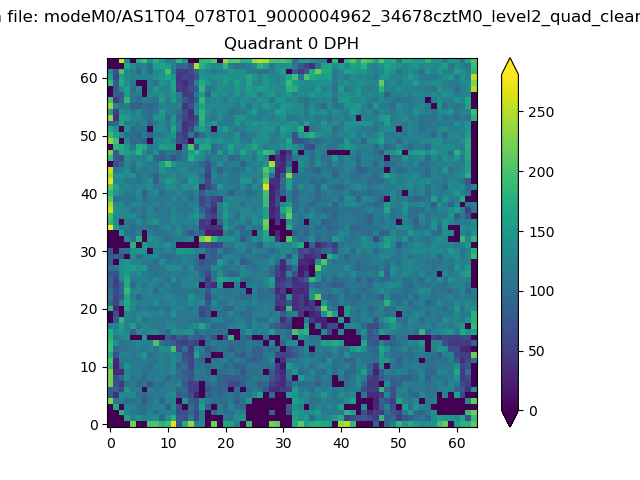 |
 |
Quadrant B |
|---|---|---|---|
| Quadrant D | 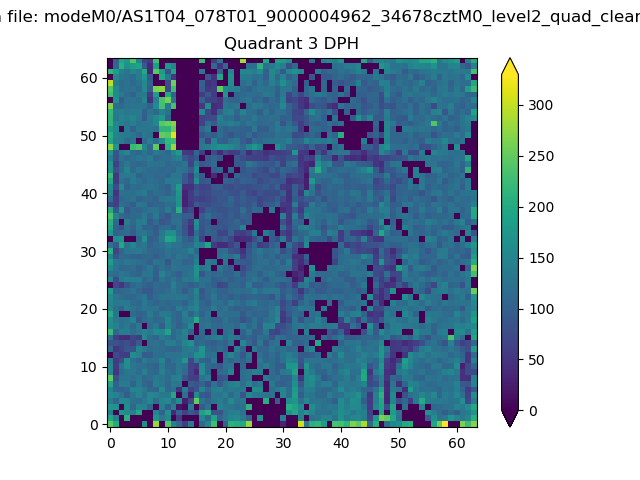 |
 |
Quadrant C |
| Plot type | Count rate plots | Images |
|---|---|---|
| Comparison with Poisson distribution Blue bars denote a histogram of data divided into 1 sec bins. Red curve is a Poisson curve with rate = median count rate of data. |
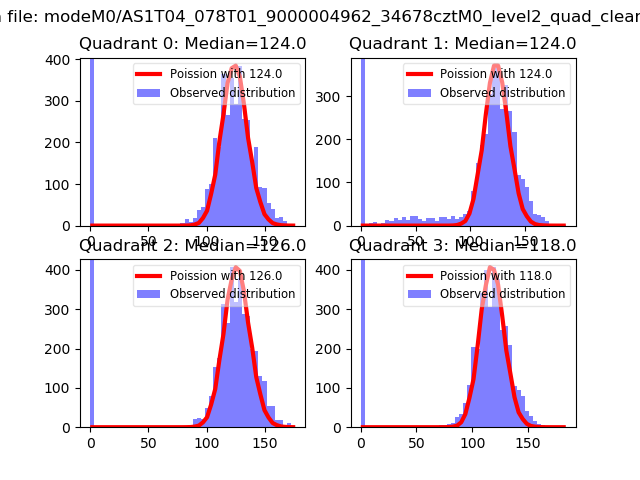 |
 |
| Quadrant-wise count rates Data is divided into 100 sec bins |
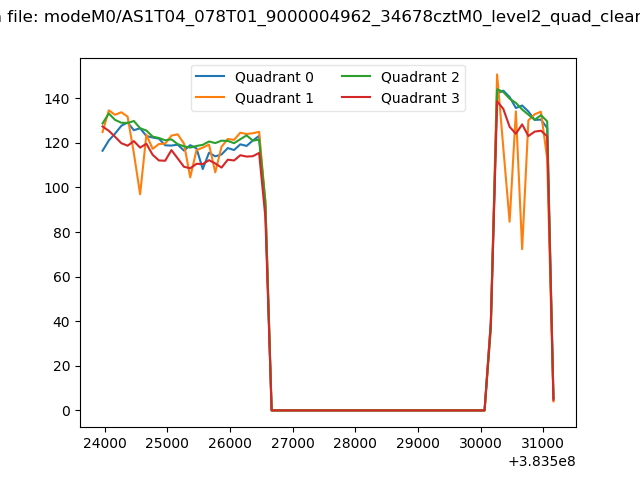 |
|
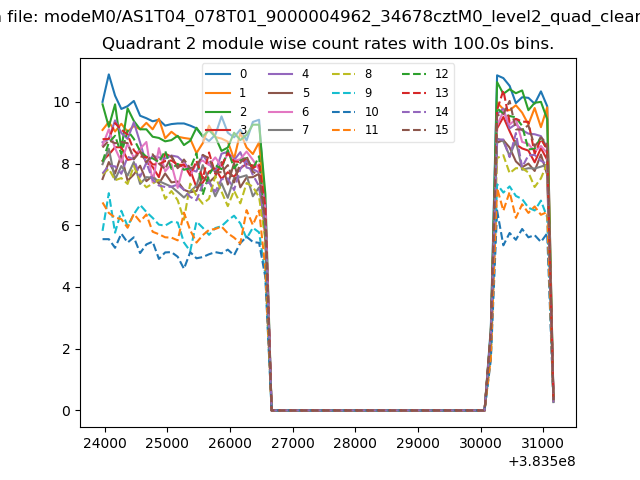
| Module-wise count rates for Quadrant A Data is divided into 100 sec bins |
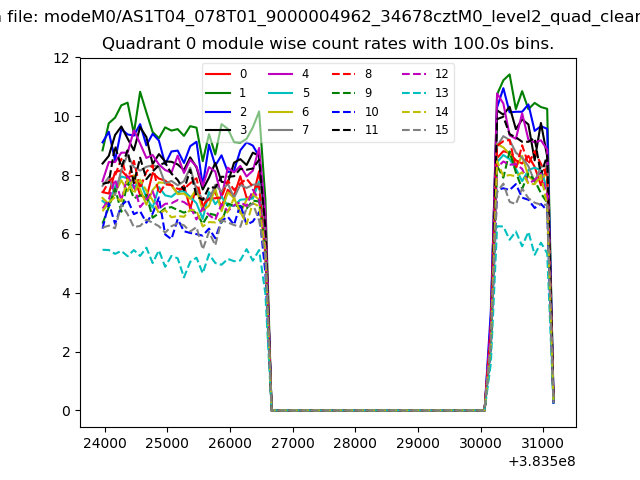 |
 |
| Module-wise count rates for Quadrant B Data is divided into 100 sec bins |
 |
 |
| Module-wise count rates for Quadrant C Data is divided into 100 sec bins |
 |
 |
| Module-wise count rates for Quadrant D Data is divided into 100 sec bins |
 |
 |
| Parameter | Plot |
|---|---|
| CZT HV Monitor | 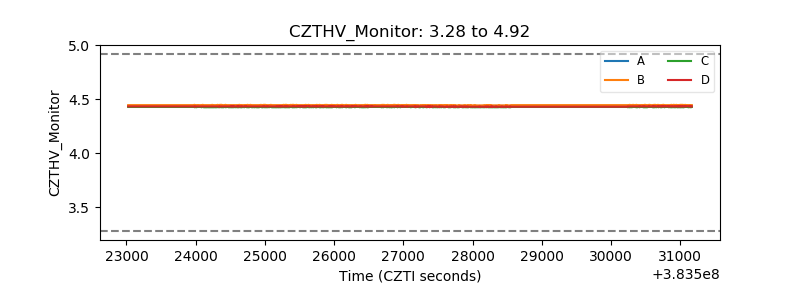 |
| D_VDD | 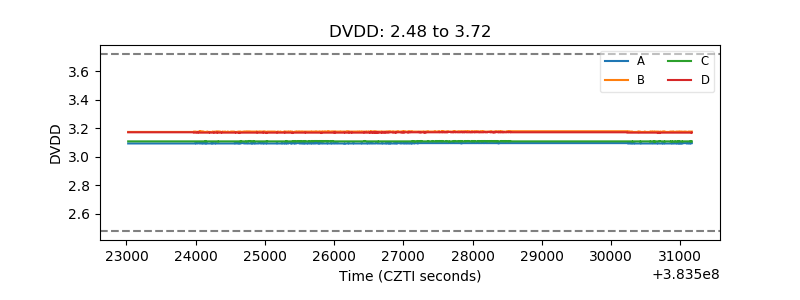 |
| Temperature 1 | 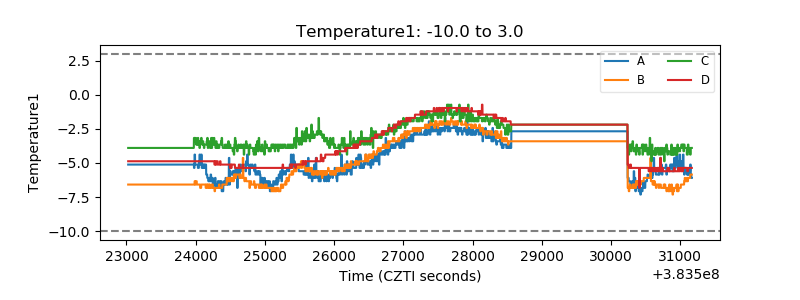 |
| Veto HV Monitor | 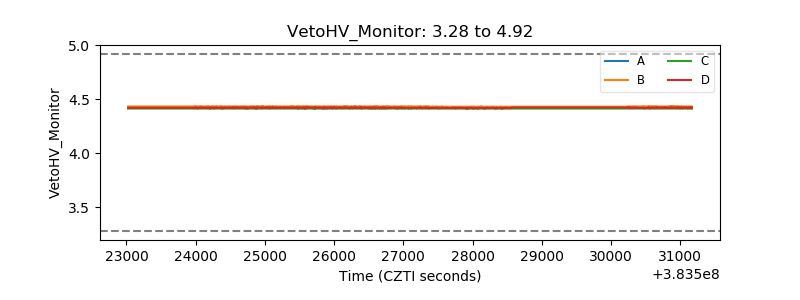 |
| Veto LLD | 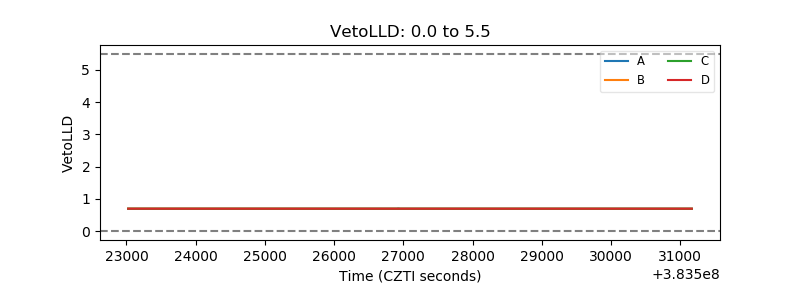 |
| Alpha Counter | 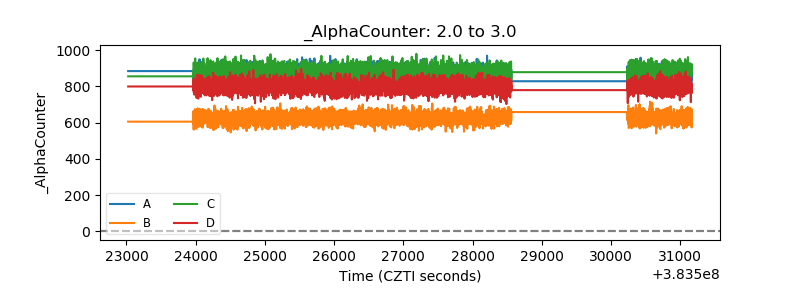 |
| _CPM_Rate | 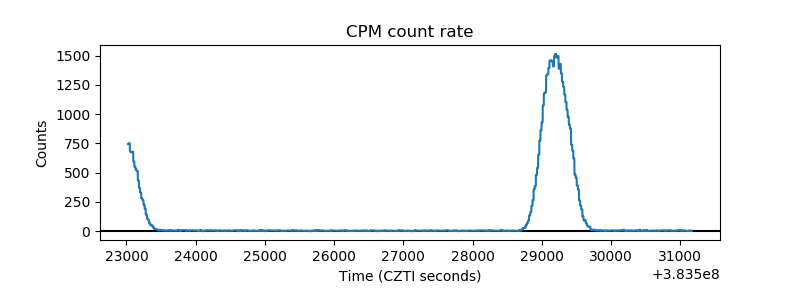 |
| CZT Counter | 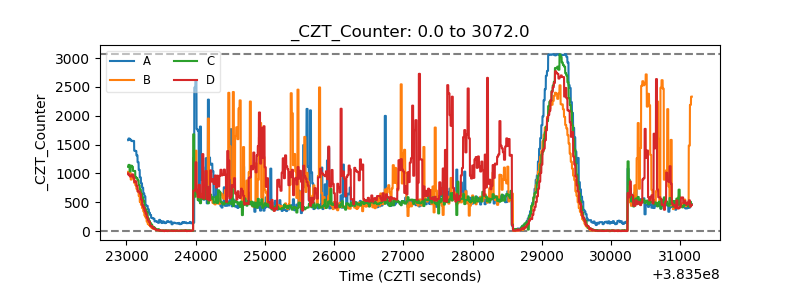 |
| +2.5 Volts monitor | 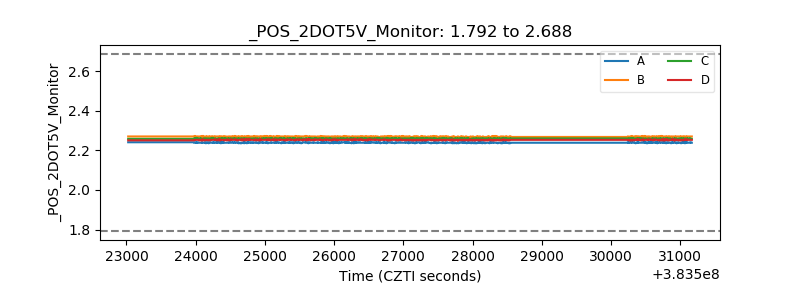 |
| +5 Volts monitor | 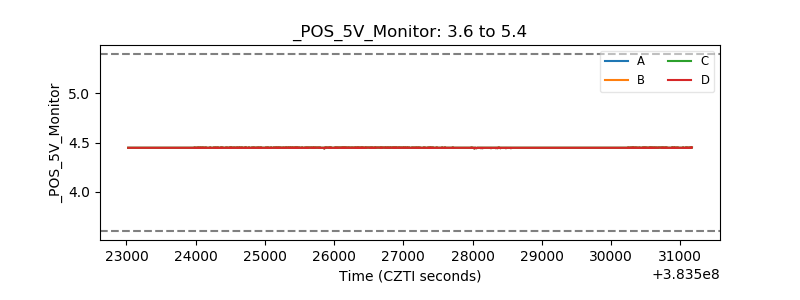 |
| _ROLL_ROT | 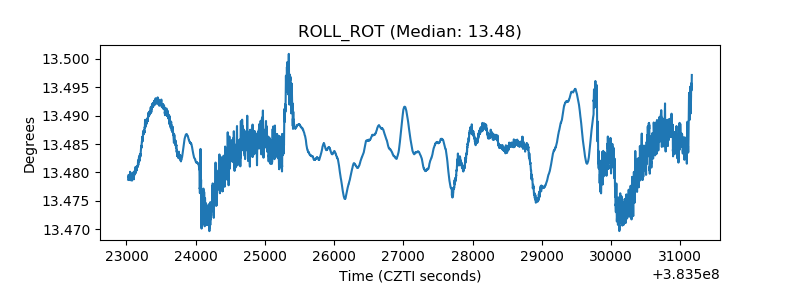 |
| _Roll_DEC | 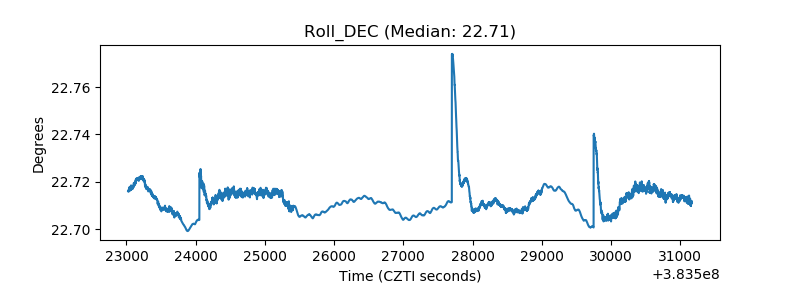 |
| _Roll_RA | 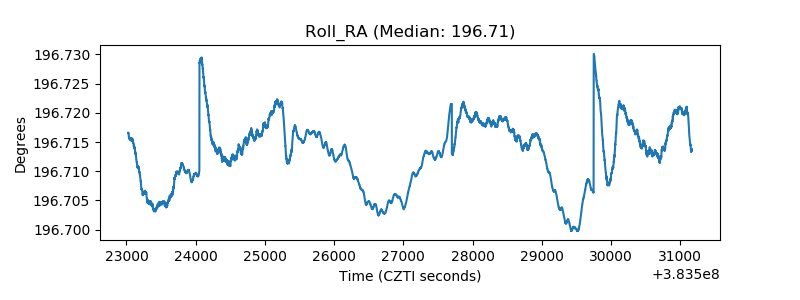 |
| Veto Counter | 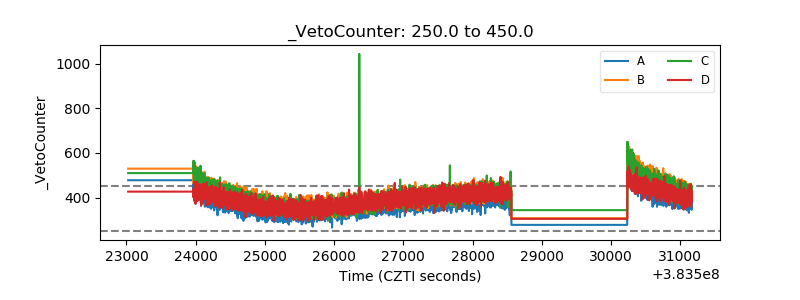 |