| Param | Original file | Final file |
|---|---|---|
| Filename | modeM0/AS1A11_065T06_9000004958_34670cztM0_level2.evt | modeM0/AS1A11_065T06_9000004958_34670cztM0_level2_quad_clean.evt |
| Size (bytes) | 617,731,200 | 75,052,800 |
| Size | 589.1 MB | 71.6 MB |
| Events in quadrant A | 6,122,457 | 451,431 |
| Events in quadrant B | 3,827,195 | 515,612 |
| Events in quadrant C | 2,847,161 | 510,470 |
| Events in quadrant D | 5,571,082 | 441,227 |
| Mode M0 | |||
|---|---|---|---|
| Quadrant | BADHDUFLAG | Total packets | Discarded packets |
| A | 0 | 21475 | 3 |
| B | 0 | 14522 | 2 |
| C | 0 | 11249 | 2 |
| D | 0 | 20209 | 2 |
| Mode SS | |||
|---|---|---|---|
| Quadrant | BADHDUFLAG | Total packets | Discarded packets |
| A | 0 | 106 | 0 |
| B | 0 | 106 | 0 |
| C | 0 | 106 | 0 |
| D | 0 | 106 | 0 |
| Mode M9 | |||
|---|---|---|---|
| Quadrant | BADHDUFLAG | Total packets | Discarded packets |
| A | 0 | 42 | 0 |
| B | 0 | 42 | 0 |
| C | 0 | 42 | 0 |
| D | 0 | 42 | 0 |
| Quadrant | Total seconds | Saturated seconds | Saturation percentage |
|---|---|---|---|
| A | 5032 | 1178 | 23.410175% |
| B | 5032 | 400 | 7.949126% |
| C | 5032 | 42 | 0.834658% |
| D | 5032 | 601 | 11.943561% |
Noise dominated data is calculated using 1-second bins in cleaned event files. If a bin has >2000 counts, and if more than 50% of those come from <1% of pixels, then it is considered to be noise-dominated and hence unusable.
| Quadrant | # 1 sec bins | Bins with >0 counts | Bins with >2000 counts | High rate bins dominated by noise | Noise dominated (total time) | Noise dominated (detector-on time) | Marked lightcurve |
|---|---|---|---|---|---|---|---|
| A | 9248 | 5034 | 951 | 951 | 10.28% | 18.89% | 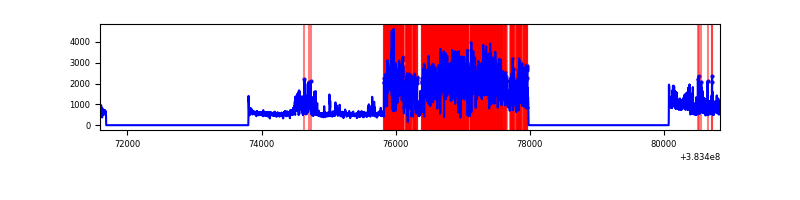 |
| B | 9248 | 5034 | 247 | 247 | 2.67% | 4.91% | 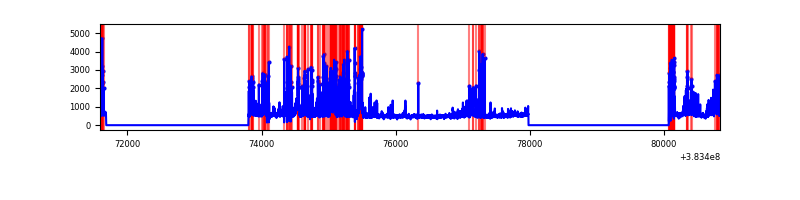 |
| C | 9248 | 5034 | 27 | 27 | 0.29% | 0.54% | 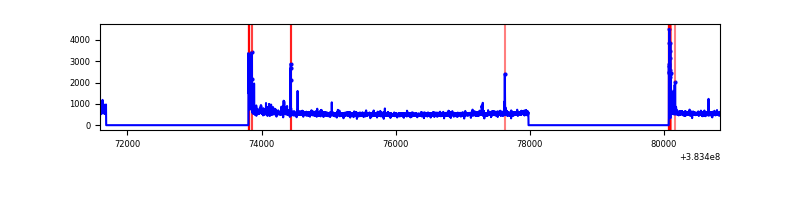 |
| D | 9248 | 5033 | 513 | 513 | 5.55% | 10.19% | 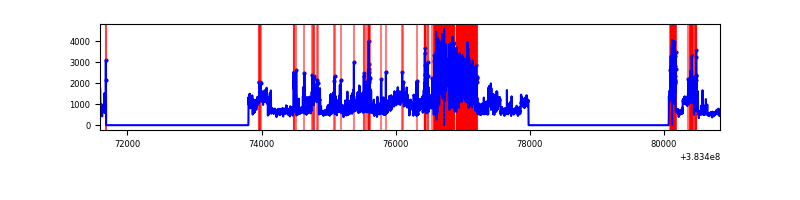 |
Top three noisy pixels from each quadrant. If the there are fewer than three noisy pixels in the level2.evt file, extra rows are filled as -1
| Pixel properties | Quadrant properties | ||||||
|---|---|---|---|---|---|---|---|
| Quadrant | DetID | PixID | Counts | Sigma | Mean | Median | Sigma |
| A | 15 | 169 | 3756505 | 31659.78 | 589 | 580 | 118.6 |
| A | 10 | 83 | 45270 | 376.7 | 589 | 580 | 118.6 |
| A | 7 | 48 | 21016 | 172.26 | 589 | 580 | 118.6 |
| B | 5 | 172 | 690706 | 5971.1 | 612 | 599 | 115.6 |
| B | 5 | 255 | 460991 | 3983.51 | 612 | 599 | 115.6 |
| B | 10 | 245 | 148331 | 1278.24 | 612 | 599 | 115.6 |
| C | 15 | 214 | 213557 | 1507.6 | 608 | 613 | 141.2 |
| C | 0 | 10 | 131864 | 929.23 | 608 | 613 | 141.2 |
| C | 14 | 67 | 82619 | 580.58 | 608 | 613 | 141.2 |
| D | 8 | 195 | 1462047 | 10335.35 | 577 | 562 | 141.4 |
| D | 12 | 233 | 1081506 | 7644.24 | 577 | 562 | 141.4 |
| D | 2 | 249 | 347257 | 2451.76 | 577 | 562 | 141.4 |
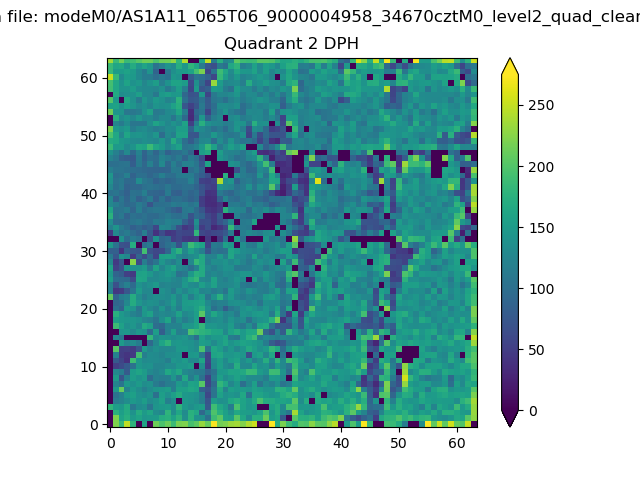
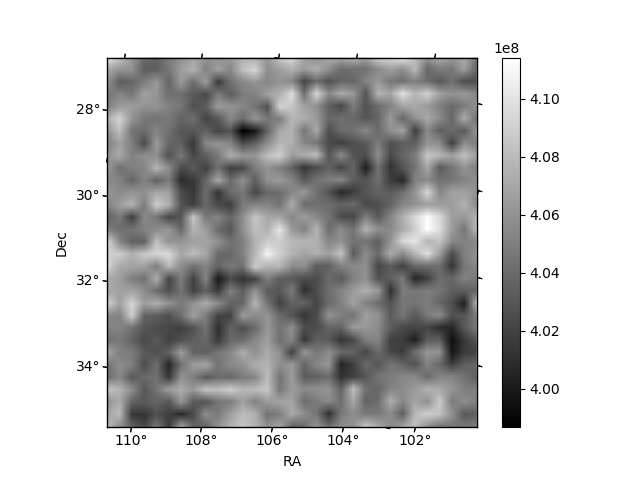
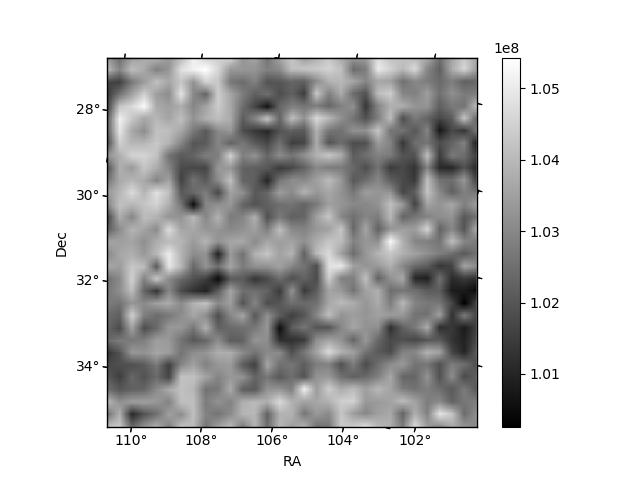
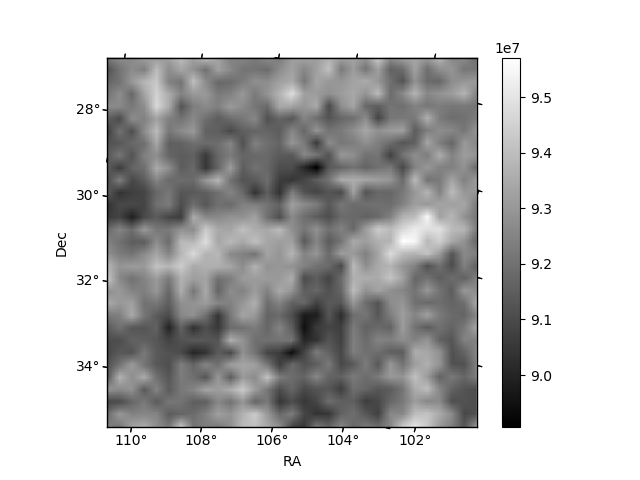
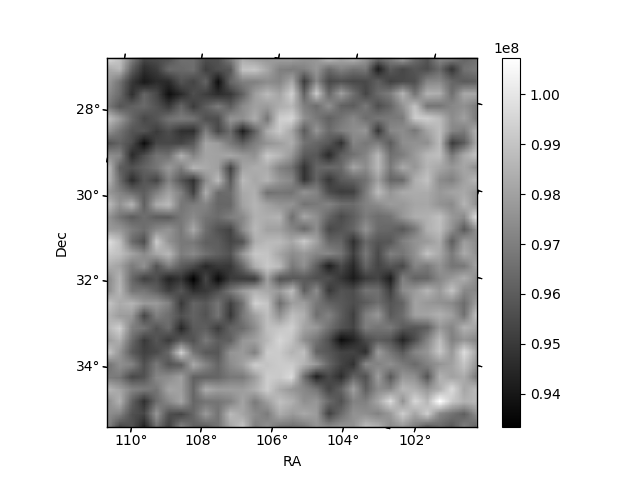
Histogram calculated using DETX and DETY for each event in the final _common_clean file
| Quadrant A | 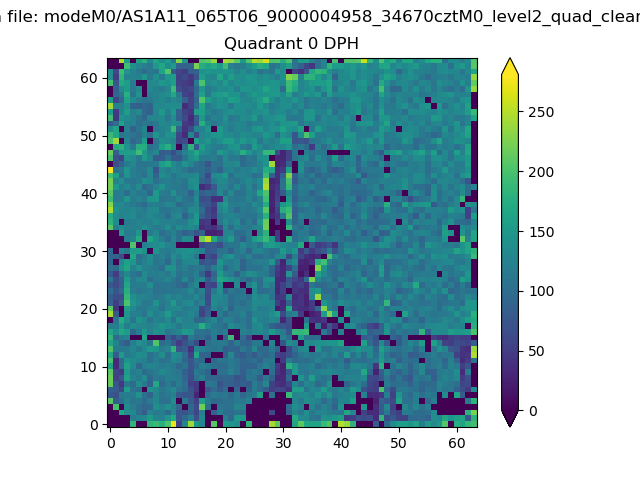 |
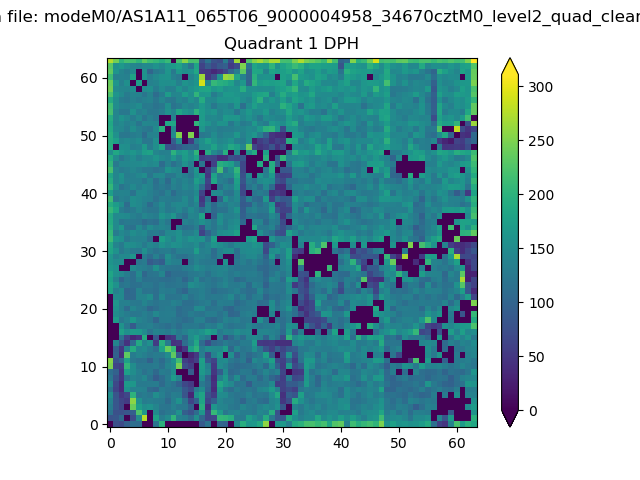 |
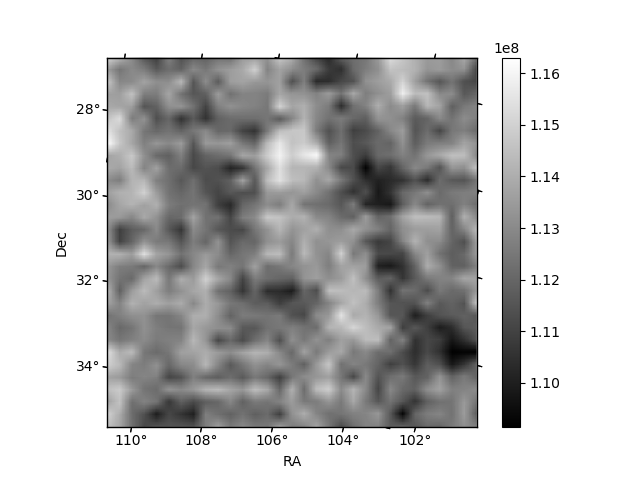
Quadrant B |
|---|---|---|---|
| Quadrant D | 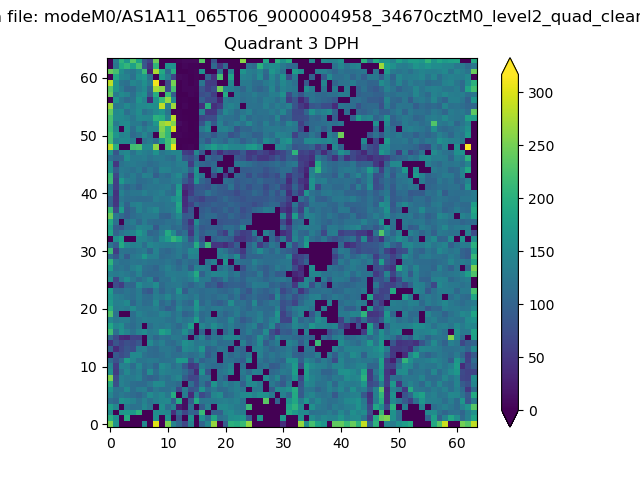 |
 |
Quadrant C |
| Plot type | Count rate plots | Images |
|---|---|---|
| Comparison with Poisson distribution Blue bars denote a histogram of data divided into 1 sec bins. Red curve is a Poisson curve with rate = median count rate of data. |
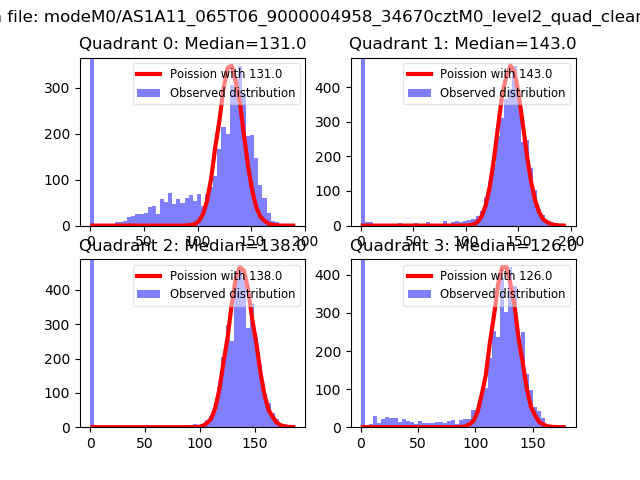 |
 |
| Quadrant-wise count rates Data is divided into 100 sec bins |
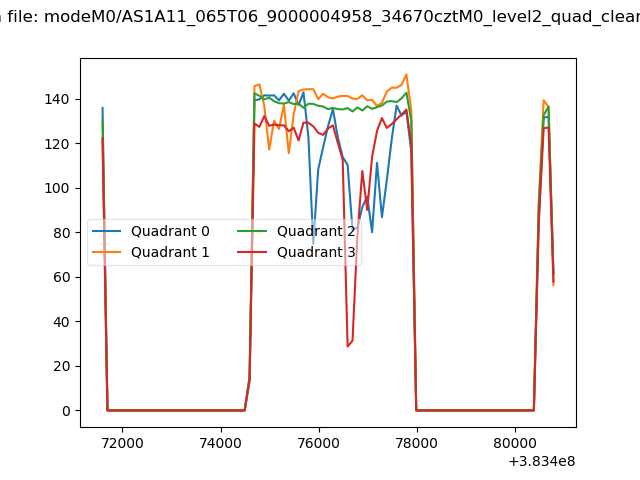 |
|
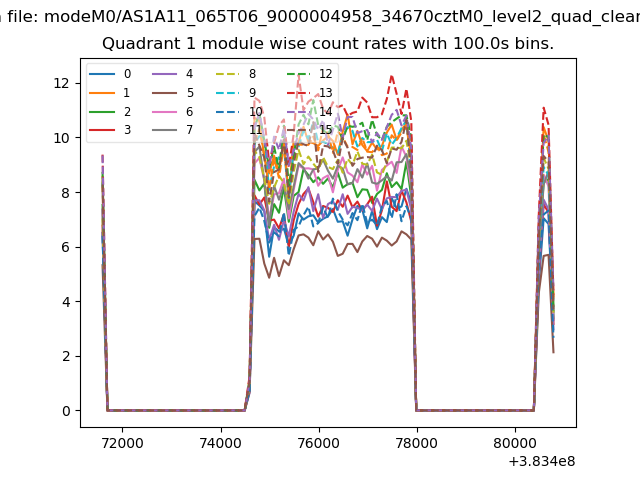
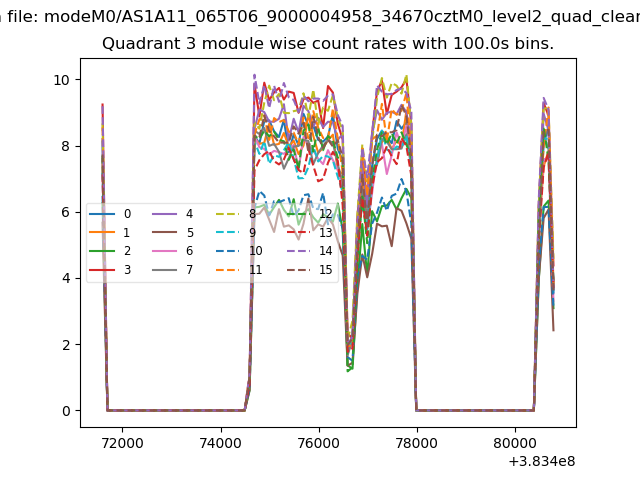
| Module-wise count rates for Quadrant A Data is divided into 100 sec bins |
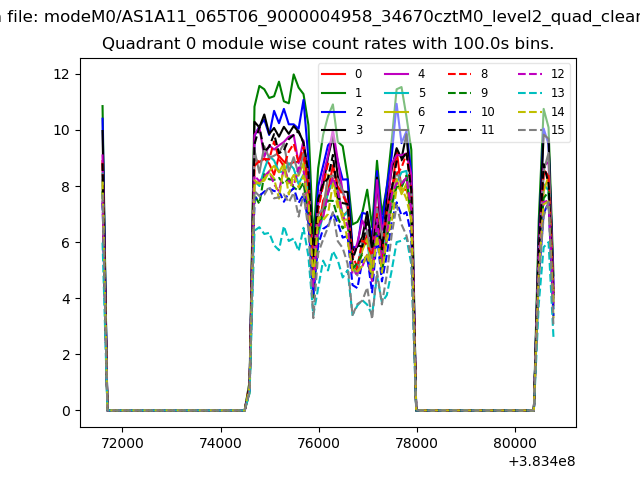 |
 |
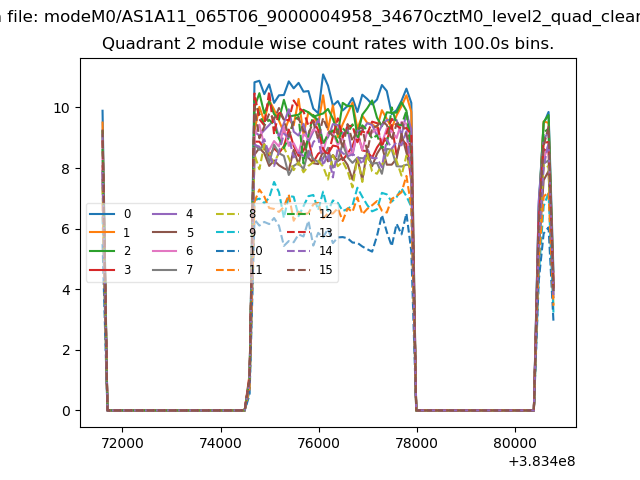
| Module-wise count rates for Quadrant B Data is divided into 100 sec bins |
 |
 |
| Module-wise count rates for Quadrant C Data is divided into 100 sec bins |
 |
 |
| Module-wise count rates for Quadrant D Data is divided into 100 sec bins |
 |
 |
| Parameter | Plot |
|---|---|
| CZT HV Monitor | 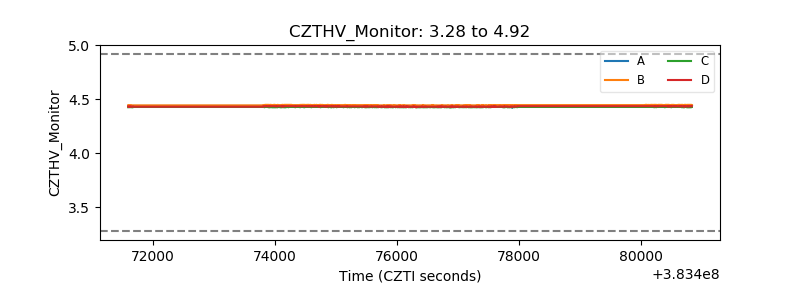 |
| D_VDD | 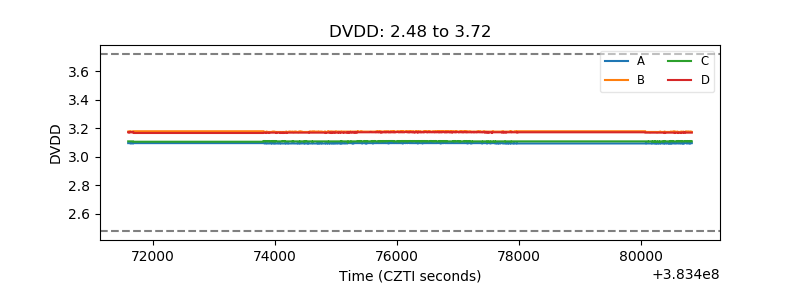 |
| Temperature 1 | 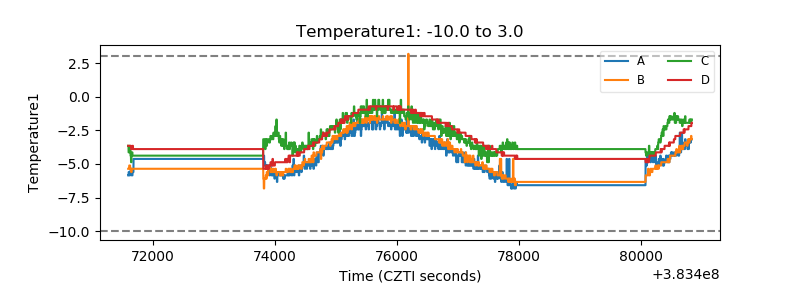 |
| Veto HV Monitor | 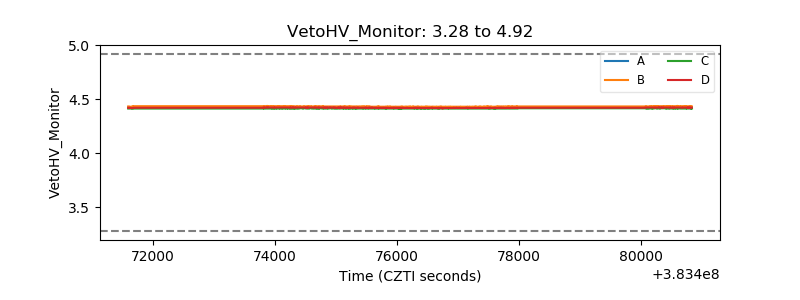 |
| Veto LLD | 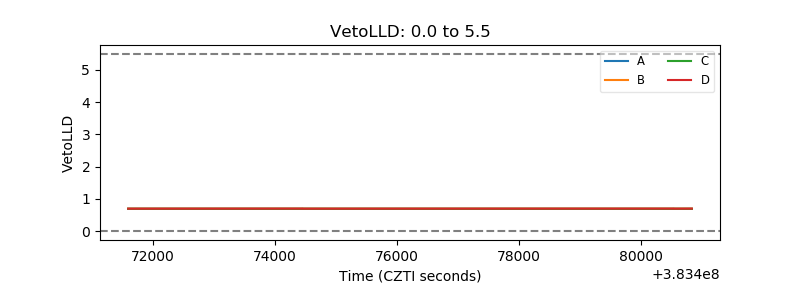 |
| Alpha Counter | 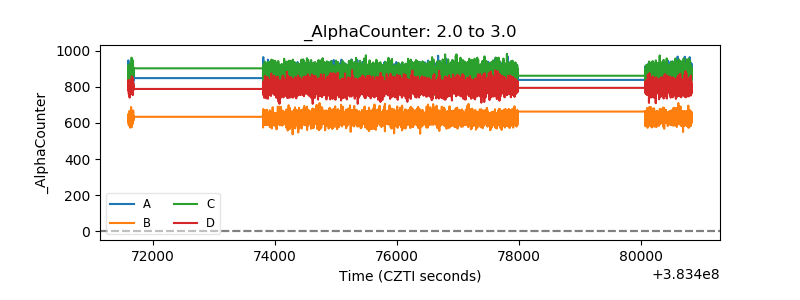 |
| _CPM_Rate | 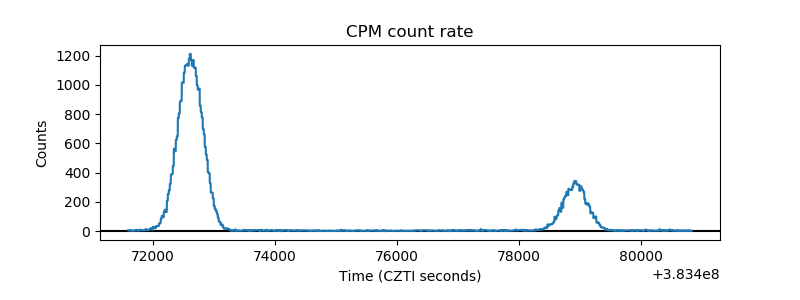 |
| CZT Counter | 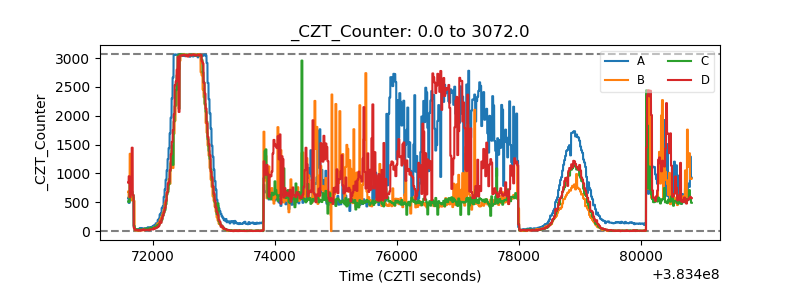 |
| +2.5 Volts monitor | 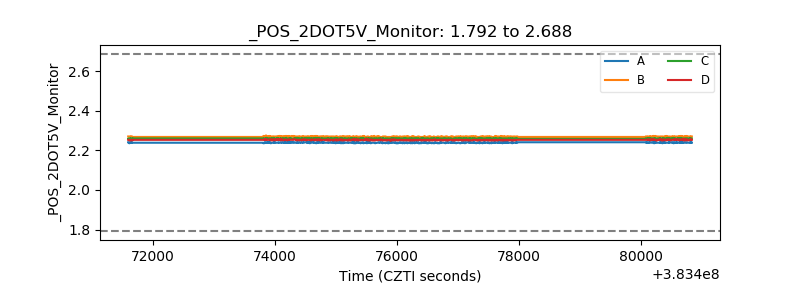 |
| +5 Volts monitor | 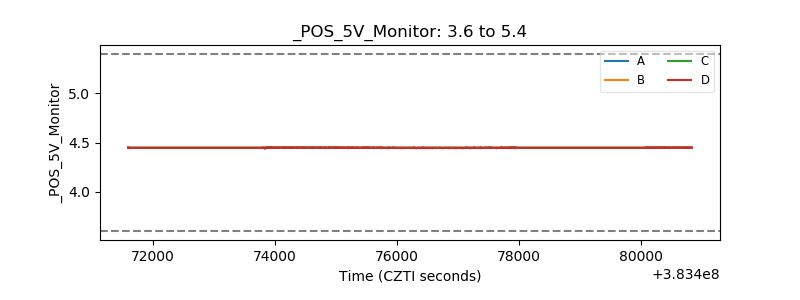 |
| _ROLL_ROT | 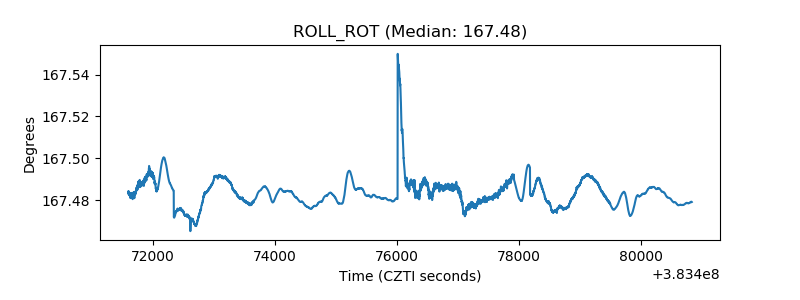 |
| _Roll_DEC | 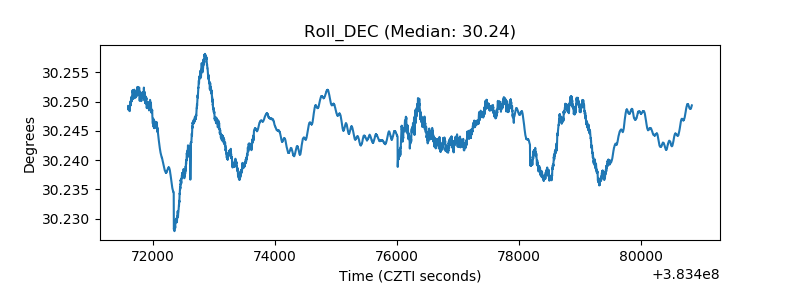 |
| _Roll_RA | 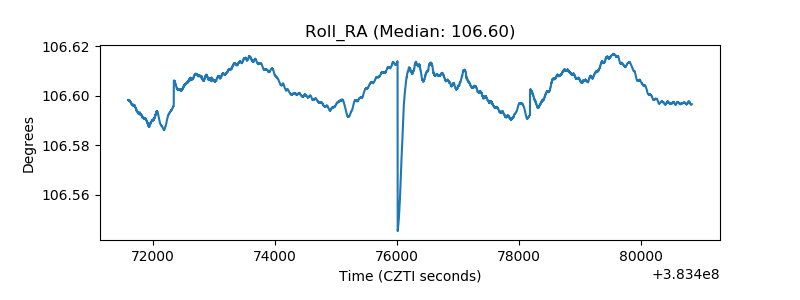 |
| Veto Counter | 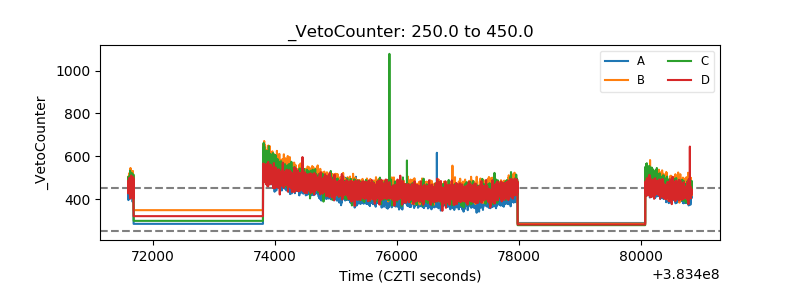 |