| Param | Original file | Final file |
|---|---|---|
| Filename | modeM0/AS1A11_065T06_9000004958_34668cztM0_level2.evt | modeM0/AS1A11_065T06_9000004958_34668cztM0_level2_quad_clean.evt |
| Size (bytes) | 592,810,560 | 54,950,400 |
| Size | 565.3 MB | 52.4 MB |
| Events in quadrant A | 4,672,638 | 286,110 |
| Events in quadrant B | 4,296,202 | 349,311 |
| Events in quadrant C | 3,040,761 | 350,385 |
| Events in quadrant D | 5,599,764 | 320,535 |
| Mode M0 | |||
|---|---|---|---|
| Quadrant | BADHDUFLAG | Total packets | Discarded packets |
| A | 0 | 17097 | 3 |
| B | 0 | 15882 | 2 |
| C | 0 | 11930 | 2 |
| D | 0 | 20401 | 2 |
| Mode SS | |||
|---|---|---|---|
| Quadrant | BADHDUFLAG | Total packets | Discarded packets |
| A | 0 | 104 | 0 |
| B | 0 | 104 | 0 |
| C | 0 | 104 | 0 |
| D | 0 | 104 | 0 |
| Mode M9 | |||
|---|---|---|---|
| Quadrant | BADHDUFLAG | Total packets | Discarded packets |
| A | 0 | 32 | 0 |
| B | 0 | 32 | 0 |
| C | 0 | 32 | 0 |
| D | 0 | 33 | 0 |
| Quadrant | Total seconds | Saturated seconds | Saturation percentage |
|---|---|---|---|
| A | 5089 | 767 | 15.071723% |
| B | 5089 | 537 | 10.552171% |
| C | 5089 | 61 | 1.198664% |
| D | 5089 | 352 | 6.916880% |
Noise dominated data is calculated using 1-second bins in cleaned event files. If a bin has >2000 counts, and if more than 50% of those come from <1% of pixels, then it is considered to be noise-dominated and hence unusable.
| Quadrant | # 1 sec bins | Bins with >0 counts | Bins with >2000 counts | High rate bins dominated by noise | Noise dominated (total time) | Noise dominated (detector-on time) | Marked lightcurve |
|---|---|---|---|---|---|---|---|
| A | 7181 | 5090 | 554 | 554 | 7.71% | 10.88% | 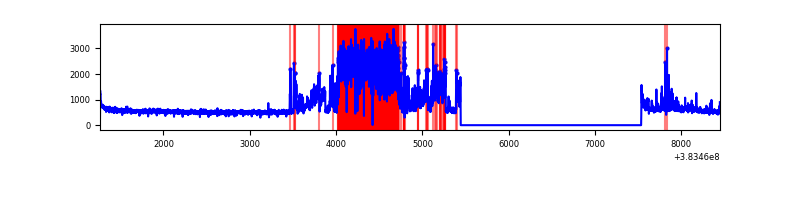 |
| B | 7181 | 5090 | 341 | 341 | 4.75% | 6.70% | 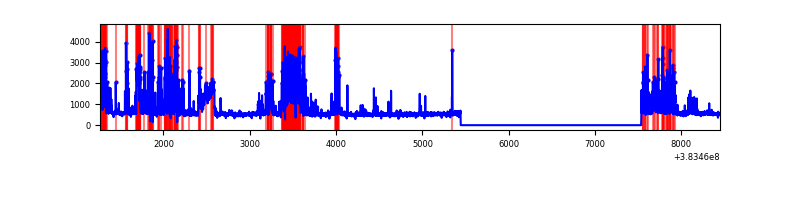 |
| C | 7181 | 5089 | 48 | 48 | 0.67% | 0.94% | 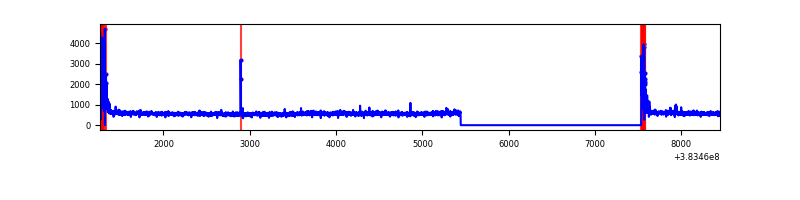 |
| D | 7181 | 5090 | 284 | 284 | 3.95% | 5.58% | 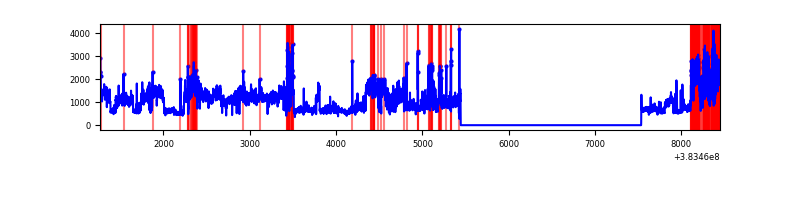 |
Top three noisy pixels from each quadrant. If the there are fewer than three noisy pixels in the level2.evt file, extra rows are filled as -1
| Pixel properties | Quadrant properties | ||||||
|---|---|---|---|---|---|---|---|
| Quadrant | DetID | PixID | Counts | Sigma | Mean | Median | Sigma |
| A | 15 | 169 | 2153589 | 17356.28 | 623 | 613 | 124.0 |
| A | 15 | 174 | 57528 | 458.82 | 623 | 613 | 124.0 |
| A | 10 | 83 | 45880 | 364.92 | 623 | 613 | 124.0 |
| B | 5 | 172 | 1090136 | 8943.89 | 648 | 634 | 121.8 |
| B | 5 | 200 | 303029 | 2482.41 | 648 | 634 | 121.8 |
| B | 5 | 255 | 256930 | 2103.97 | 648 | 634 | 121.8 |
| C | 15 | 214 | 219589 | 1477.51 | 643 | 650 | 148.2 |
| C | 0 | 10 | 192420 | 1294.16 | 643 | 650 | 148.2 |
| C | 14 | 67 | 60403 | 403.24 | 643 | 650 | 148.2 |
| D | 8 | 195 | 2083092 | 12441.8 | 621 | 608 | 167.4 |
| D | 2 | 249 | 543142 | 3241.37 | 621 | 608 | 167.4 |
| D | 2 | 250 | 199562 | 1188.65 | 621 | 608 | 167.4 |
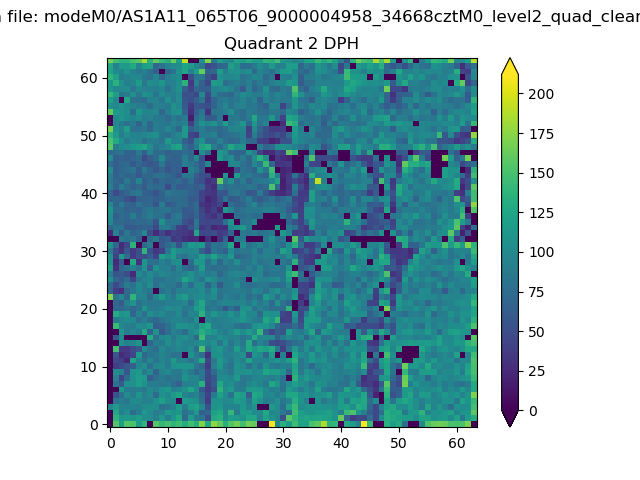
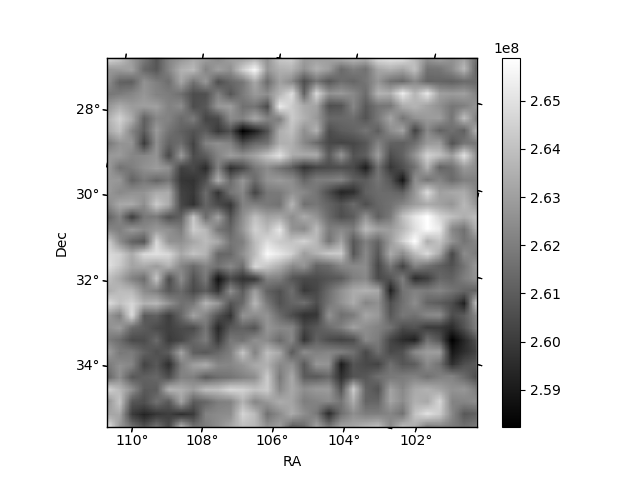
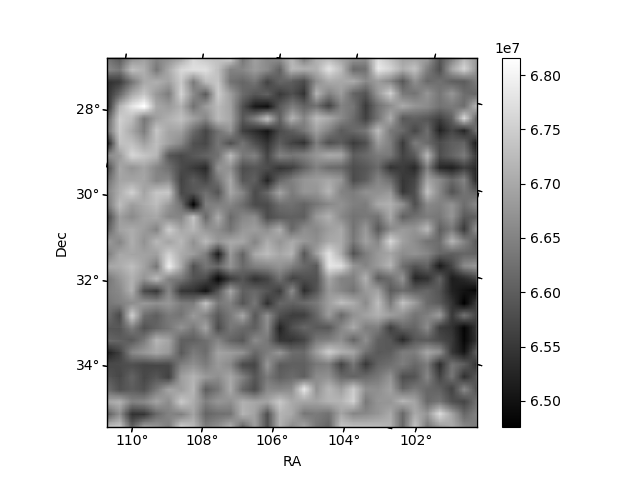
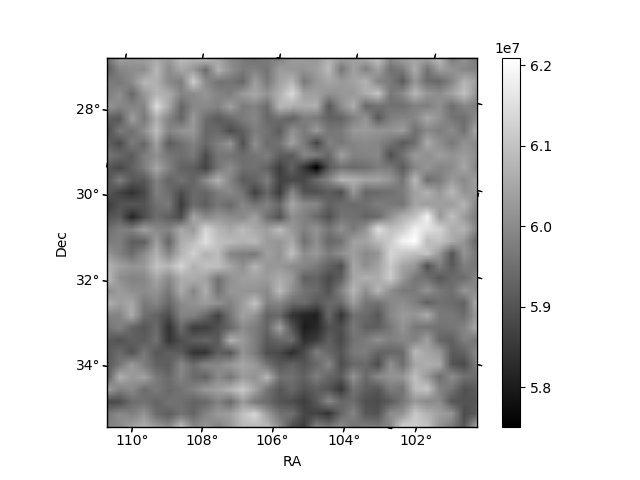
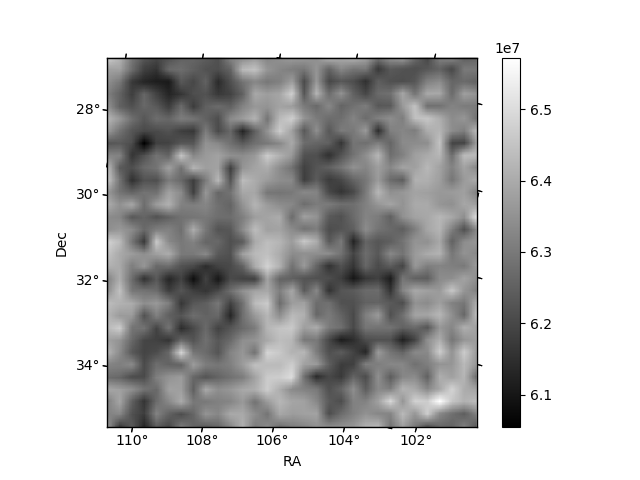
Histogram calculated using DETX and DETY for each event in the final _common_clean file
| Quadrant A | 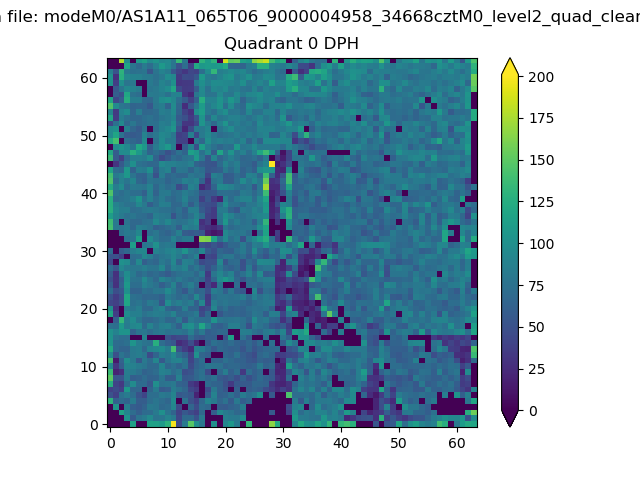 |
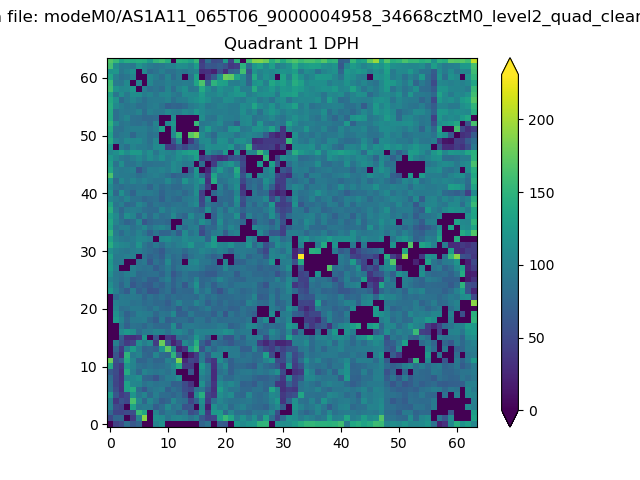 |
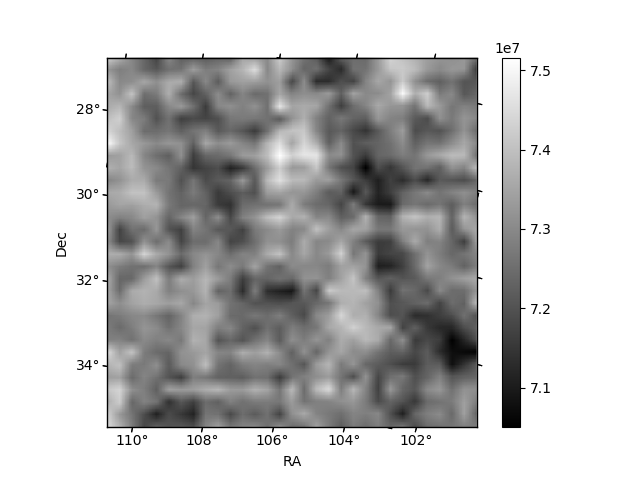
Quadrant B |
|---|---|---|---|
| Quadrant D | 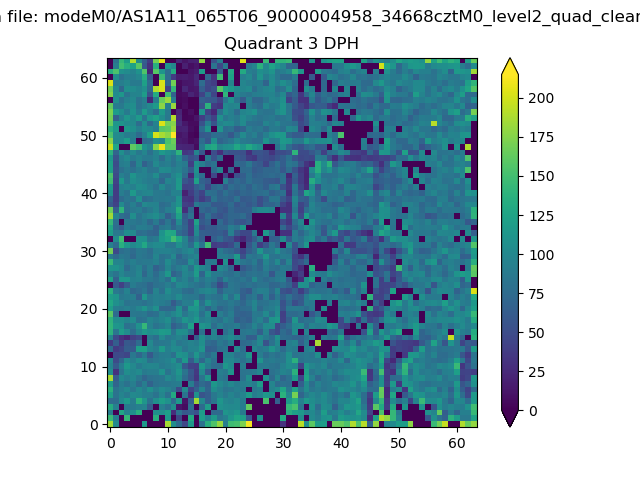 |
 |
Quadrant C |
| Plot type | Count rate plots | Images |
|---|---|---|
| Comparison with Poisson distribution Blue bars denote a histogram of data divided into 1 sec bins. Red curve is a Poisson curve with rate = median count rate of data. |
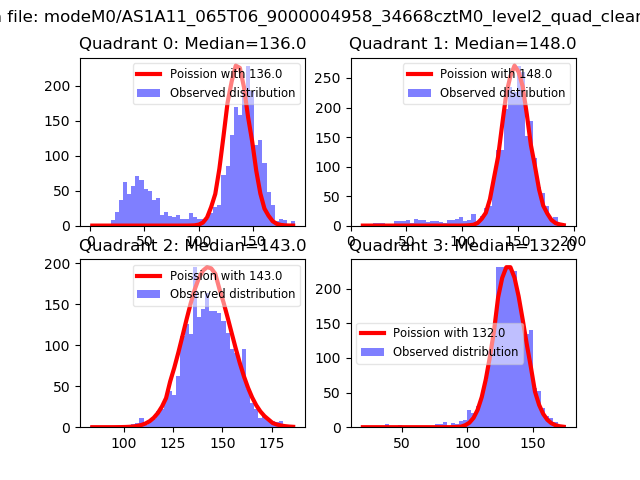 |
 |
| Quadrant-wise count rates Data is divided into 100 sec bins |
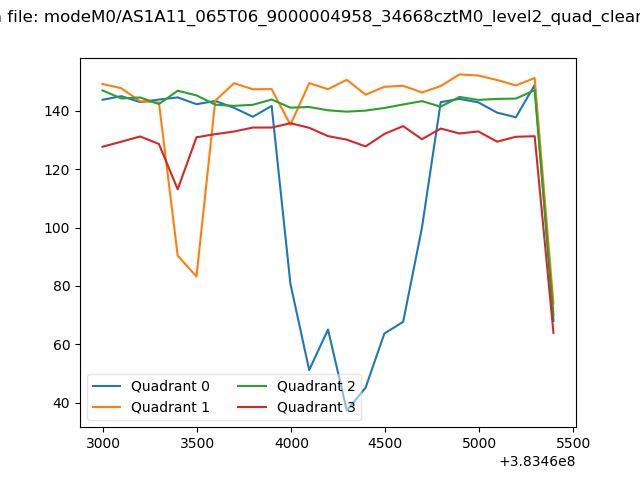 |
|
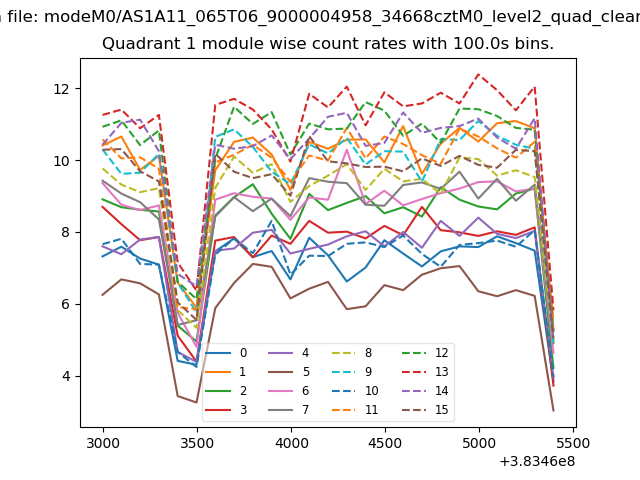
| Module-wise count rates for Quadrant A Data is divided into 100 sec bins |
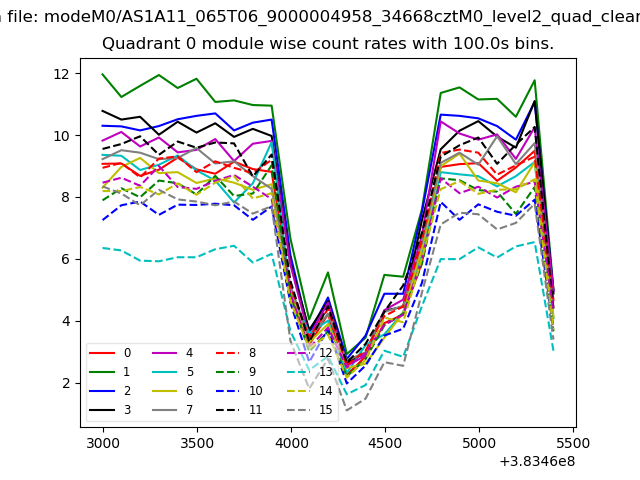 |
 |
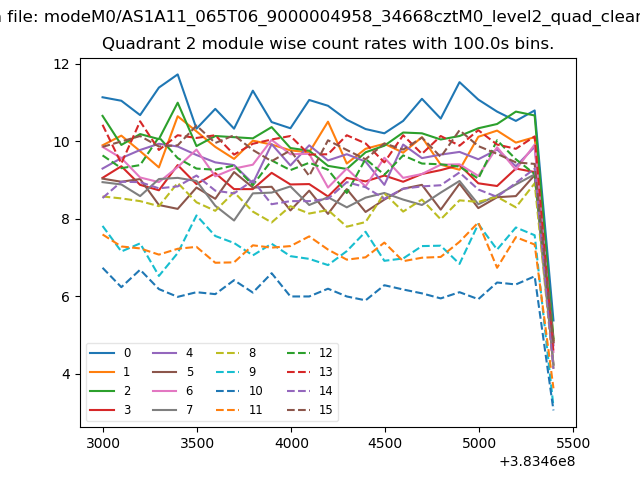
| Module-wise count rates for Quadrant B Data is divided into 100 sec bins |
 |
 |
| Module-wise count rates for Quadrant C Data is divided into 100 sec bins |
 |
 |
| Module-wise count rates for Quadrant D Data is divided into 100 sec bins |
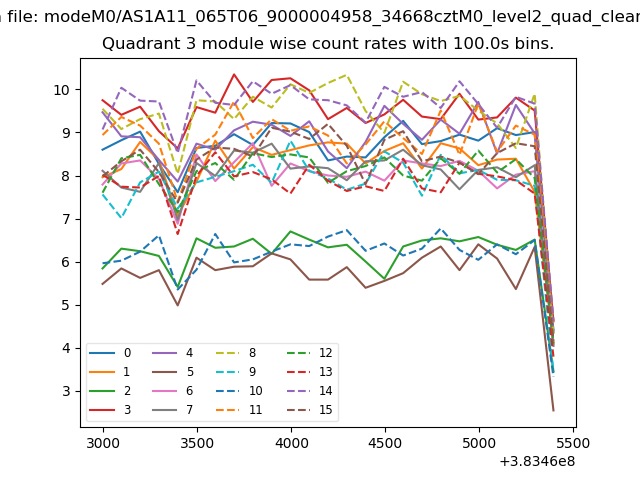 |
 |
| Parameter | Plot |
|---|---|
| CZT HV Monitor | 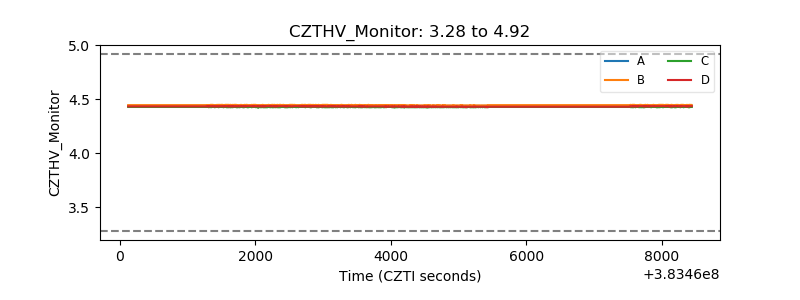 |
| D_VDD | 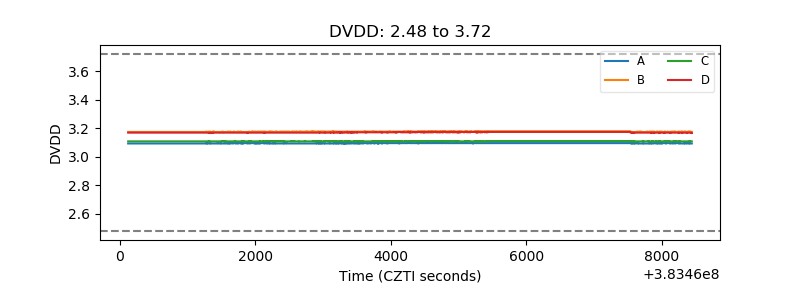 |
| Temperature 1 | 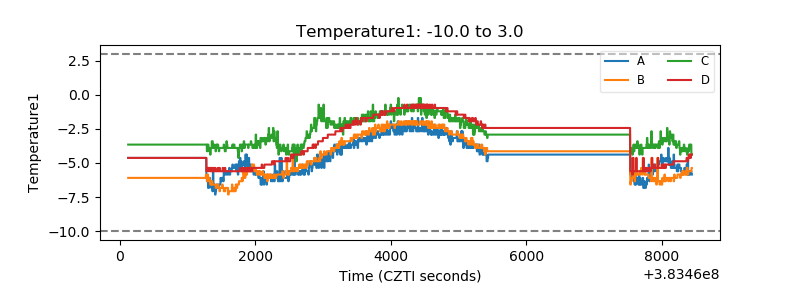 |
| Veto HV Monitor | 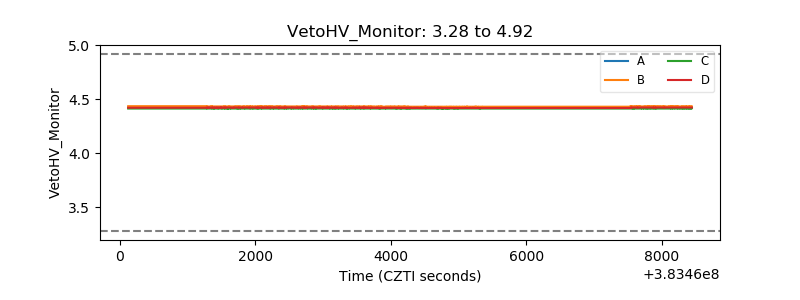 |
| Veto LLD | 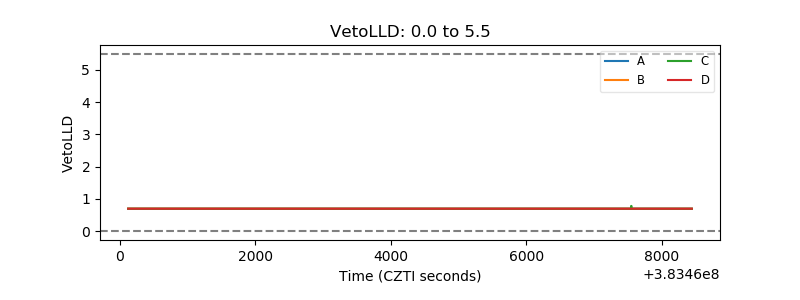 |
| Alpha Counter |  |
| _CPM_Rate | 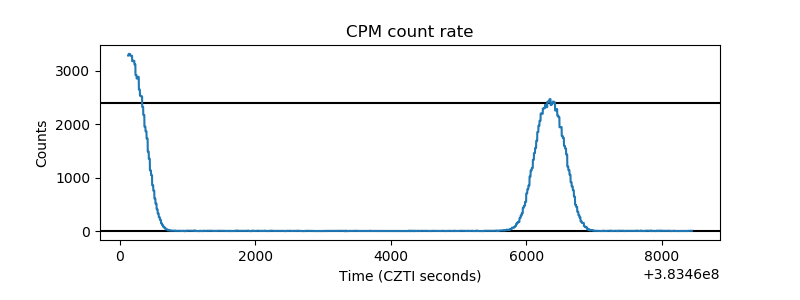 |
| CZT Counter | 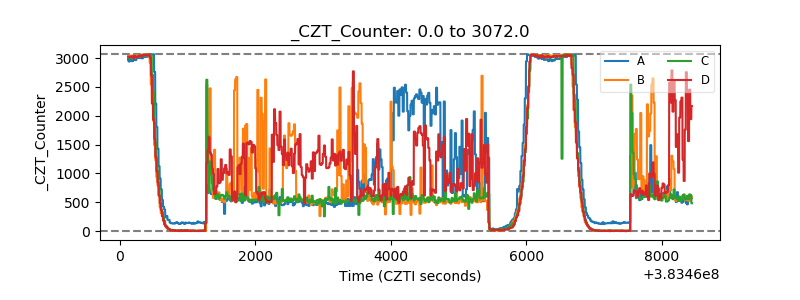 |
| +2.5 Volts monitor | 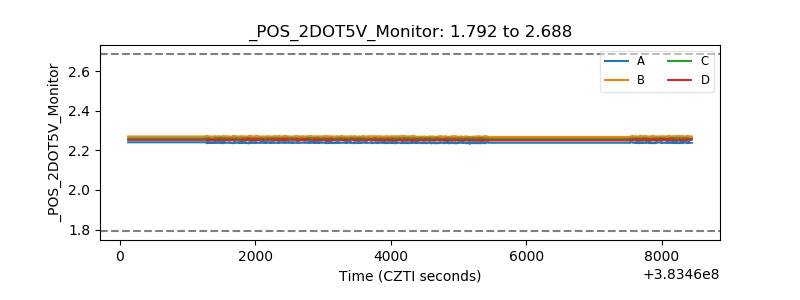 |
| +5 Volts monitor | 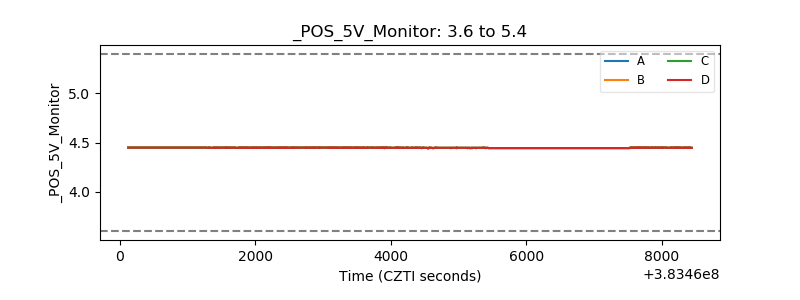 |
| _ROLL_ROT | 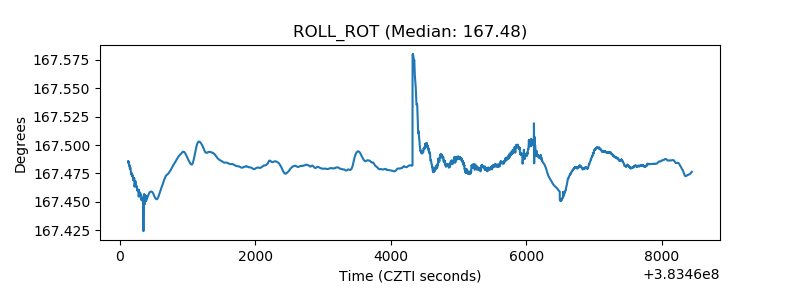 |
| _Roll_DEC | 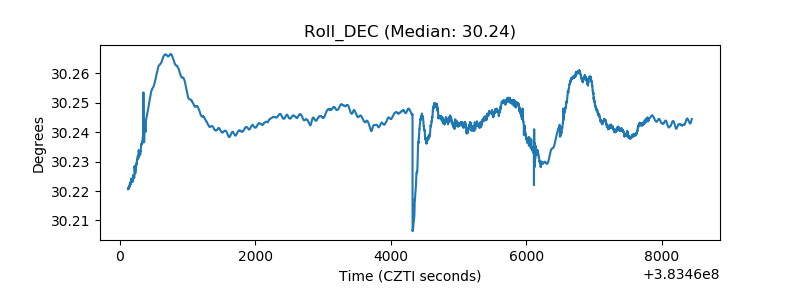 |
| _Roll_RA | 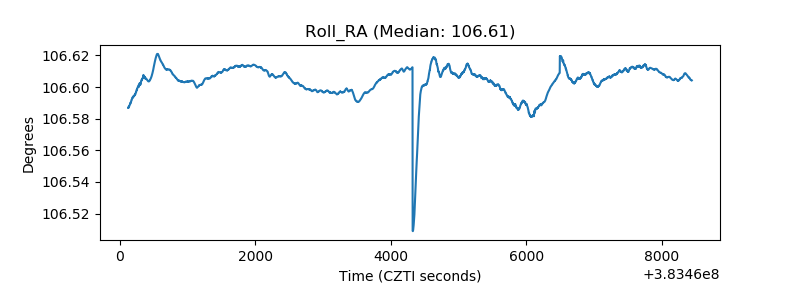 |
| Veto Counter | 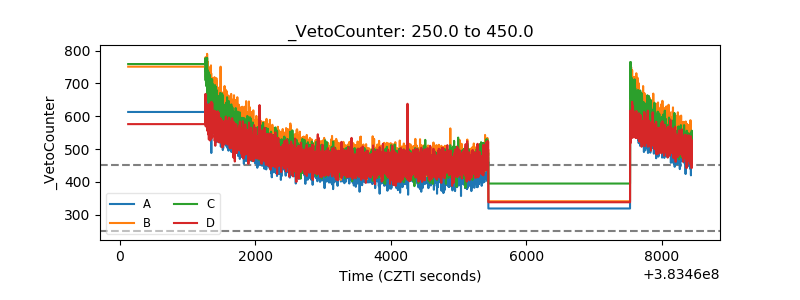 |