| Param | Original file | Final file |
|---|---|---|
| Filename | modeM0/AS1A11_065T06_9000004958_34665cztM0_level2.evt | modeM0/AS1A11_065T06_9000004958_34665cztM0_level2_quad_clean.evt |
| Size (bytes) | 82,393,920 | 10,221,120 |
| Size | 78.6 MB | 9.7 MB |
| Events in quadrant A | 437,768 | 63,172 |
| Events in quadrant B | 923,217 | 60,285 |
| Events in quadrant C | 543,886 | 59,360 |
| Events in quadrant D | 529,080 | 58,826 |
| Mode M0 | |||
|---|---|---|---|
| Quadrant | BADHDUFLAG | Total packets | Discarded packets |
| A | 0 | 1814 | 2 |
| B | 0 | 3313 | 1 |
| C | 0 | 2097 | 1 |
| D | 0 | 2088 | 1 |
| Mode SS | |||
|---|---|---|---|
| Quadrant | BADHDUFLAG | Total packets | Discarded packets |
| A | 0 | 16 | 0 |
| B | 0 | 16 | 0 |
| C | 0 | 16 | 0 |
| D | 0 | 16 | 0 |
| Mode M9 | |||
|---|---|---|---|
| Quadrant | BADHDUFLAG | Total packets | Discarded packets |
| A | 0 | 11 | 0 |
| B | 0 | 11 | 0 |
| C | 0 | 11 | 0 |
| D | 0 | 11 | 0 |
| Quadrant | Total seconds | Saturated seconds | Saturation percentage |
|---|---|---|---|
| A | 861 | 1 | 0.116144% |
| B | 861 | 171 | 19.860627% |
| C | 861 | 35 | 4.065041% |
| D | 861 | 1 | 0.116144% |
Noise dominated data is calculated using 1-second bins in cleaned event files. If a bin has >2000 counts, and if more than 50% of those come from <1% of pixels, then it is considered to be noise-dominated and hence unusable.
| Quadrant | # 1 sec bins | Bins with >0 counts | Bins with >2000 counts | High rate bins dominated by noise | Noise dominated (total time) | Noise dominated (detector-on time) | Marked lightcurve |
|---|---|---|---|---|---|---|---|
| A | 861 | 861 | 0 | 0 | 0.00% | 0.00% | 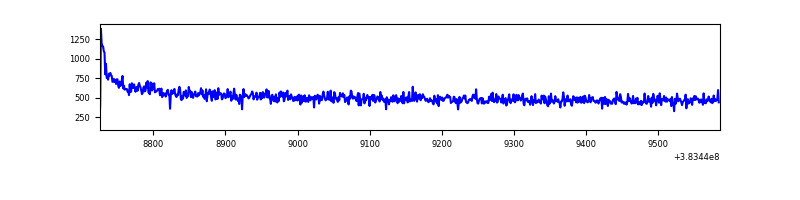 |
| B | 861 | 861 | 128 | 128 | 14.87% | 14.87% | 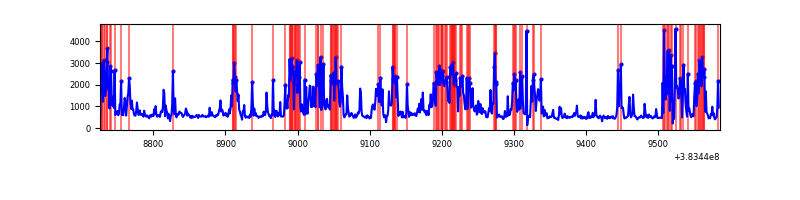 |
| C | 861 | 861 | 20 | 20 | 2.32% | 2.32% | 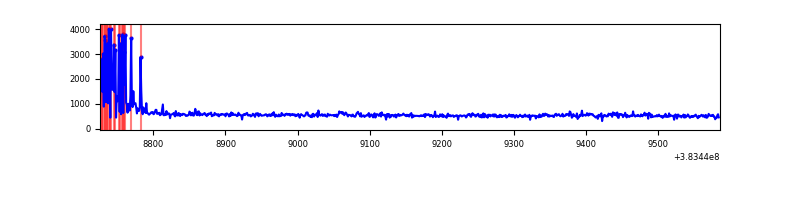 |
| D | 861 | 861 | 0 | 0 | 0.00% | 0.00% | 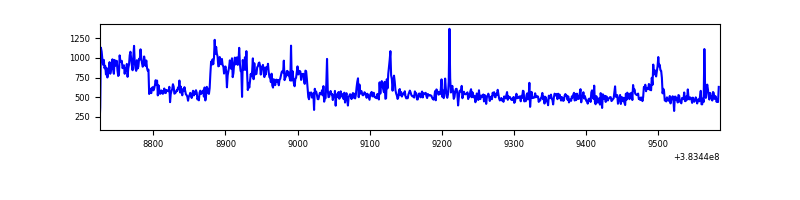 |
Top three noisy pixels from each quadrant. If the there are fewer than three noisy pixels in the level2.evt file, extra rows are filled as -1
| Pixel properties | Quadrant properties | ||||||
|---|---|---|---|---|---|---|---|
| Quadrant | DetID | PixID | Counts | Sigma | Mean | Median | Sigma |
| A | 10 | 83 | 19203 | 819.29 | 106 | 105 | 23.3 |
| A | 13 | 6 | 4229 | 176.92 | 106 | 105 | 23.3 |
| A | 13 | 254 | 1480 | 58.99 | 106 | 105 | 23.3 |
| B | 5 | 172 | 493723 | 22973.12 | 100 | 98 | 21.5 |
| B | 5 | 255 | 26360 | 1222.22 | 100 | 98 | 21.5 |
| B | 0 | 189 | 3907 | 177.27 | 100 | 98 | 21.5 |
| C | 0 | 10 | 90418 | 3482.91 | 103 | 103 | 25.9 |
| C | 15 | 214 | 39950 | 1536.66 | 103 | 103 | 25.9 |
| C | 14 | 67 | 8747 | 333.35 | 103 | 103 | 25.9 |
| D | 8 | 195 | 122928 | 4499.25 | 102 | 99 | 27.3 |
| D | 2 | 250 | 7497 | 270.99 | 102 | 99 | 27.3 |
| D | 2 | 234 | 3569 | 127.11 | 102 | 99 | 27.3 |
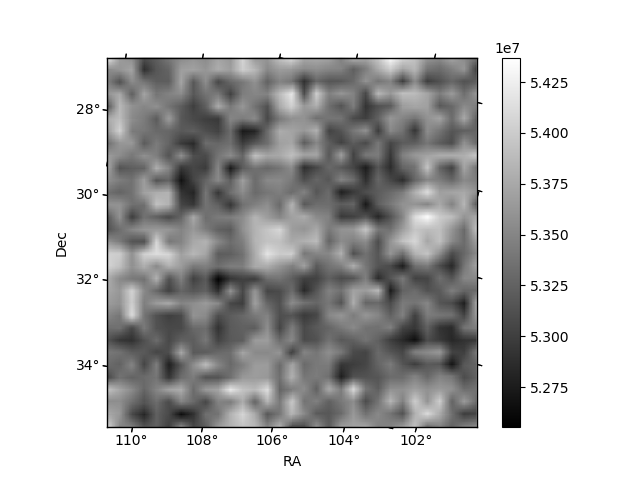
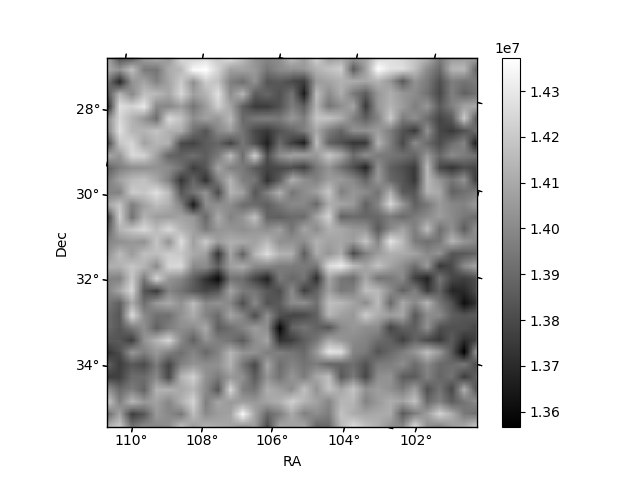
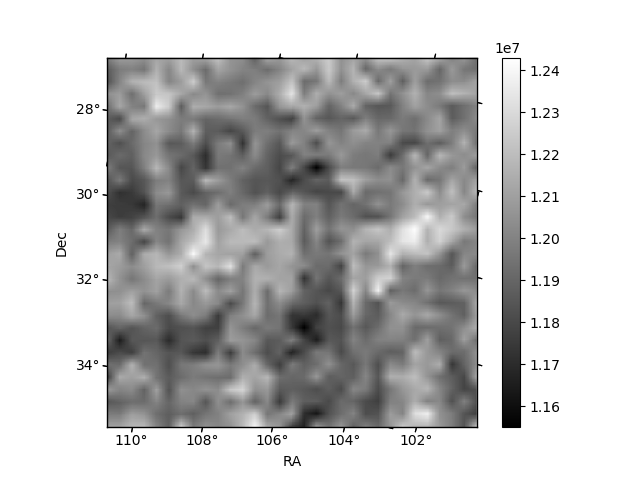
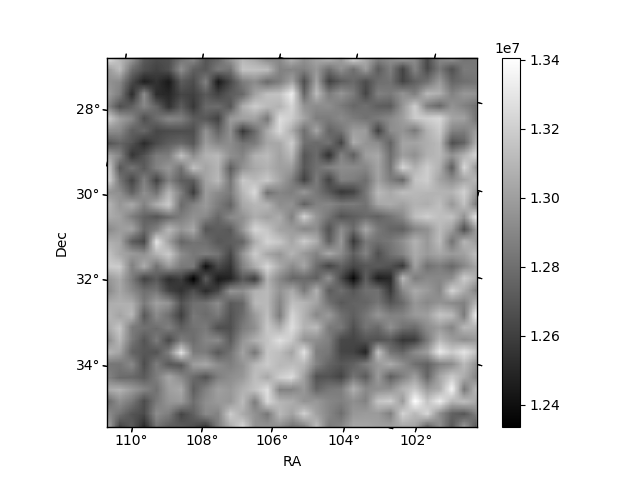
Histogram calculated using DETX and DETY for each event in the final _common_clean file
| Quadrant A | 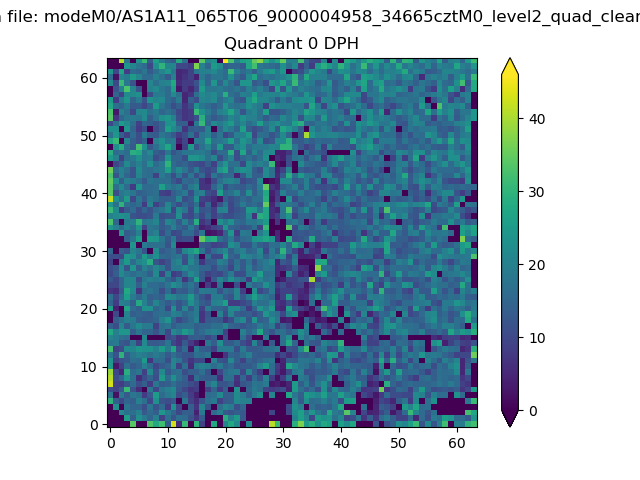 |
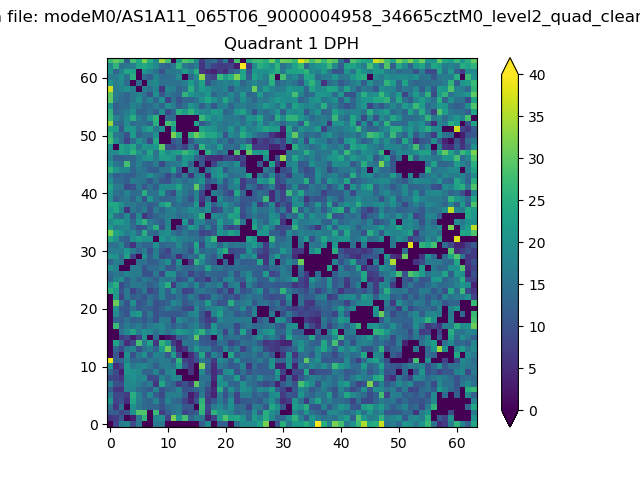 |
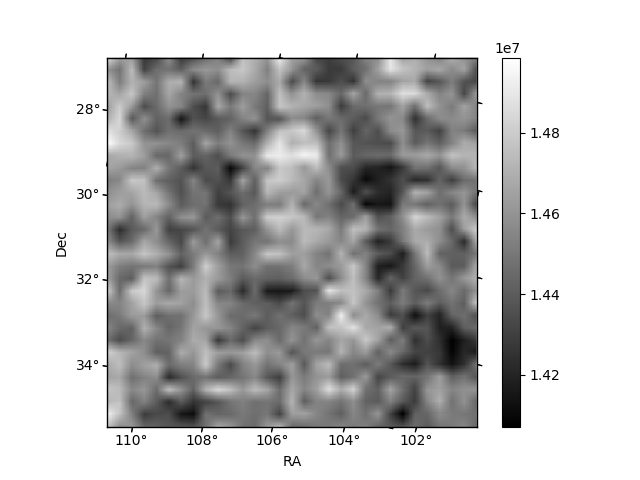
Quadrant B |
|---|---|---|---|
| Quadrant D | 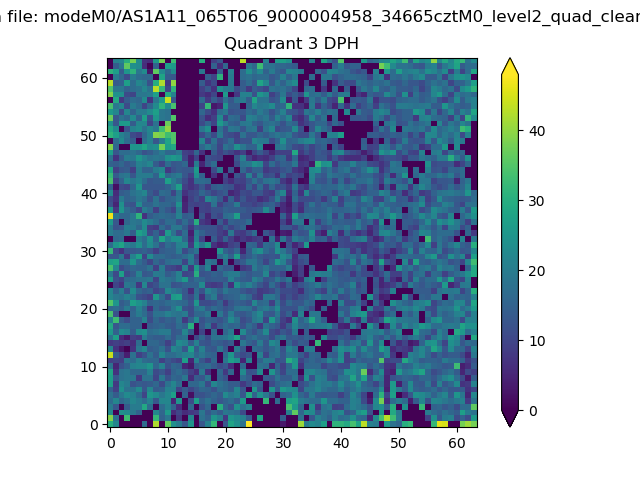 |
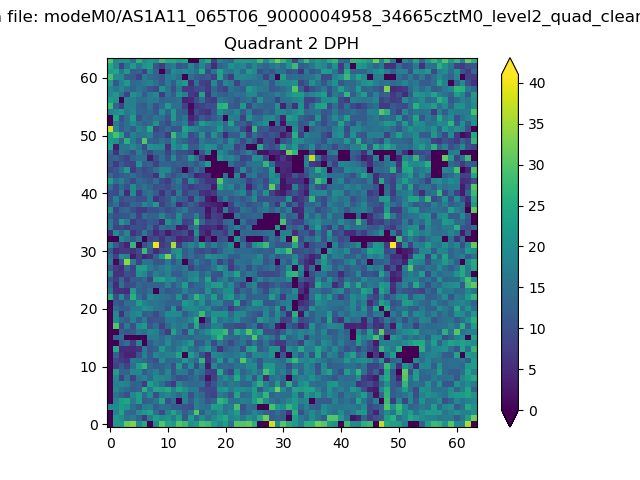 |
Quadrant C |
| Plot type | Count rate plots | Images |
|---|---|---|
| Comparison with Poisson distribution Blue bars denote a histogram of data divided into 1 sec bins. Red curve is a Poisson curve with rate = median count rate of data. |
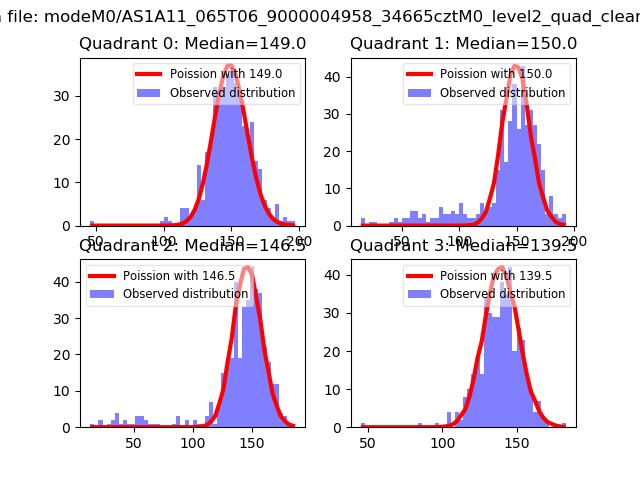 |
 |
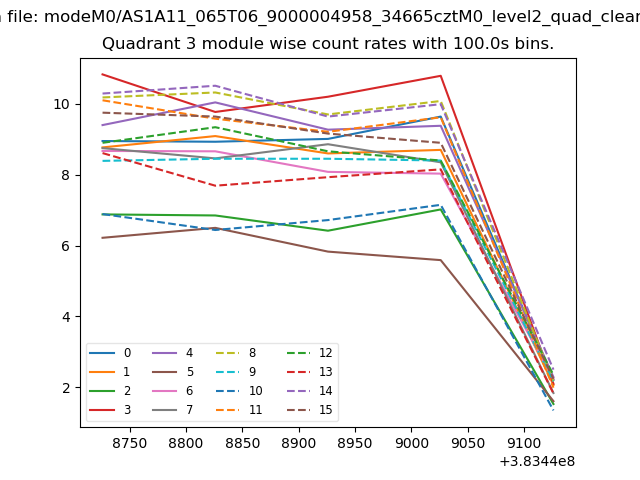
| Quadrant-wise count rates Data is divided into 100 sec bins |
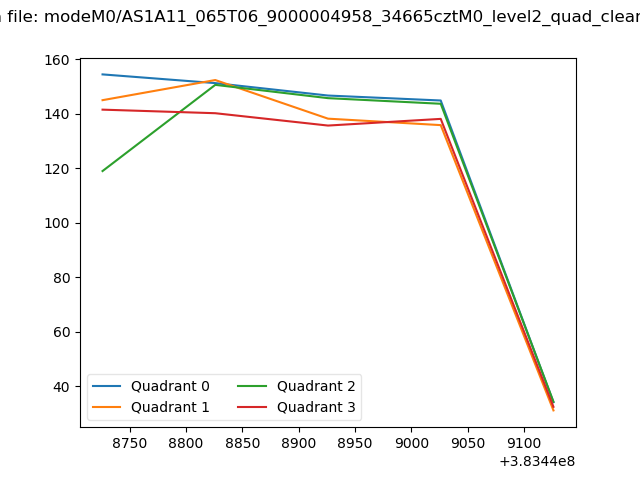 |
|
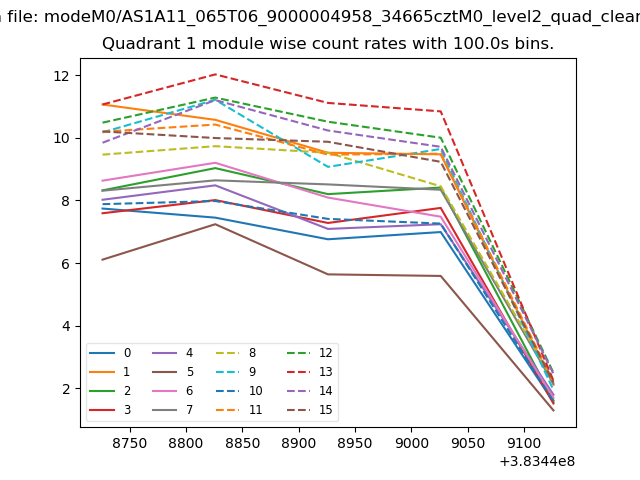
| Module-wise count rates for Quadrant A Data is divided into 100 sec bins |
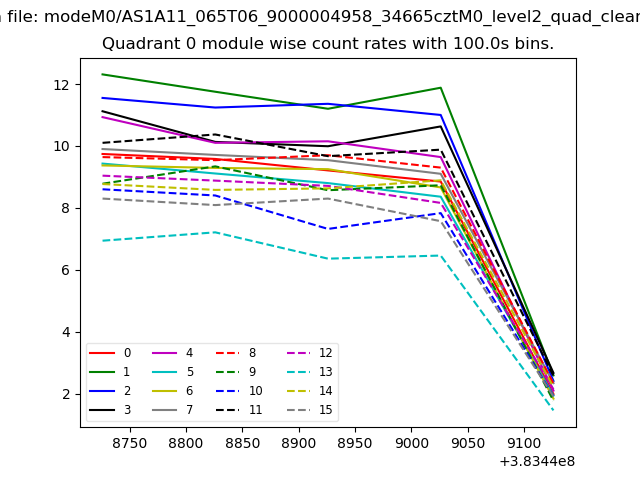 |
 |
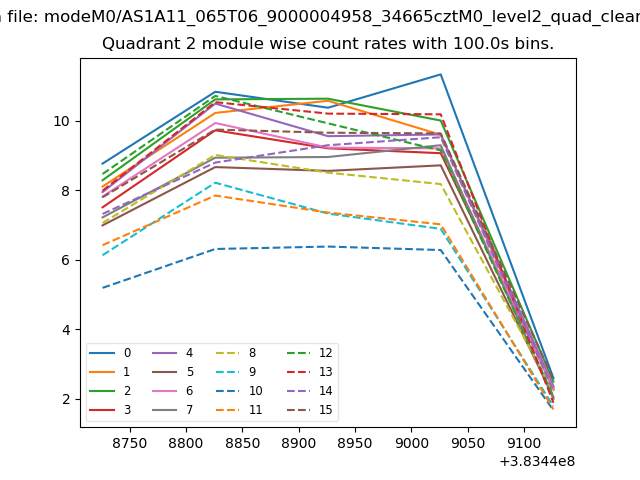
| Module-wise count rates for Quadrant B Data is divided into 100 sec bins |
 |
 |
| Module-wise count rates for Quadrant C Data is divided into 100 sec bins |
 |
 |
| Module-wise count rates for Quadrant D Data is divided into 100 sec bins |
 |
 |
| Parameter | Plot |
|---|---|
| CZT HV Monitor | 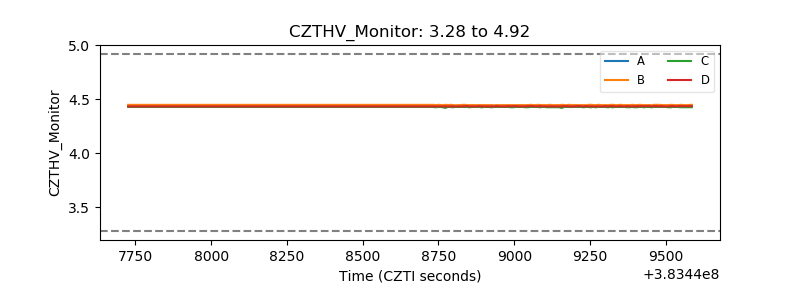 |
| D_VDD | 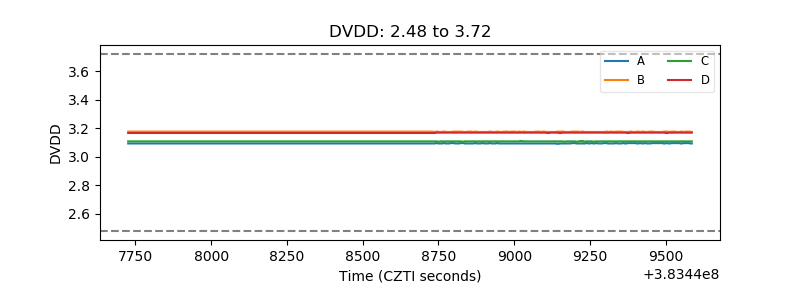 |
| Temperature 1 | 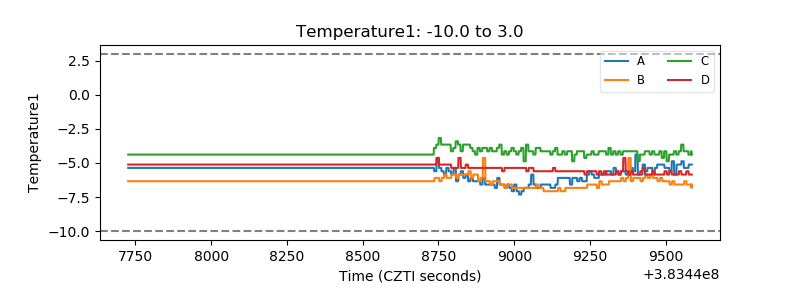 |
| Veto HV Monitor | 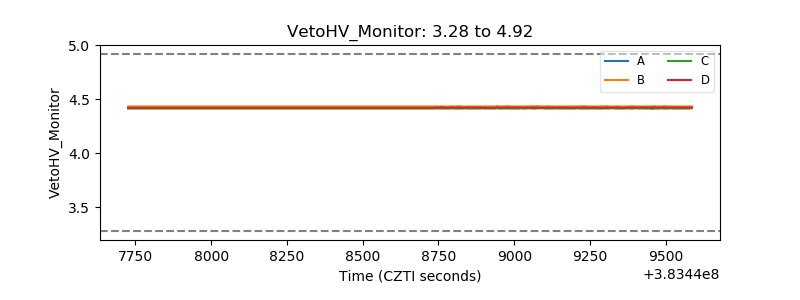 |
| Veto LLD | 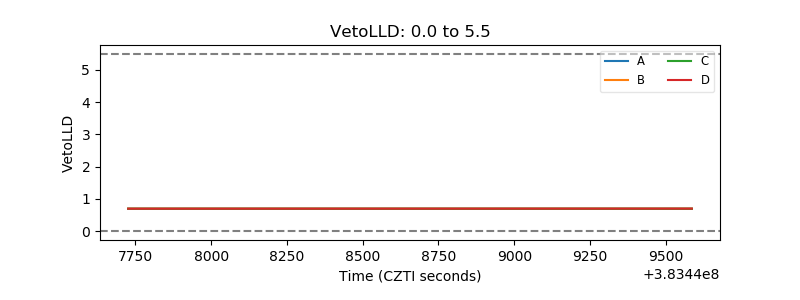 |
| Alpha Counter | 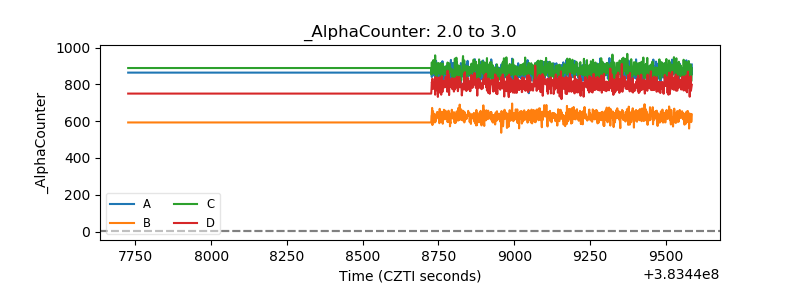 |
| _CPM_Rate | 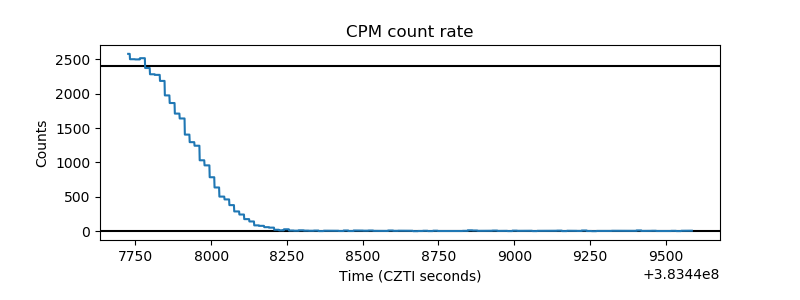 |
| CZT Counter | 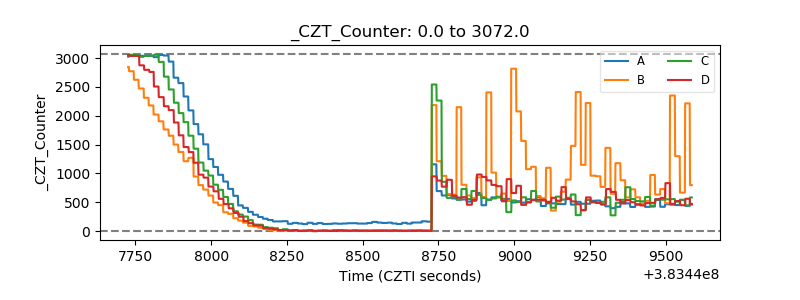 |
| +2.5 Volts monitor | 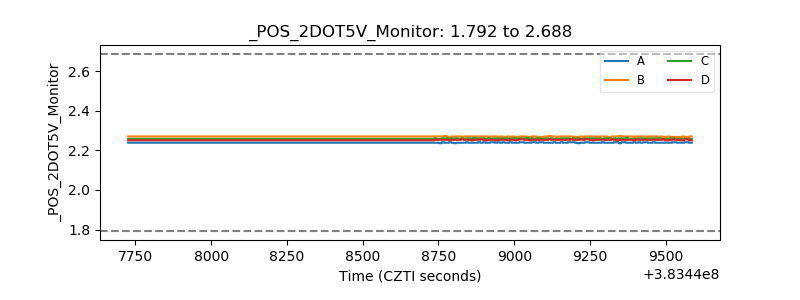 |
| +5 Volts monitor | 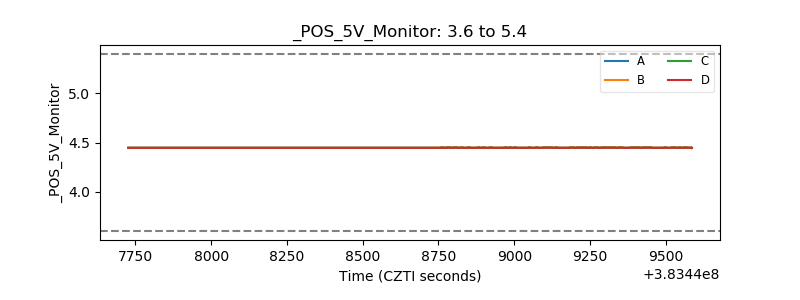 |
| _ROLL_ROT | 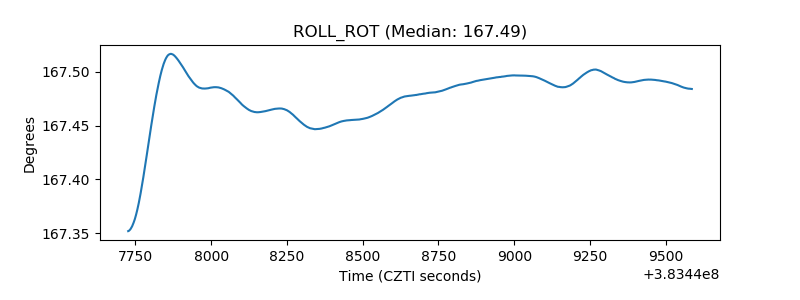 |
| _Roll_DEC | 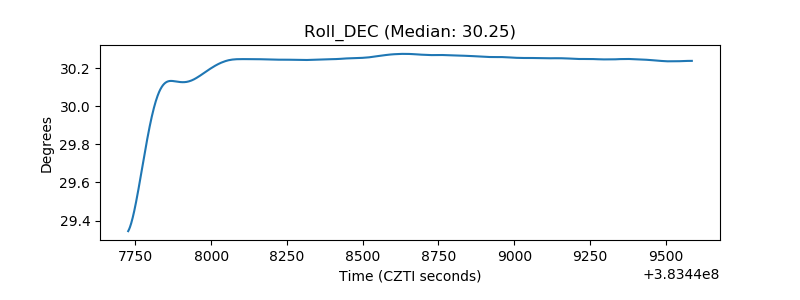 |
| _Roll_RA | 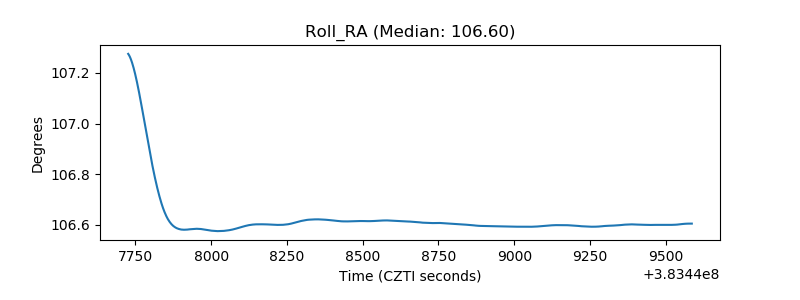 |
| Veto Counter | 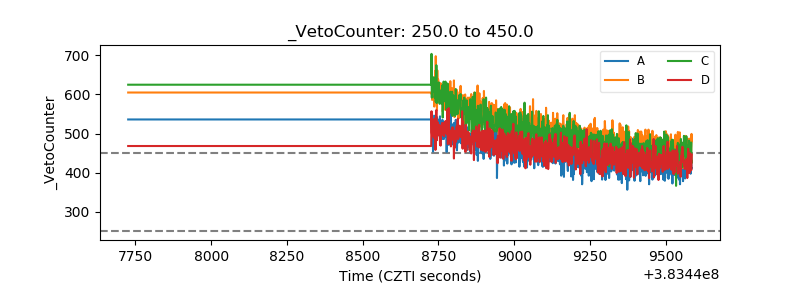 |