| Param | Original file | Final file |
|---|---|---|
| Filename | modeM0/AS1A11_065T06_9000004958cztM0_level2_bc.evt | modeM0/AS1A11_065T06_9000004958cztM0_level2_quad_clean.evt |
| Size (bytes) | 1,818,109,440 | 407,928,960 |
| Size | 1.7 GB | 389.0 MB |
| Events in quadrant A | 11,859,979 | 2,575,969 |
| Events in quadrant B | 11,647,972 | 2,699,713 |
| Events in quadrant C | 8,433,144 | 2,693,064 |
| Events in quadrant D | 21,162,114 | 2,405,421 |
| Mode M0 | |||
|---|---|---|---|
| Quadrant | BADHDUFLAG | Total packets | Discarded packets |
| A | 0 | 85146 | 0 |
| B | 0 | 81538 | 0 |
| C | 0 | 63378 | 0 |
| D | 0 | 111472 | 0 |
| Mode SS | |||
|---|---|---|---|
| Quadrant | BADHDUFLAG | Total packets | Discarded packets |
| A | 0 | 588 | 0 |
| B | 0 | 588 | 0 |
| C | 0 | 588 | 0 |
| D | 0 | 588 | 0 |
| Mode M9 | |||
|---|---|---|---|
| Quadrant | BADHDUFLAG | Total packets | Discarded packets |
| A | 0 | 131 | 0 |
| B | 0 | 131 | 0 |
| C | 0 | 131 | 0 |
| D | 0 | 131 | 0 |
| Quadrant | Total seconds | Saturated seconds | Saturation percentage |
|---|---|---|---|
| A | 28797 | 2320 | 8.056395% |
| B | 28797 | 2195 | 7.622322% |
| C | 28797 | 251 | 0.871619% |
| D | 28797 | 2631 | 9.136368% |
Noise dominated data is calculated using 1-second bins in cleaned event files. If a bin has >2000 counts, and if more than 50% of those come from <1% of pixels, then it is considered to be noise-dominated and hence unusable.
| Quadrant | # 1 sec bins | Bins with >0 counts | Bins with >2000 counts | High rate bins dominated by noise | Noise dominated (total time) | Noise dominated (detector-on time) | Marked lightcurve |
|---|---|---|---|---|---|---|---|
| A | 40844 | 28801 | 45 | 45 | 0.11% | 0.16% | 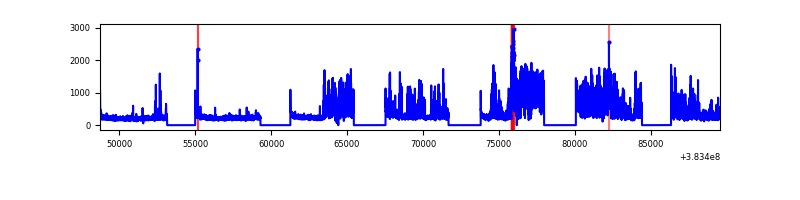 |
| B | 40843 | 28794 | 245 | 245 | 0.60% | 0.85% | 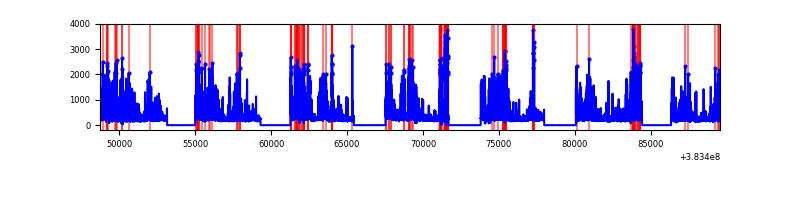 |
| C | 40843 | 28795 | 46 | 46 | 0.11% | 0.16% | 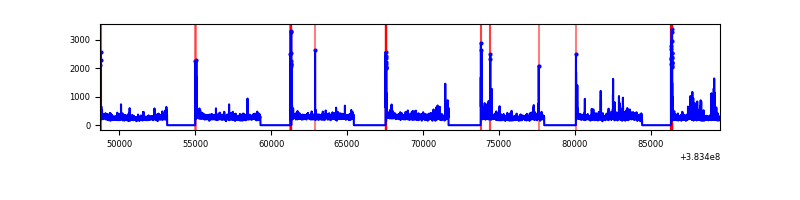 |
| D | 40843 | 28791 | 351 | 351 | 0.86% | 1.22% | 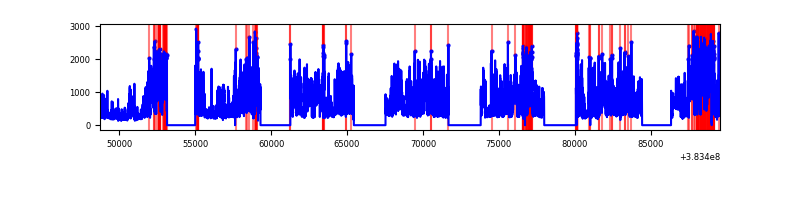 |
Top three noisy pixels from each quadrant. If the there are fewer than three noisy pixels in the level2.evt file, extra rows are filled as -1
| Pixel properties | Quadrant properties | ||||||
|---|---|---|---|---|---|---|---|
| Quadrant | DetID | PixID | Counts | Sigma | Mean | Median | Sigma |
| A | 15 | 169 | 5359978 | 15877.64 | 1567 | 1547 | 337.5 |
| A | 10 | 83 | 176357 | 517.98 | 1567 | 1547 | 337.5 |
| A | 15 | 174 | 100298 | 292.61 | 1567 | 1547 | 337.5 |
| B | 5 | 172 | 2787541 | 8974.75 | 1597 | 1572 | 310.4 |
| B | 5 | 255 | 1220059 | 3925.25 | 1597 | 1572 | 310.4 |
| B | 10 | 245 | 446753 | 1434.11 | 1597 | 1572 | 310.4 |
| C | 15 | 214 | 1166185 | 3288.66 | 1573 | 1569 | 354.1 |
| C | 0 | 10 | 506237 | 1425.09 | 1573 | 1569 | 354.1 |
| C | 14 | 67 | 414012 | 1164.66 | 1573 | 1569 | 354.1 |
| D | 8 | 195 | 9700188 | 25055.99 | 1504 | 1471 | 387.1 |
| D | 12 | 233 | 1305231 | 3368.18 | 1504 | 1471 | 387.1 |
| D | 2 | 249 | 970025 | 2502.19 | 1504 | 1471 | 387.1 |
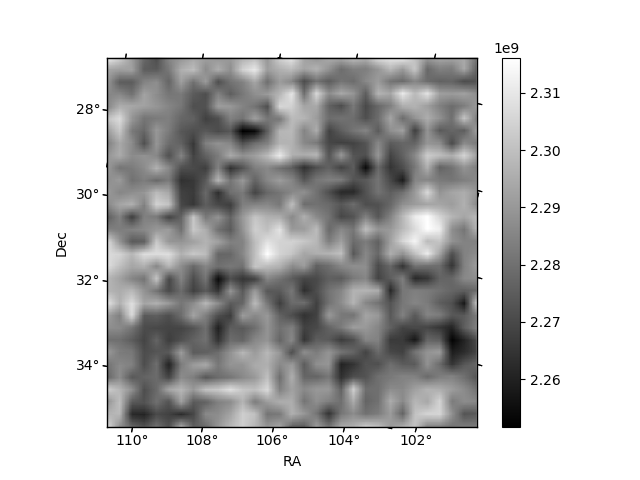
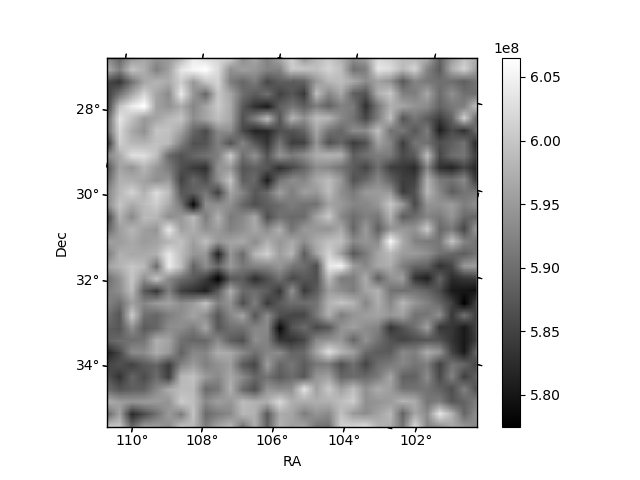
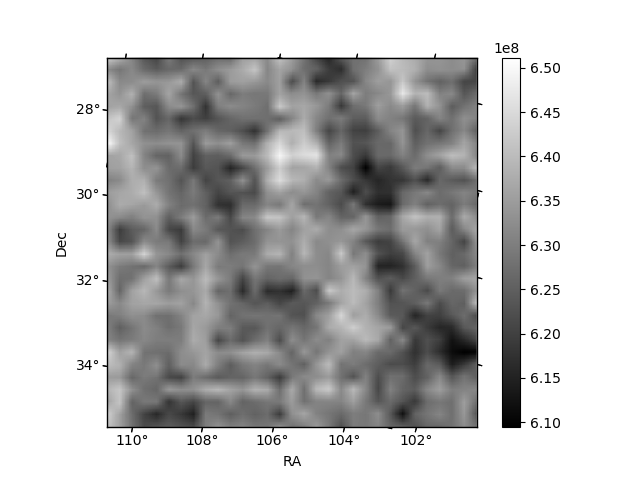
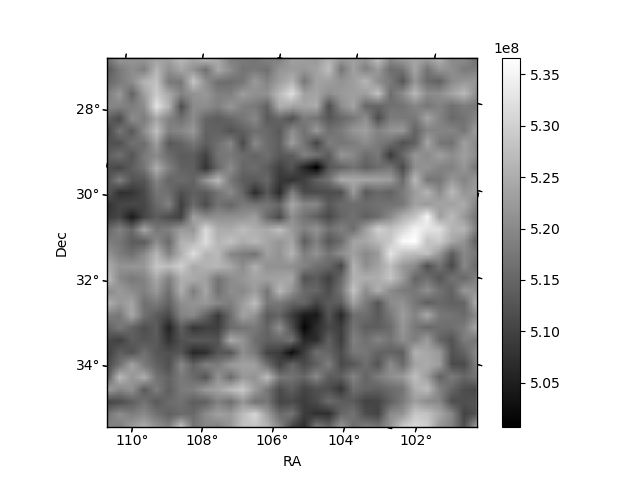
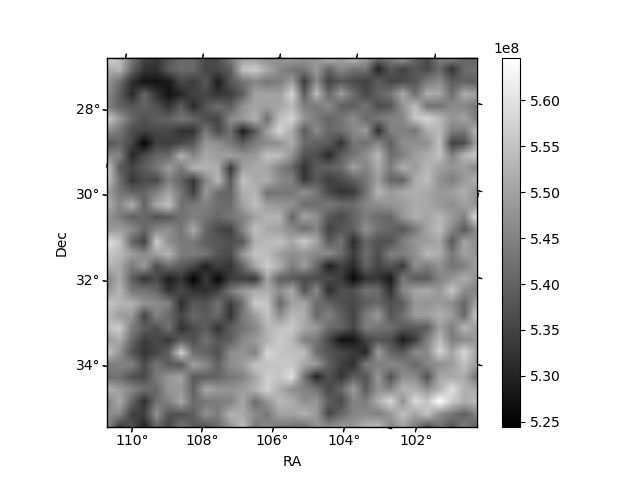
Histogram calculated using DETX and DETY for each event in the final _common_clean file
| Quadrant A | 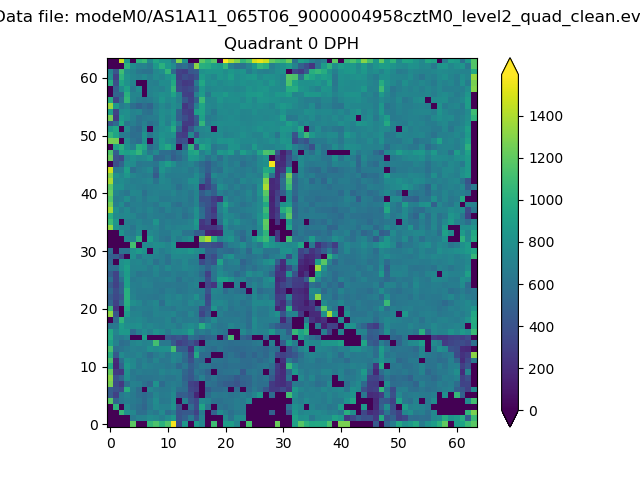 |
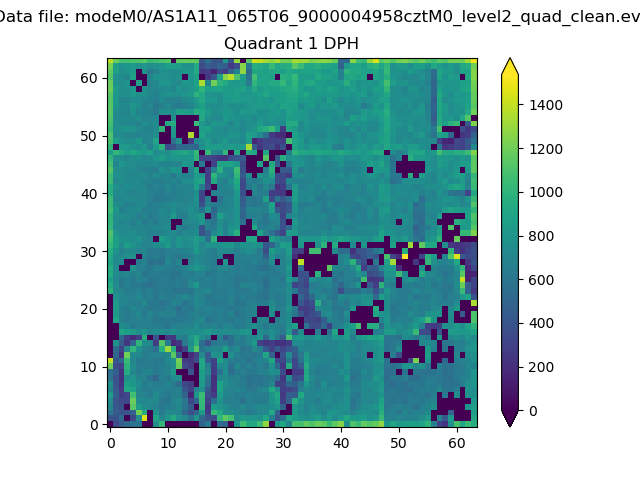 |
Quadrant B |
|---|---|---|---|
| Quadrant D | 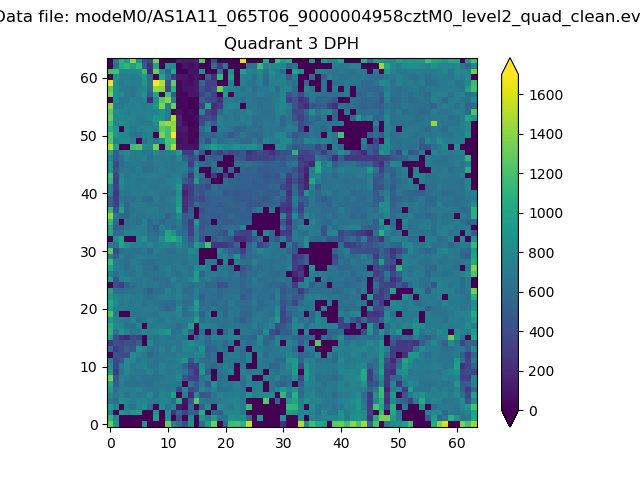 |
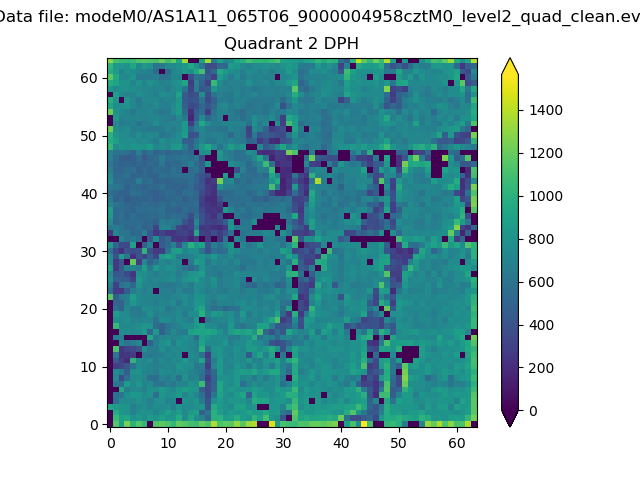 |
Quadrant C |
| Plot type | Count rate plots | Images |
|---|---|---|
| Comparison with Poisson distribution Blue bars denote a histogram of data divided into 1 sec bins. Red curve is a Poisson curve with rate = median count rate of data. |
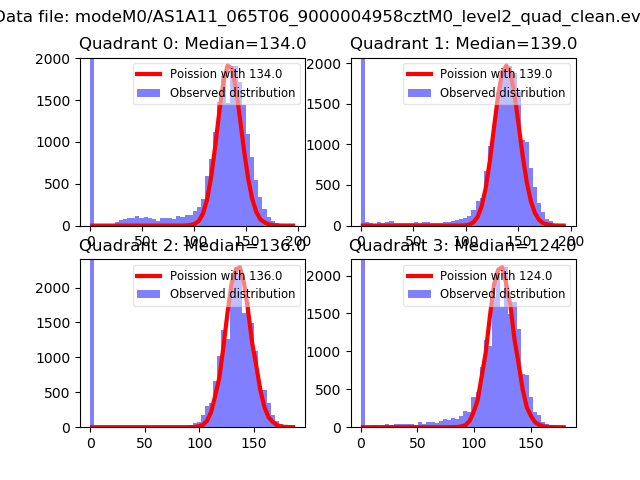 |
 |
| Quadrant-wise count rates Data is divided into 100 sec bins |
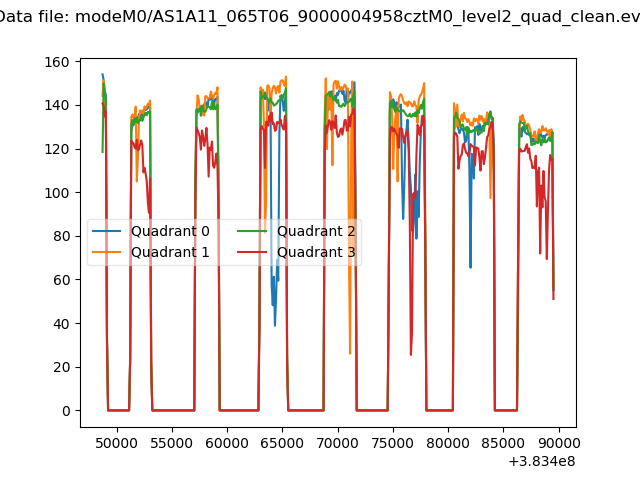 |
|
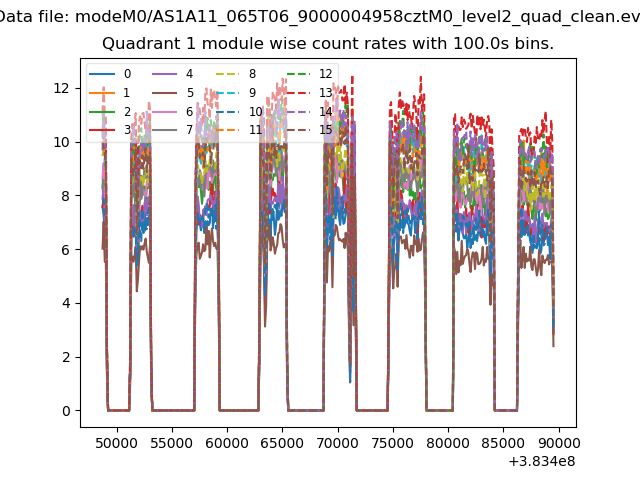
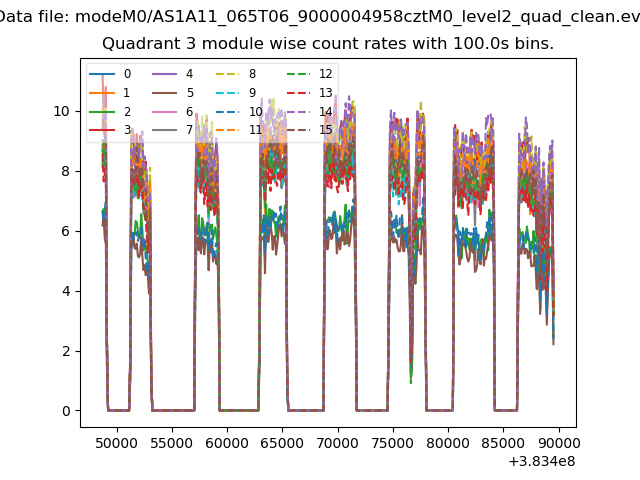
| Module-wise count rates for Quadrant A Data is divided into 100 sec bins |
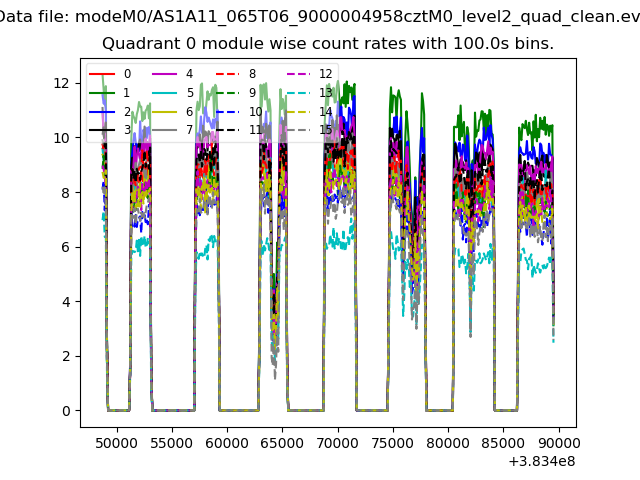 |
 |
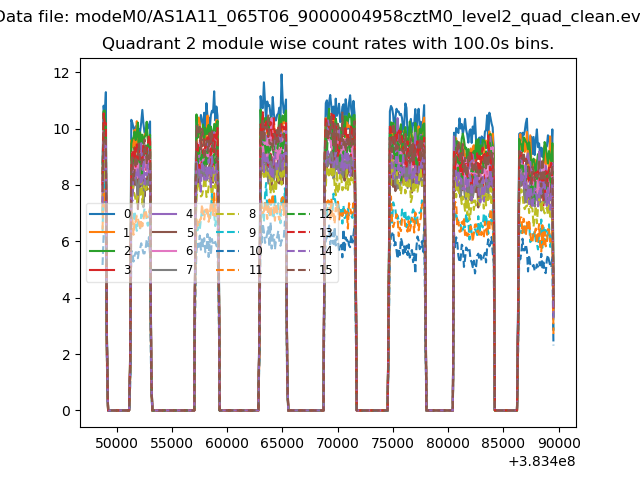
| Module-wise count rates for Quadrant B Data is divided into 100 sec bins |
 |
 |
| Module-wise count rates for Quadrant C Data is divided into 100 sec bins |
 |
 |
| Module-wise count rates for Quadrant D Data is divided into 100 sec bins |
 |
 |
| Parameter | Plot |
|---|---|
| CZT HV Monitor | 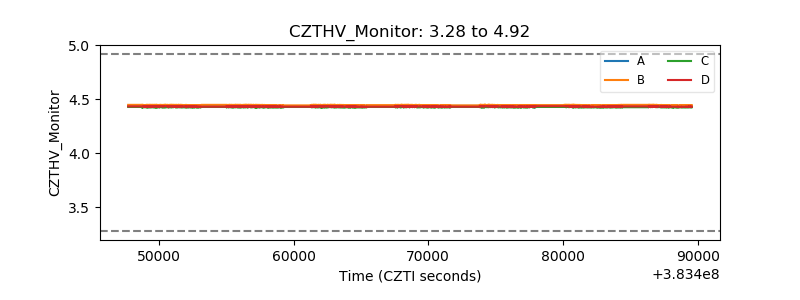 |
| D_VDD | 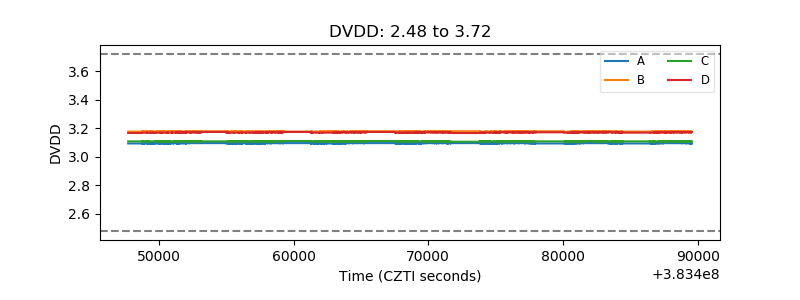 |
| Temperature 1 | 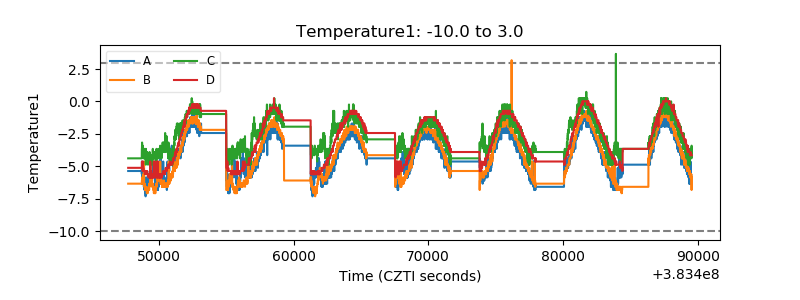 |
| Veto HV Monitor | 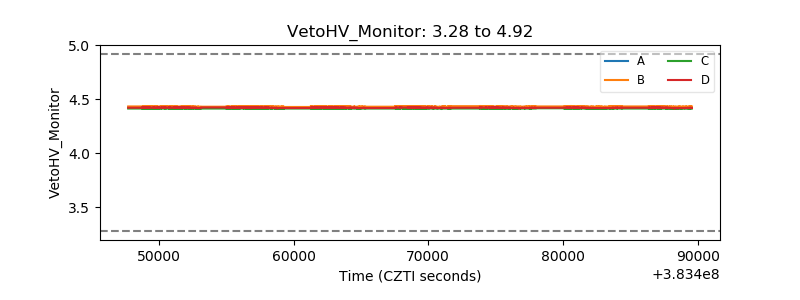 |
| Veto LLD | 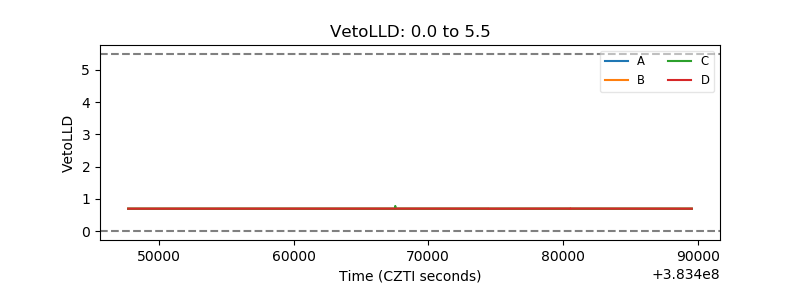 |
| Alpha Counter | 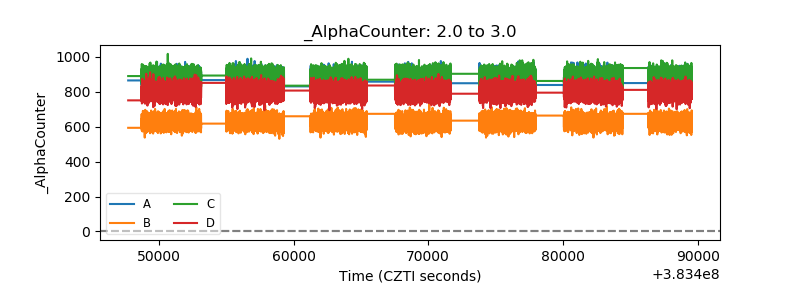 |
| _CPM_Rate |  |
| CZT Counter | 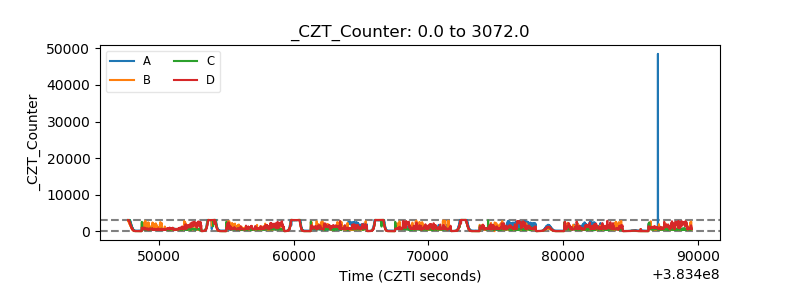 |
| +2.5 Volts monitor | 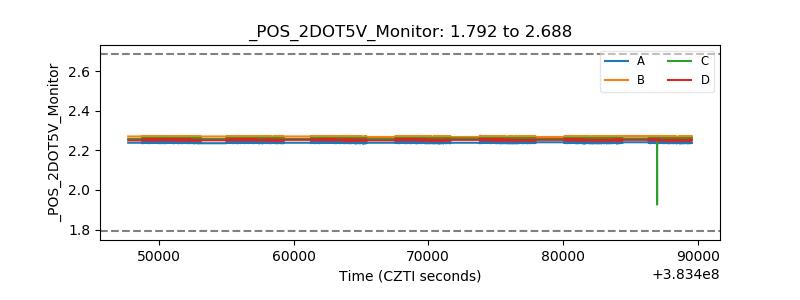 |
| +5 Volts monitor | 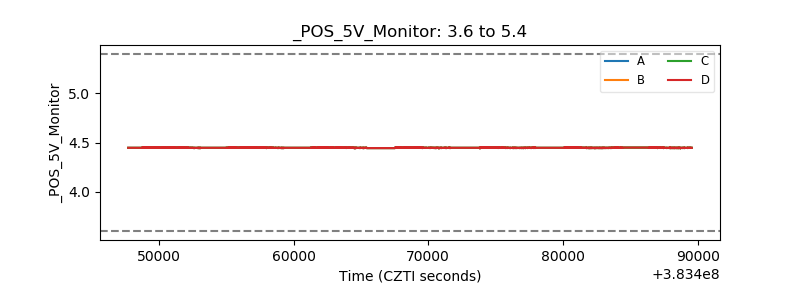 |
| _ROLL_ROT | 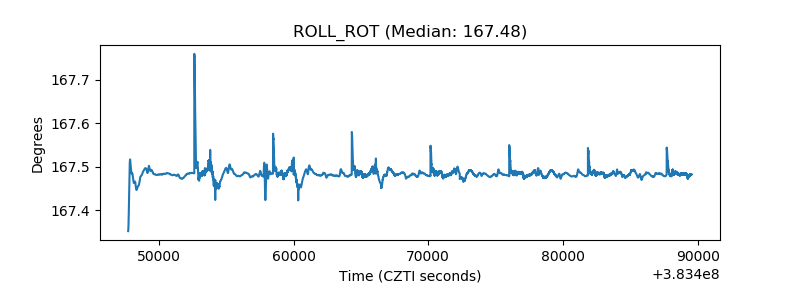 |
| _Roll_DEC | 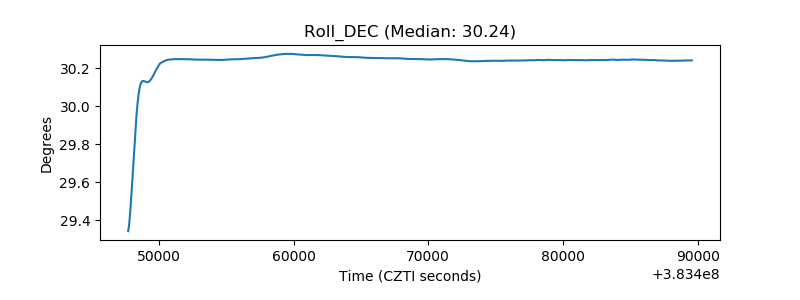 |
| _Roll_RA | 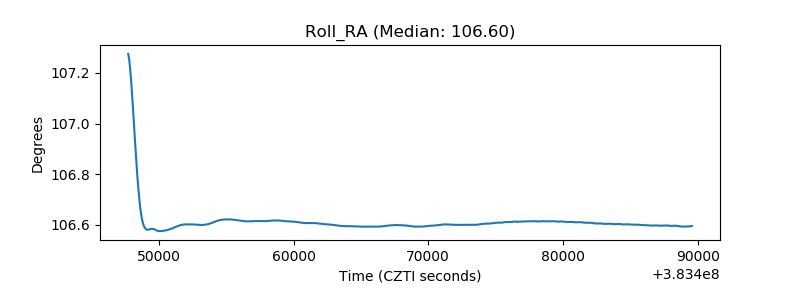 |
| Veto Counter | 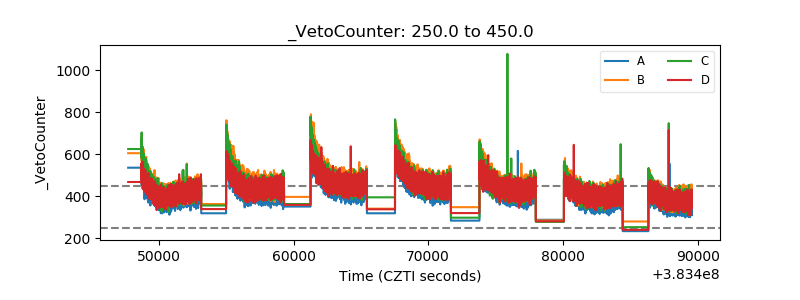 |