| Param | Original file | Final file |
|---|---|---|
| Filename | modeM0/AS1T05_008T01_9000004956_34662cztM0_level2.evt | modeM0/AS1T05_008T01_9000004956_34662cztM0_level2_quad_clean.evt |
| Size (bytes) | 1,466,475,840 | 222,258,240 |
| Size | 1.4 GB | 212.0 MB |
| Events in quadrant A | 7,248,353 | 1,441,961 |
| Events in quadrant B | 11,804,973 | 1,399,668 |
| Events in quadrant C | 8,009,565 | 1,446,231 |
| Events in quadrant D | 16,284,278 | 1,352,823 |
| Mode SS | |||
|---|---|---|---|
| Quadrant | BADHDUFLAG | Total packets | Discarded packets |
| A | 0 | 324 | 0 |
| B | 0 | 324 | 0 |
| C | 0 | 324 | 0 |
| D | 0 | 324 | 0 |
| Mode M9 | |||
|---|---|---|---|
| Quadrant | BADHDUFLAG | Total packets | Discarded packets |
| A | 0 | 54 | 0 |
| B | 0 | 54 | 0 |
| C | 0 | 54 | 0 |
| D | 0 | 54 | 0 |
| Mode M0 | |||
|---|---|---|---|
| Quadrant | BADHDUFLAG | Total packets | Discarded packets |
| A | 0 | 32468 | 5 |
| B | 0 | 45647 | 4 |
| C | 0 | 33448 | 4 |
| D | 0 | 59106 | 4 |
| Quadrant | Total seconds | Saturated seconds | Saturation percentage |
|---|---|---|---|
| A | 15814 | 44 | 0.278234% |
| B | 15814 | 1350 | 8.536740% |
| C | 15814 | 124 | 0.784115% |
| D | 15814 | 1498 | 9.472619% |
Noise dominated data is calculated using 1-second bins in cleaned event files. If a bin has >2000 counts, and if more than 50% of those come from <1% of pixels, then it is considered to be noise-dominated and hence unusable.
| Quadrant | # 1 sec bins | Bins with >0 counts | Bins with >2000 counts | High rate bins dominated by noise | Noise dominated (total time) | Noise dominated (detector-on time) | Marked lightcurve |
|---|---|---|---|---|---|---|---|
| A | 21275 | 15818 | 19 | 19 | 0.09% | 0.12% | 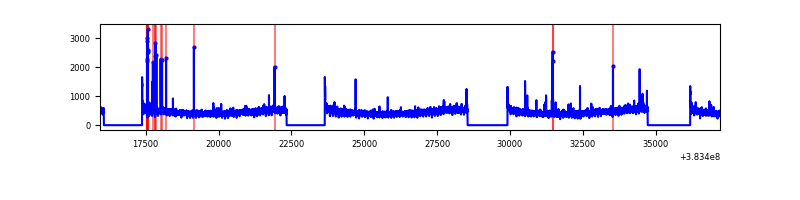 |
| B | 21275 | 15818 | 877 | 877 | 4.12% | 5.54% | 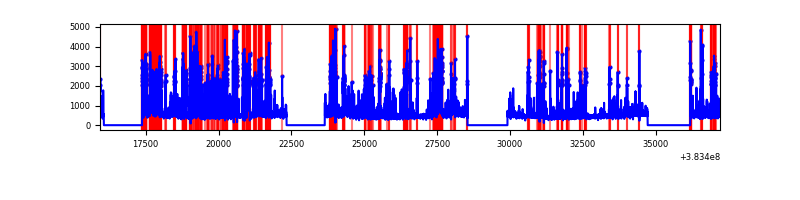 |
| C | 21275 | 15818 | 64 | 64 | 0.30% | 0.40% | 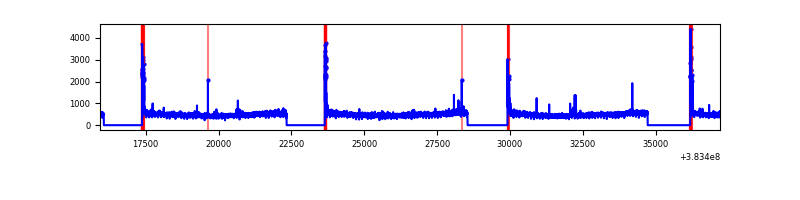 |
| D | 21275 | 15818 | 1274 | 1274 | 5.99% | 8.05% | 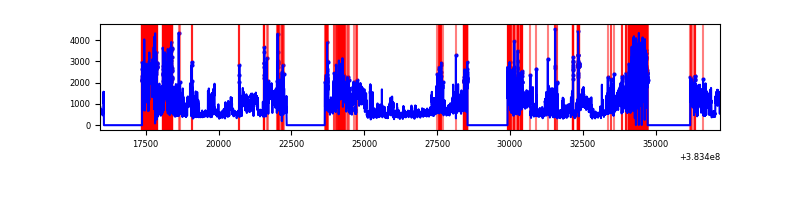 |
Top three noisy pixels from each quadrant. If the there are fewer than three noisy pixels in the level2.evt file, extra rows are filled as -1
| Pixel properties | Quadrant properties | ||||||
|---|---|---|---|---|---|---|---|
| Quadrant | DetID | PixID | Counts | Sigma | Mean | Median | Sigma |
| A | 10 | 83 | 105367 | 286.17 | 1804 | 1770 | 362.0 |
| A | 9 | 143 | 91922 | 249.03 | 1804 | 1770 | 362.0 |
| A | 15 | 174 | 32214 | 84.1 | 1804 | 1770 | 362.0 |
| B | 5 | 172 | 4055685 | 12098.41 | 1742 | 1694 | 335.1 |
| B | 5 | 255 | 540158 | 1606.95 | 1742 | 1694 | 335.1 |
| B | 4 | 232 | 107888 | 316.92 | 1742 | 1694 | 335.1 |
| C | 15 | 214 | 660462 | 1627.52 | 1749 | 1763 | 404.7 |
| C | 0 | 10 | 332107 | 816.22 | 1749 | 1763 | 404.7 |
| C | 14 | 67 | 120103 | 292.4 | 1749 | 1763 | 404.7 |
| D | 8 | 195 | 6617232 | 14936.85 | 1646 | 1611 | 442.9 |
| D | 12 | 233 | 1122447 | 2530.64 | 1646 | 1611 | 442.9 |
| D | 13 | 249 | 763529 | 1720.27 | 1646 | 1611 | 442.9 |
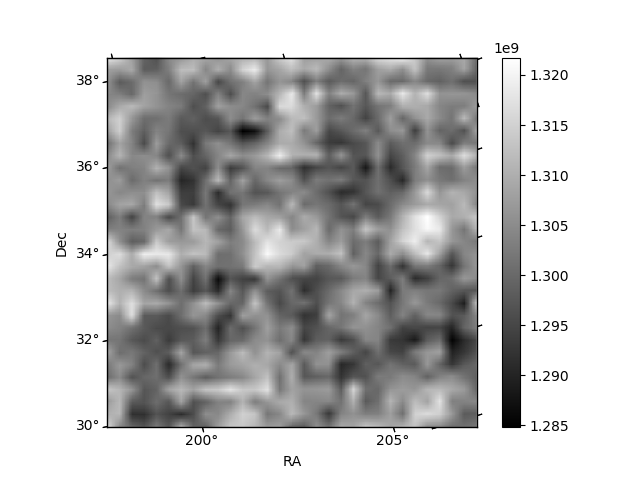
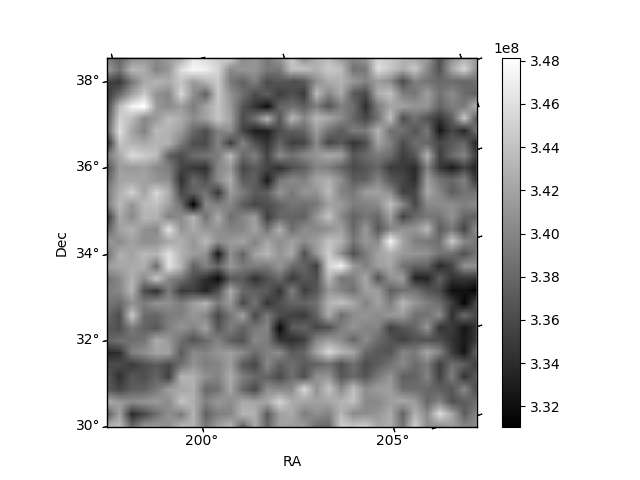
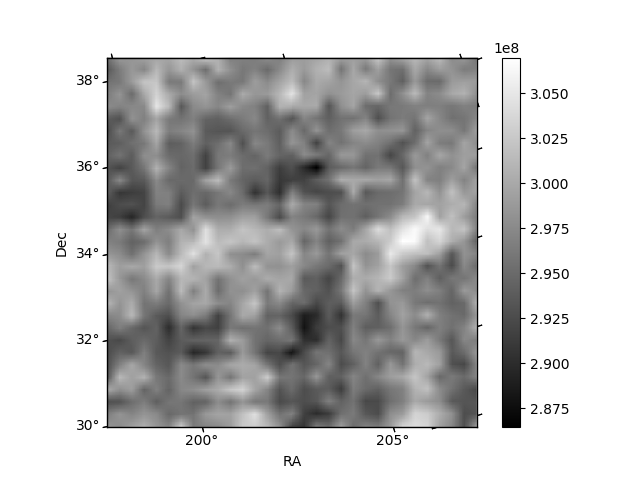
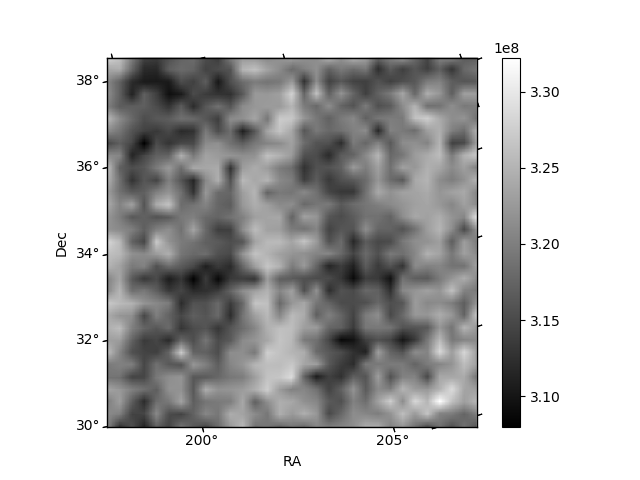
Histogram calculated using DETX and DETY for each event in the final _common_clean file
| Quadrant A | 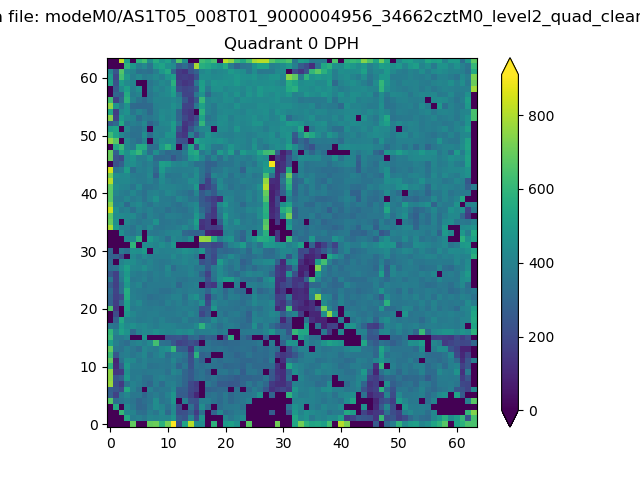 |
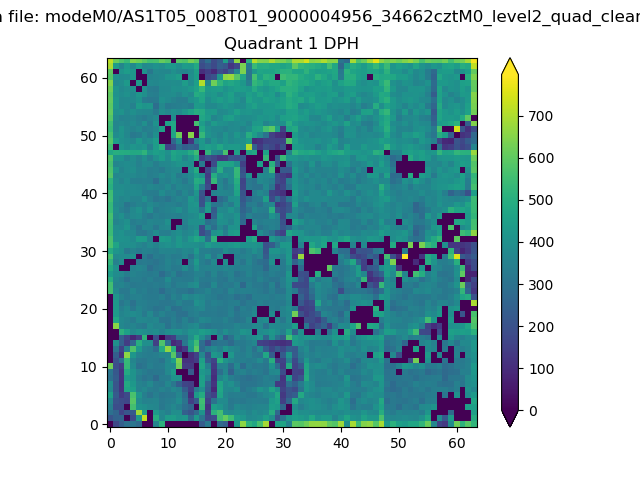 |
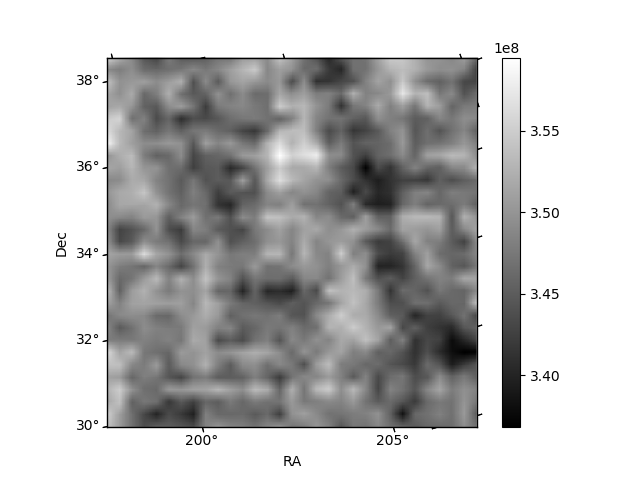
Quadrant B |
|---|---|---|---|
| Quadrant D | 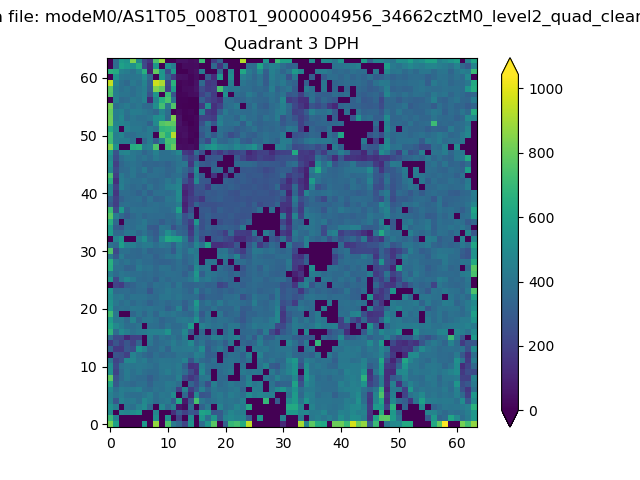 |
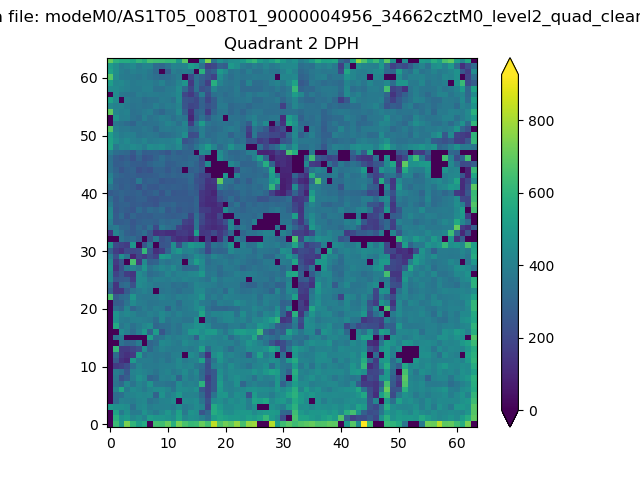 |
Quadrant C |
| Plot type | Count rate plots | Images |
|---|---|---|
| Comparison with Poisson distribution Blue bars denote a histogram of data divided into 1 sec bins. Red curve is a Poisson curve with rate = median count rate of data. |
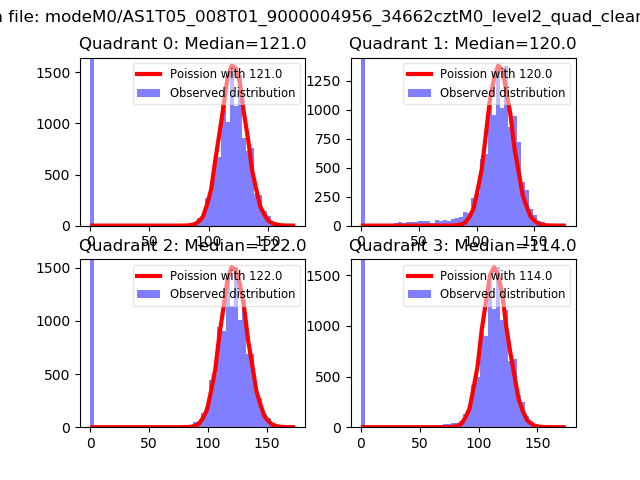 |
 |
| Quadrant-wise count rates Data is divided into 100 sec bins |
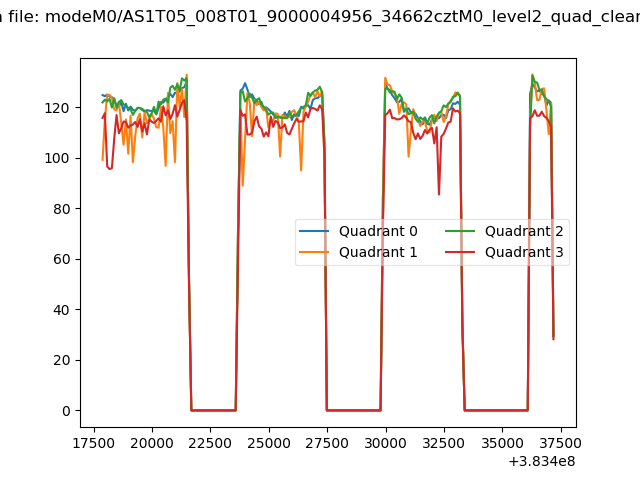 |
|
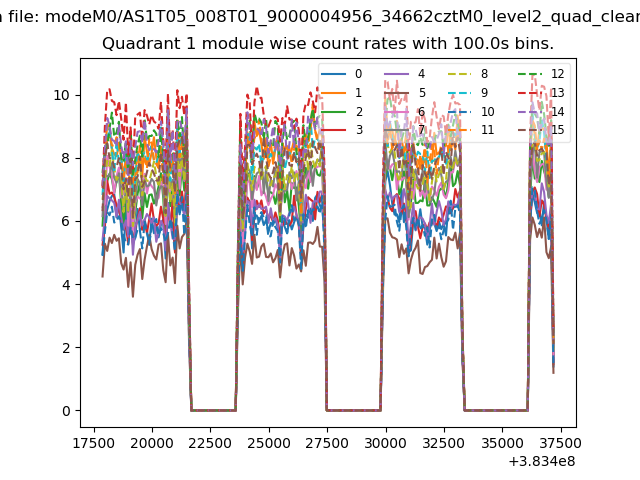
| Module-wise count rates for Quadrant A Data is divided into 100 sec bins |
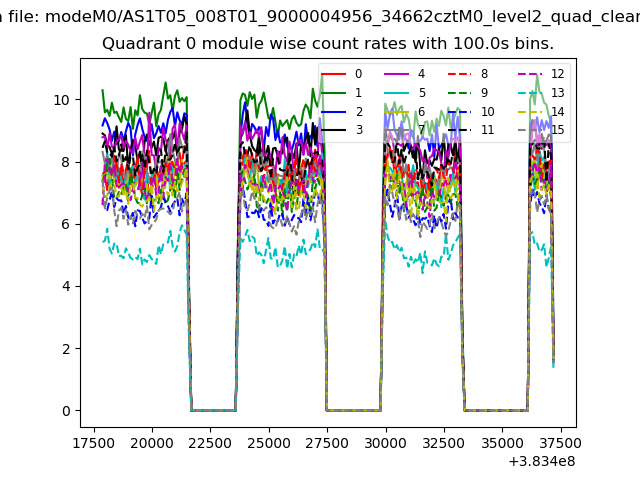 |
 |
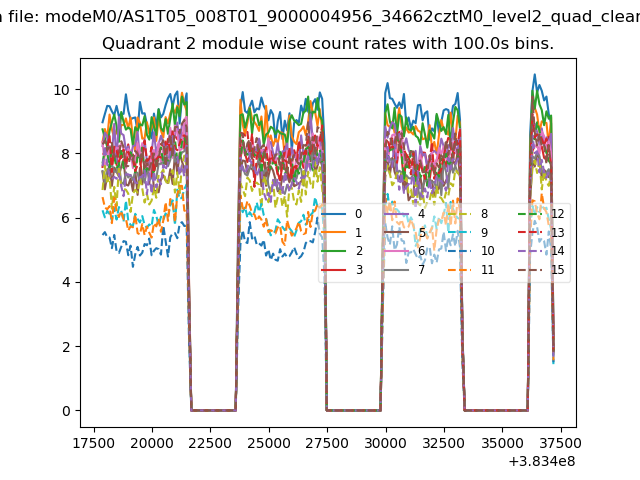
| Module-wise count rates for Quadrant B Data is divided into 100 sec bins |
 |
 |
| Module-wise count rates for Quadrant C Data is divided into 100 sec bins |
 |
 |
| Module-wise count rates for Quadrant D Data is divided into 100 sec bins |
 |
 |
| Parameter | Plot |
|---|---|
| CZT HV Monitor | 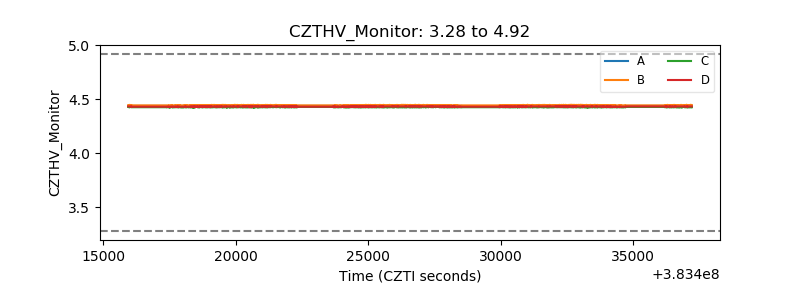 |
| D_VDD | 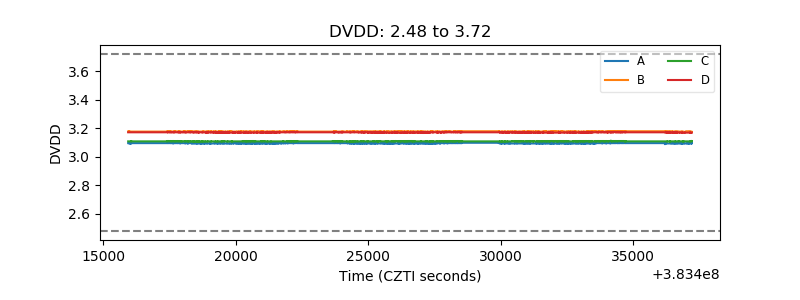 |
| Temperature 1 | 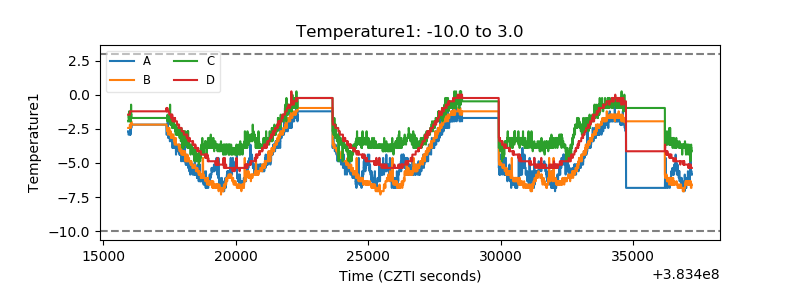 |
| Veto HV Monitor | 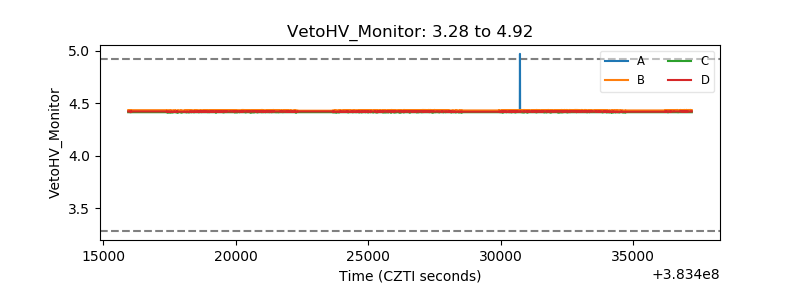 |
| Veto LLD | 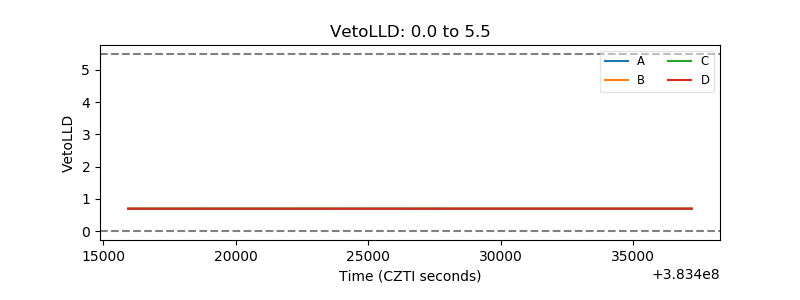 |
| Alpha Counter | 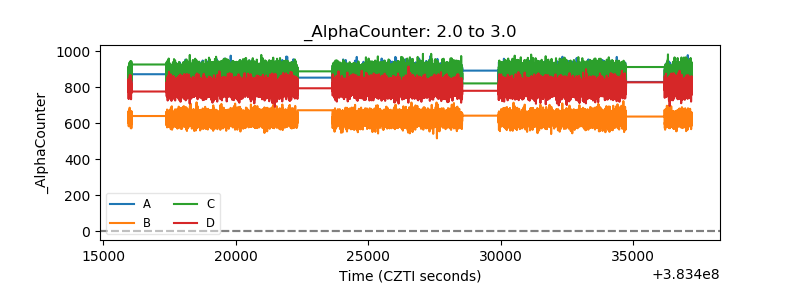 |
| _CPM_Rate | 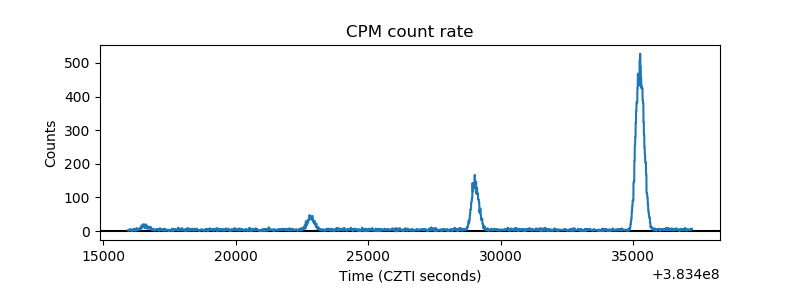 |
| CZT Counter | 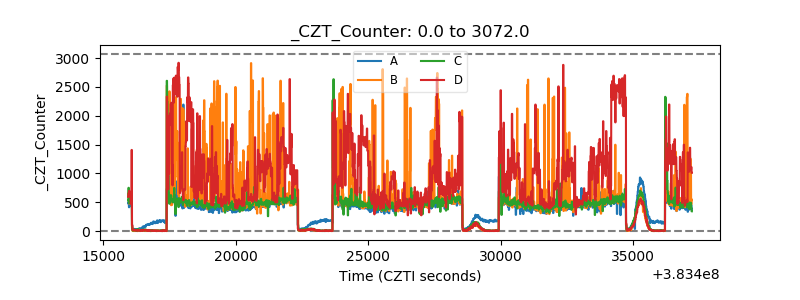 |
| +2.5 Volts monitor | 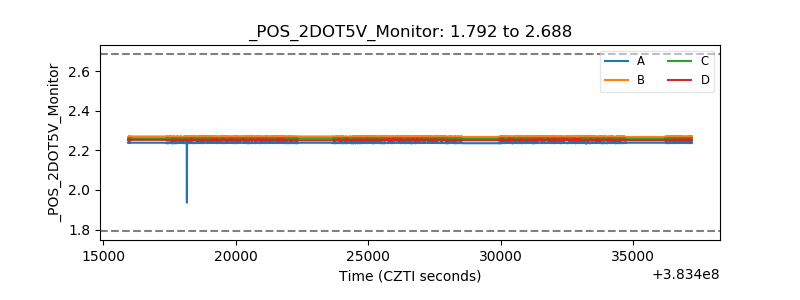 |
| +5 Volts monitor | 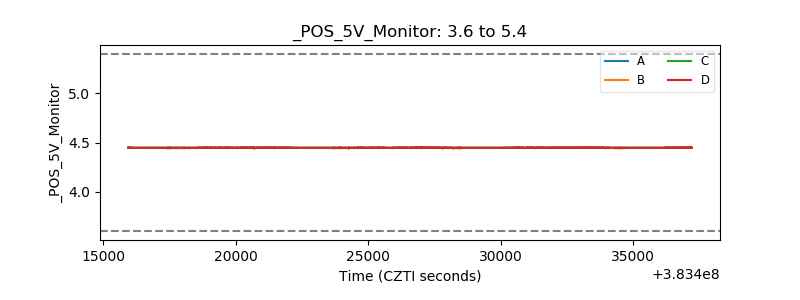 |
| _ROLL_ROT | 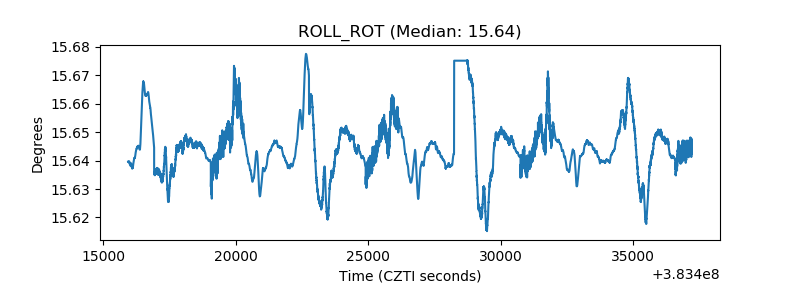 |
| _Roll_DEC | 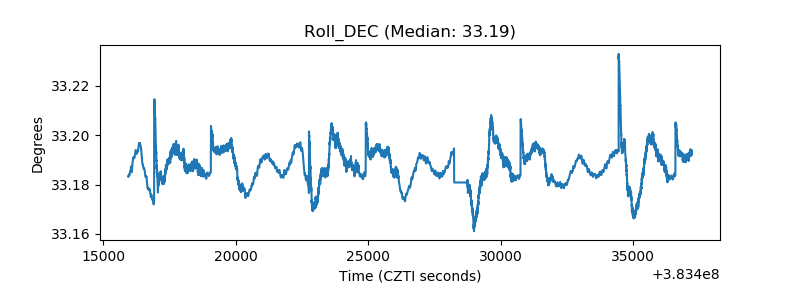 |
| _Roll_RA | 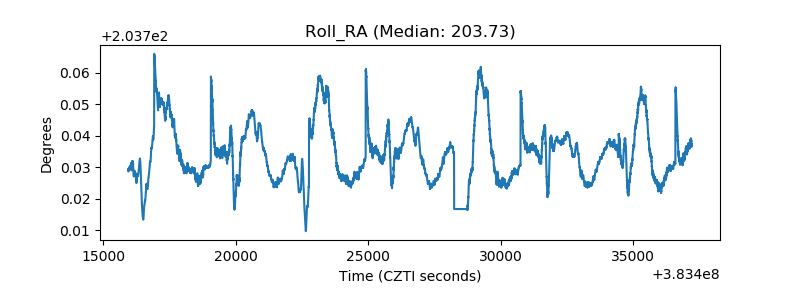 |
| Veto Counter | 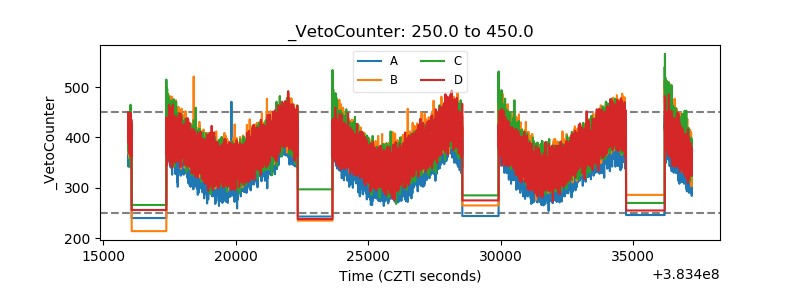 |