| Param | Original file | Final file |
|---|---|---|
| Filename | modeM0/AS1T05_008T01_9000004956_34657cztM0_level2.evt | modeM0/AS1T05_008T01_9000004956_34657cztM0_level2_quad_clean.evt |
| Size (bytes) | 863,769,600 | 101,831,040 |
| Size | 823.8 MB | 97.1 MB |
| Events in quadrant A | 4,491,529 | 627,162 |
| Events in quadrant B | 6,595,190 | 591,218 |
| Events in quadrant C | 4,958,514 | 618,342 |
| Events in quadrant D | 9,473,610 | 588,566 |
| Mode SS | |||
|---|---|---|---|
| Quadrant | BADHDUFLAG | Total packets | Discarded packets |
| A | 0 | 194 | 0 |
| B | 0 | 194 | 0 |
| C | 0 | 194 | 0 |
| D | 0 | 194 | 0 |
| Mode M9 | |||
|---|---|---|---|
| Quadrant | BADHDUFLAG | Total packets | Discarded packets |
| A | 0 | 38 | 0 |
| B | 0 | 38 | 0 |
| C | 0 | 38 | 0 |
| D | 0 | 38 | 0 |
| Mode M0 | |||
|---|---|---|---|
| Quadrant | BADHDUFLAG | Total packets | Discarded packets |
| A | 0 | 19297 | 3 |
| B | 0 | 25542 | 2 |
| C | 0 | 19966 | 2 |
| D | 0 | 34672 | 2 |
| Quadrant | Total seconds | Saturated seconds | Saturation percentage |
|---|---|---|---|
| A | 9491 | 11 | 0.115899% |
| B | 9491 | 651 | 6.859130% |
| C | 9491 | 61 | 0.642714% |
| D | 9491 | 451 | 4.751870% |
Noise dominated data is calculated using 1-second bins in cleaned event files. If a bin has >2000 counts, and if more than 50% of those come from <1% of pixels, then it is considered to be noise-dominated and hence unusable.
| Quadrant | # 1 sec bins | Bins with >0 counts | Bins with >2000 counts | High rate bins dominated by noise | Noise dominated (total time) | Noise dominated (detector-on time) | Marked lightcurve |
|---|---|---|---|---|---|---|---|
| A | 13287 | 9493 | 1 | 1 | 0.01% | 0.01% | 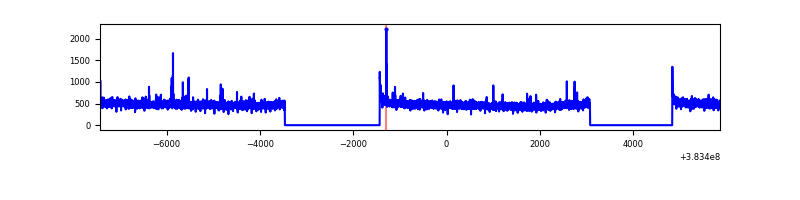 |
| B | 13287 | 9493 | 438 | 438 | 3.30% | 4.61% | 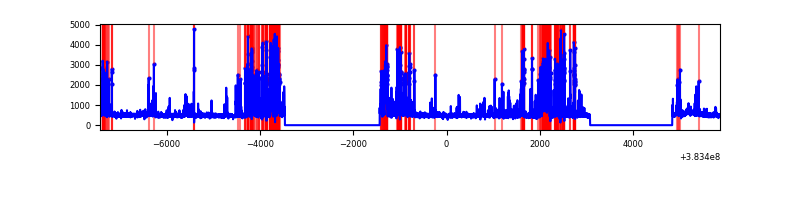 |
| C | 13287 | 9493 | 43 | 43 | 0.32% | 0.45% | 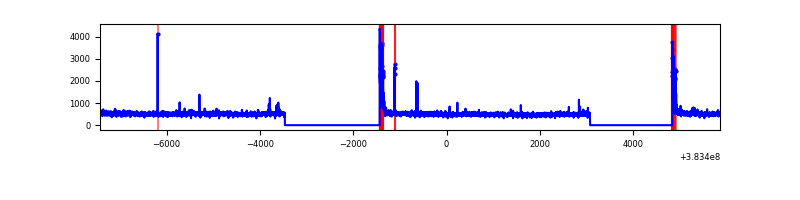 |
| D | 13287 | 9493 | 359 | 359 | 2.70% | 3.78% | 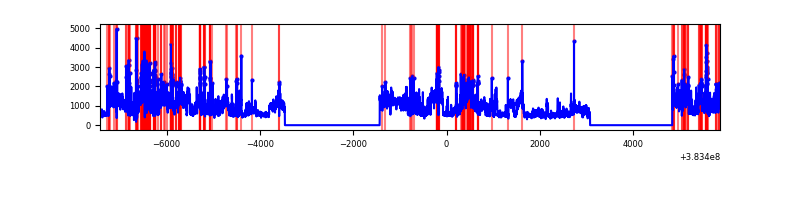 |
Top three noisy pixels from each quadrant. If the there are fewer than three noisy pixels in the level2.evt file, extra rows are filled as -1
| Pixel properties | Quadrant properties | ||||||
|---|---|---|---|---|---|---|---|
| Quadrant | DetID | PixID | Counts | Sigma | Mean | Median | Sigma |
| A | 10 | 83 | 58469 | 251.98 | 1131 | 1107 | 227.6 |
| A | 9 | 143 | 36832 | 156.93 | 1131 | 1107 | 227.6 |
| A | 13 | 6 | 23982 | 100.49 | 1131 | 1107 | 227.6 |
| B | 5 | 172 | 1773214 | 8615.69 | 1084 | 1057 | 205.7 |
| B | 5 | 255 | 341098 | 1653.18 | 1084 | 1057 | 205.7 |
| B | 4 | 81 | 58896 | 281.2 | 1084 | 1057 | 205.7 |
| C | 15 | 214 | 398935 | 1579.27 | 1091 | 1100 | 251.9 |
| C | 0 | 10 | 188106 | 742.35 | 1091 | 1100 | 251.9 |
| C | 14 | 67 | 36302 | 139.74 | 1091 | 1100 | 251.9 |
| D | 8 | 195 | 3675647 | 13715.43 | 1083 | 1052 | 267.9 |
| D | 13 | 249 | 300518 | 1117.76 | 1083 | 1052 | 267.9 |
| D | 12 | 233 | 241299 | 896.72 | 1083 | 1052 | 267.9 |
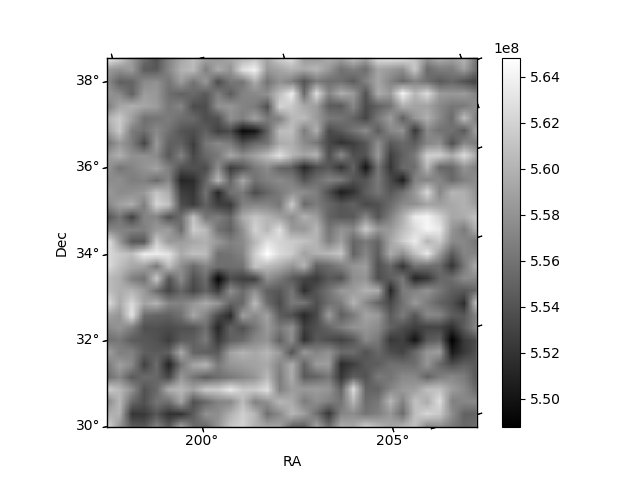
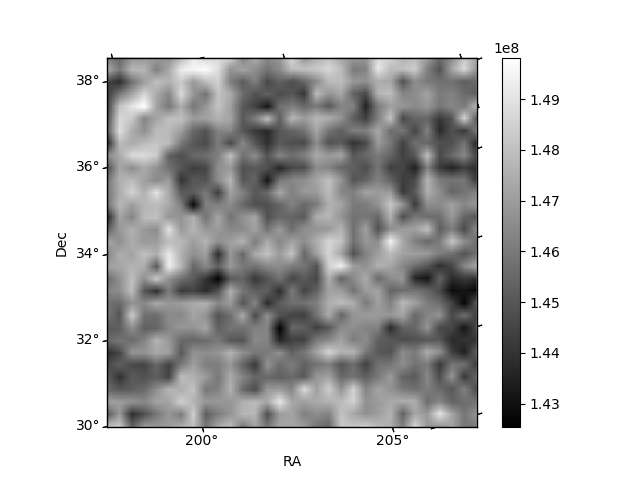
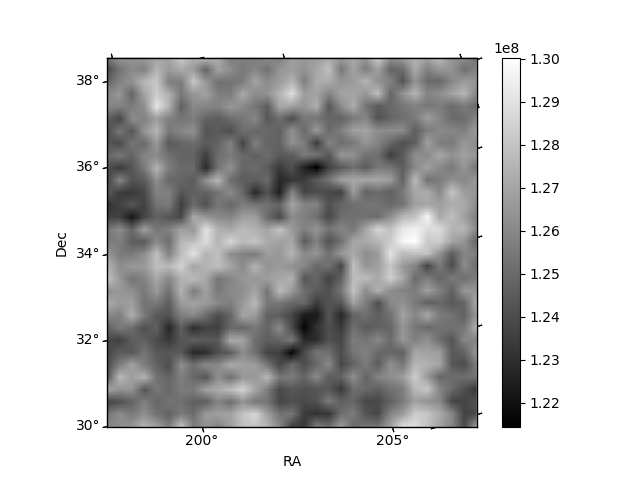
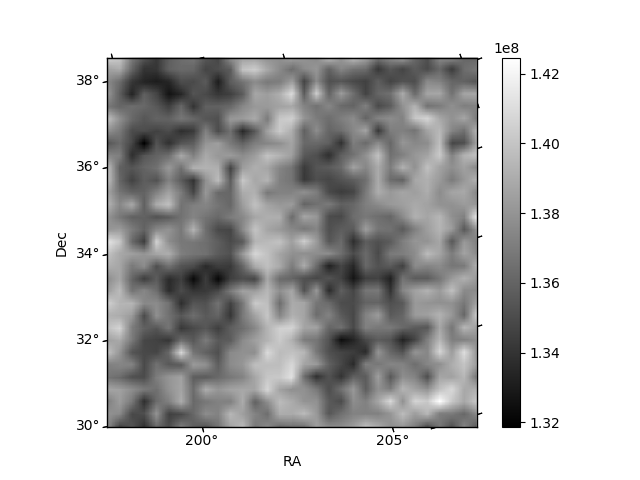
Histogram calculated using DETX and DETY for each event in the final _common_clean file
| Quadrant A | 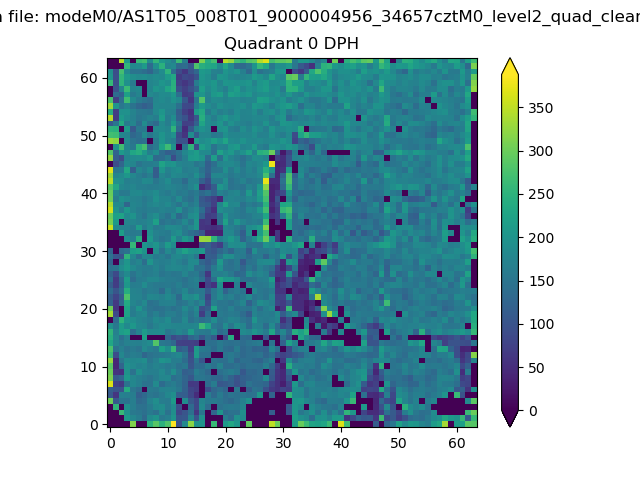 |
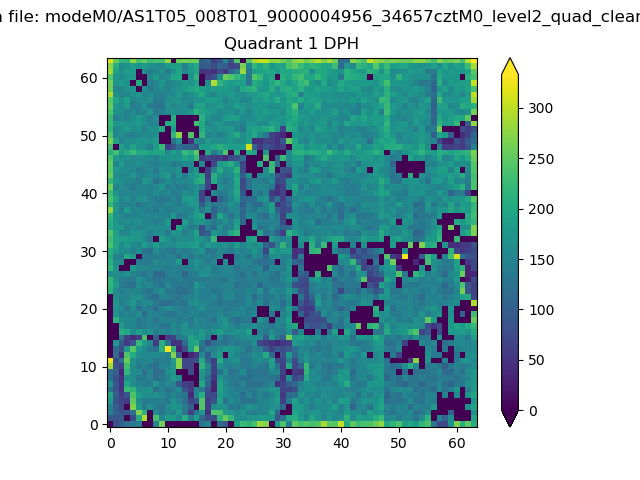 |
Quadrant B |
|---|---|---|---|
| Quadrant D | 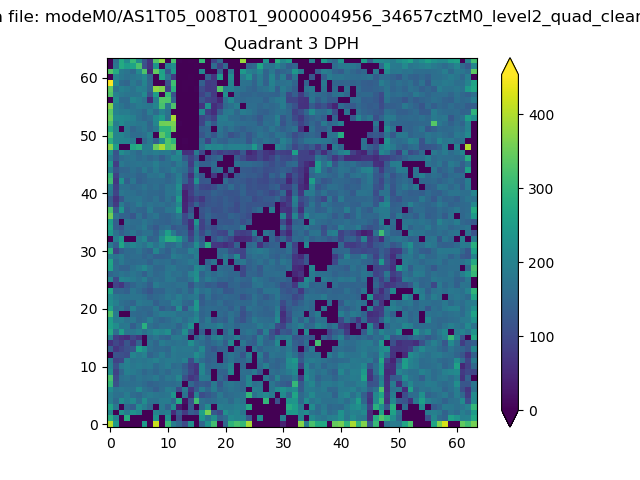 |
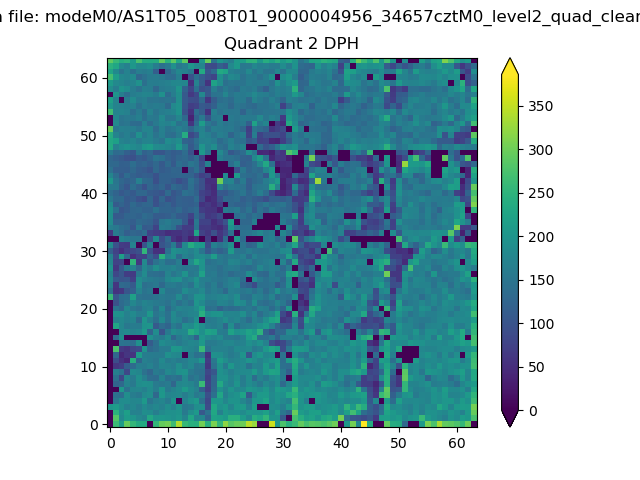 |
Quadrant C |
| Plot type | Count rate plots | Images |
|---|---|---|
| Comparison with Poisson distribution Blue bars denote a histogram of data divided into 1 sec bins. Red curve is a Poisson curve with rate = median count rate of data. |
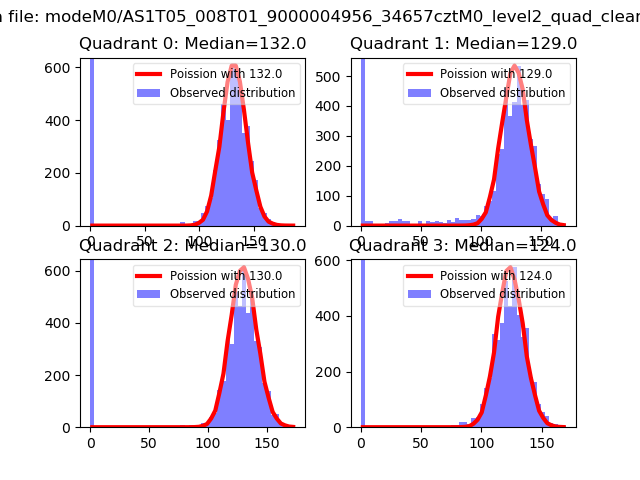 |
 |
| Quadrant-wise count rates Data is divided into 100 sec bins |
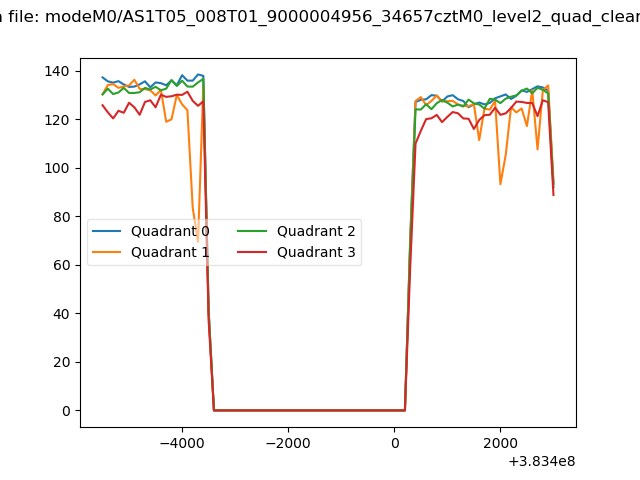 |
|
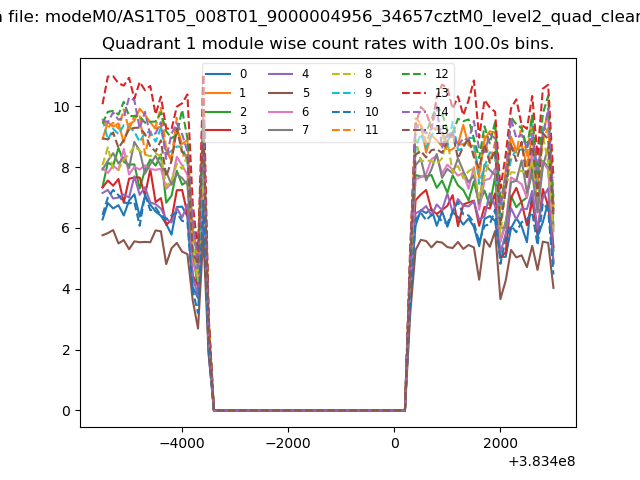
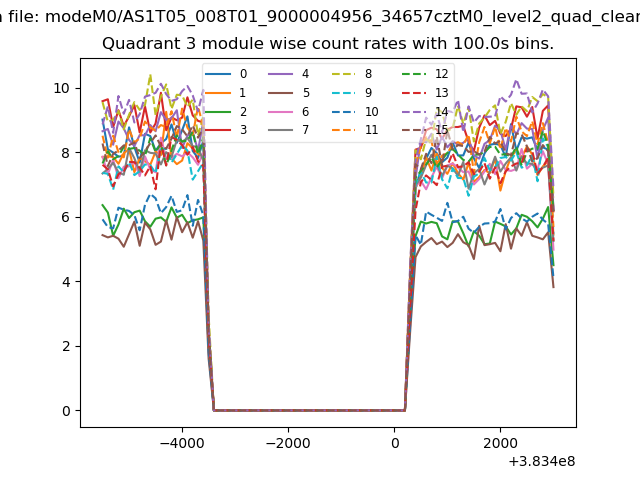
| Module-wise count rates for Quadrant A Data is divided into 100 sec bins |
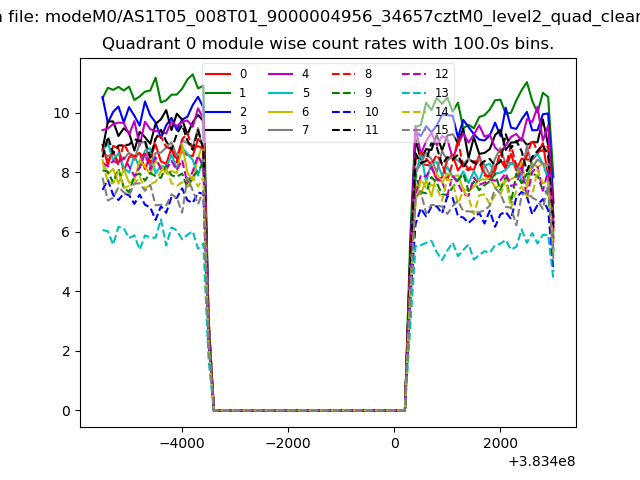 |
 |
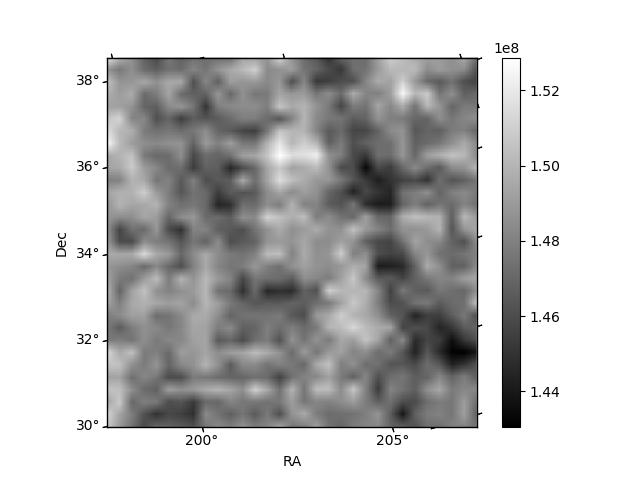
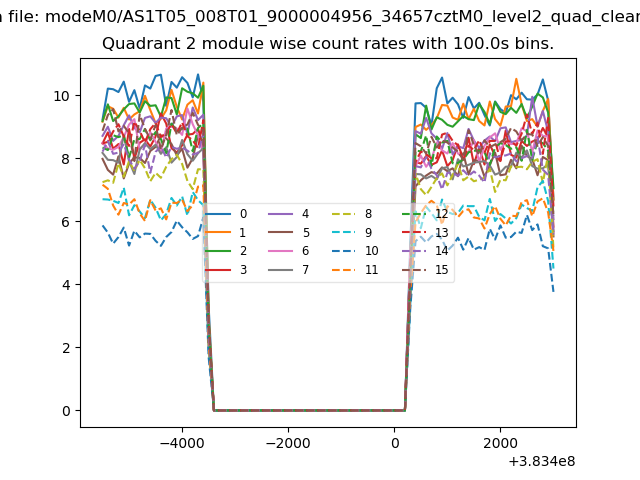
| Module-wise count rates for Quadrant B Data is divided into 100 sec bins |
 |
 |
| Module-wise count rates for Quadrant C Data is divided into 100 sec bins |
 |
 |
| Module-wise count rates for Quadrant D Data is divided into 100 sec bins |
 |
 |
| Parameter | Plot |
|---|---|
| CZT HV Monitor | 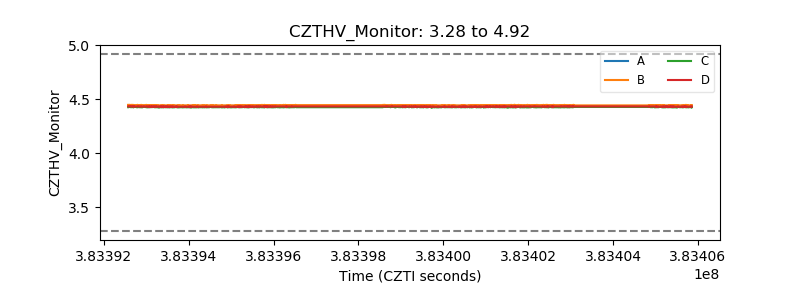 |
| D_VDD | 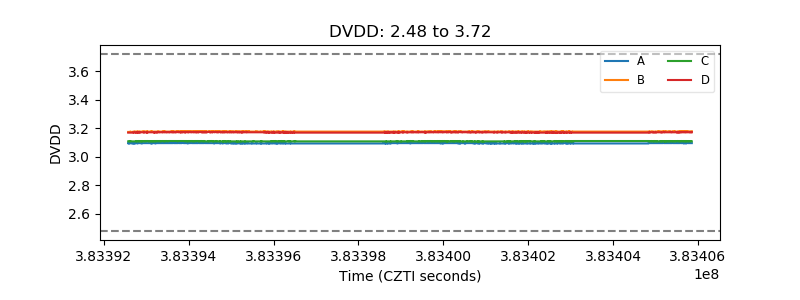 |
| Temperature 1 | 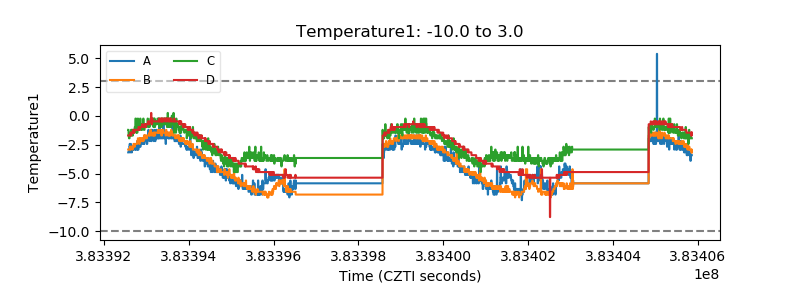 |
| Veto HV Monitor | 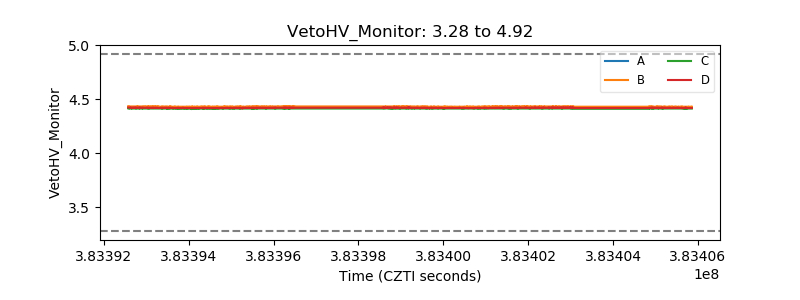 |
| Veto LLD | 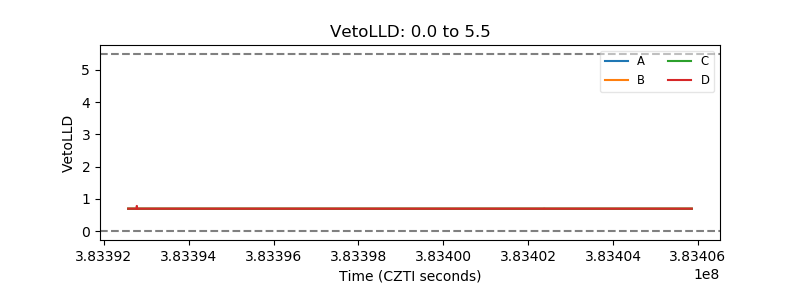 |
| Alpha Counter | 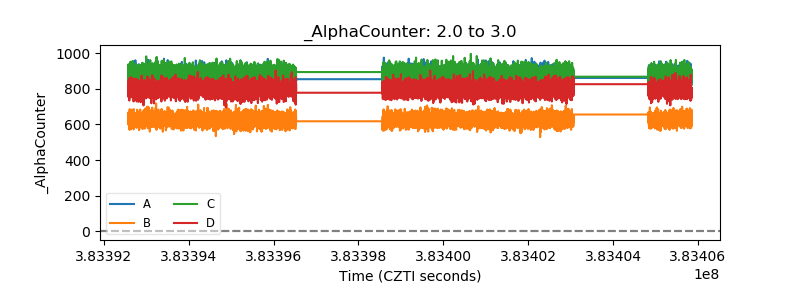 |
| _CPM_Rate | 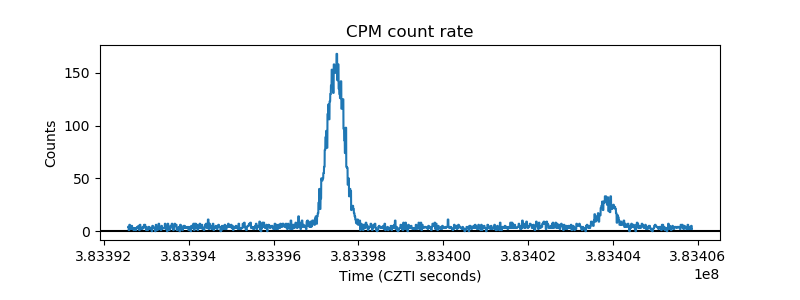 |
| CZT Counter | 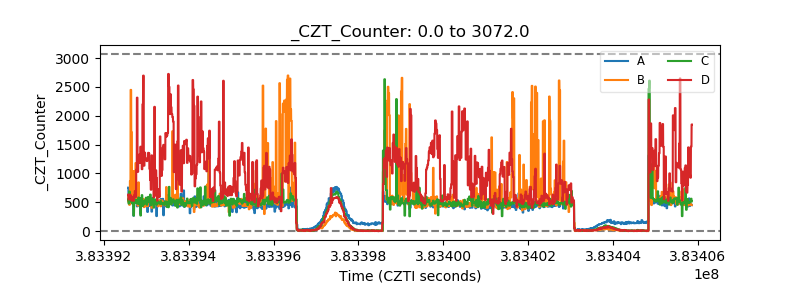 |
| +2.5 Volts monitor | 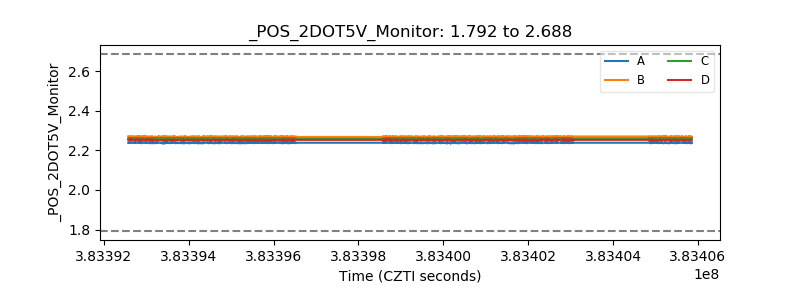 |
| +5 Volts monitor | 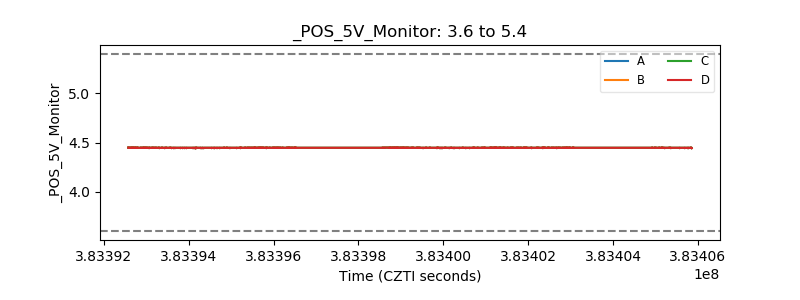 |
| _ROLL_ROT | 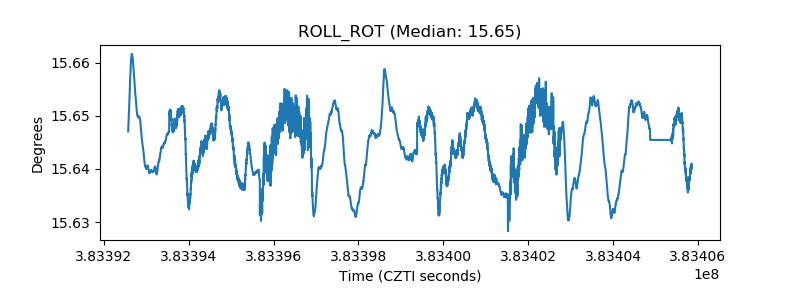 |
| _Roll_DEC | 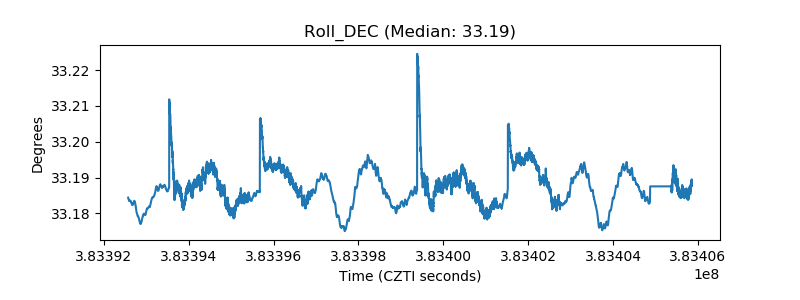 |
| _Roll_RA | 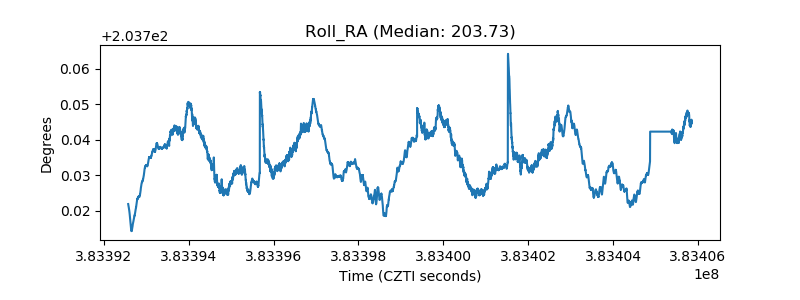 |
| Veto Counter | 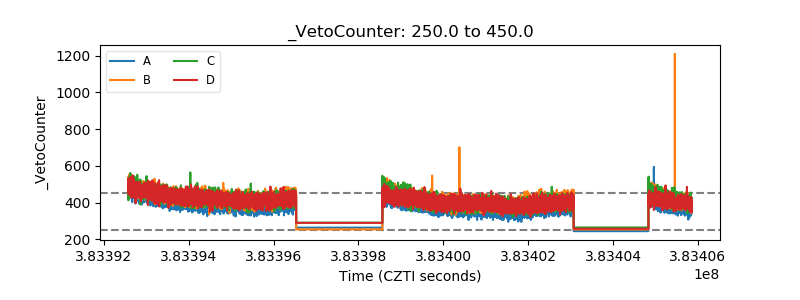 |