| Param | Original file | Final file |
|---|---|---|
| Filename | modeM0/AS1T05_008T01_9000004956_34656cztM0_level2.evt | modeM0/AS1T05_008T01_9000004956_34656cztM0_level2_quad_clean.evt |
| Size (bytes) | 491,757,120 | 48,490,560 |
| Size | 469.0 MB | 46.2 MB |
| Events in quadrant A | 2,498,304 | 290,368 |
| Events in quadrant B | 3,725,609 | 270,012 |
| Events in quadrant C | 2,888,242 | 280,225 |
| Events in quadrant D | 5,435,792 | 270,264 |
| Mode SS | |||
|---|---|---|---|
| Quadrant | BADHDUFLAG | Total packets | Discarded packets |
| A | 0 | 104 | 0 |
| B | 0 | 104 | 0 |
| C | 0 | 104 | 0 |
| D | 0 | 104 | 0 |
| Mode M9 | |||
|---|---|---|---|
| Quadrant | BADHDUFLAG | Total packets | Discarded packets |
| A | 0 | 26 | 0 |
| B | 0 | 26 | 0 |
| C | 0 | 26 | 0 |
| D | 0 | 27 | 0 |
| Mode M0 | |||
|---|---|---|---|
| Quadrant | BADHDUFLAG | Total packets | Discarded packets |
| A | 0 | 10488 | 3 |
| B | 0 | 14214 | 2 |
| C | 0 | 11319 | 2 |
| D | 0 | 19731 | 2 |
| Quadrant | Total seconds | Saturated seconds | Saturation percentage |
|---|---|---|---|
| A | 5091 | 7 | 0.137498% |
| B | 5091 | 420 | 8.249853% |
| C | 5091 | 96 | 1.885681% |
| D | 5091 | 298 | 5.853467% |
Noise dominated data is calculated using 1-second bins in cleaned event files. If a bin has >2000 counts, and if more than 50% of those come from <1% of pixels, then it is considered to be noise-dominated and hence unusable.
| Quadrant | # 1 sec bins | Bins with >0 counts | Bins with >2000 counts | High rate bins dominated by noise | Noise dominated (total time) | Noise dominated (detector-on time) | Marked lightcurve |
|---|---|---|---|---|---|---|---|
| A | 7124 | 5092 | 1 | 1 | 0.01% | 0.02% | 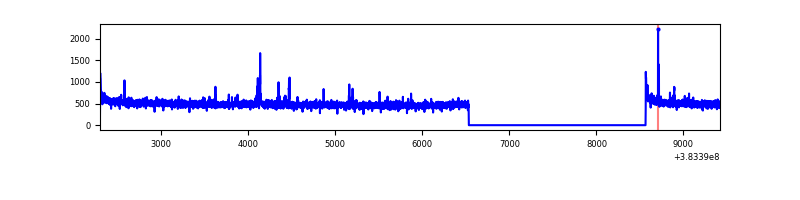 |
| B | 7124 | 5092 | 281 | 281 | 3.94% | 5.52% | 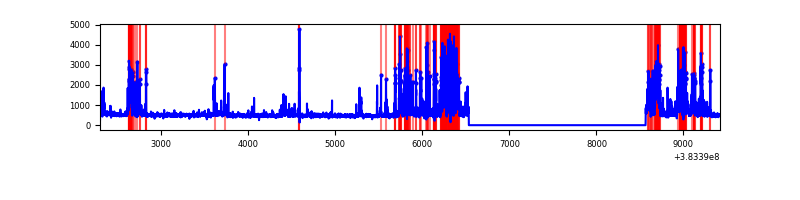 |
| C | 7124 | 5092 | 73 | 73 | 1.02% | 1.43% | 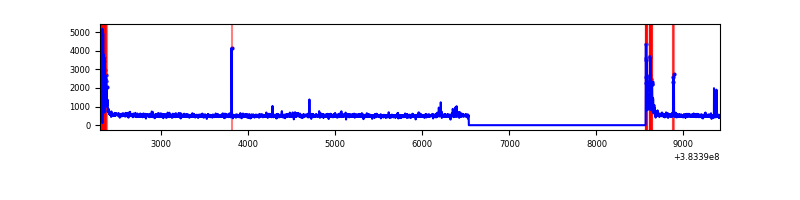 |
| D | 7124 | 5092 | 239 | 239 | 3.35% | 4.69% | 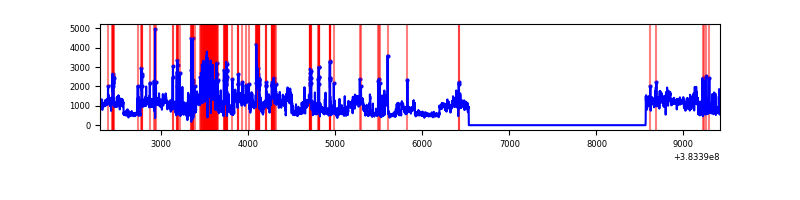 |
Top three noisy pixels from each quadrant. If the there are fewer than three noisy pixels in the level2.evt file, extra rows are filled as -1
| Pixel properties | Quadrant properties | ||||||
|---|---|---|---|---|---|---|---|
| Quadrant | DetID | PixID | Counts | Sigma | Mean | Median | Sigma |
| A | 10 | 83 | 46428 | 366.39 | 622 | 610 | 125.1 |
| A | 9 | 143 | 33066 | 259.54 | 622 | 610 | 125.1 |
| A | 13 | 6 | 11341 | 85.81 | 622 | 610 | 125.1 |
| B | 5 | 172 | 1037447 | 9158.79 | 589 | 577 | 113.2 |
| B | 5 | 255 | 262442 | 2313.08 | 589 | 577 | 113.2 |
| B | 4 | 81 | 35673 | 310.01 | 589 | 577 | 113.2 |
| C | 0 | 10 | 277923 | 2033.39 | 591 | 596 | 136.4 |
| C | 15 | 214 | 218094 | 1594.72 | 591 | 596 | 136.4 |
| C | 14 | 67 | 30085 | 216.21 | 591 | 596 | 136.4 |
| D | 8 | 195 | 2082713 | 14129.39 | 592 | 575 | 147.4 |
| D | 12 | 233 | 234022 | 1584.17 | 592 | 575 | 147.4 |
| D | 13 | 249 | 195945 | 1325.78 | 592 | 575 | 147.4 |
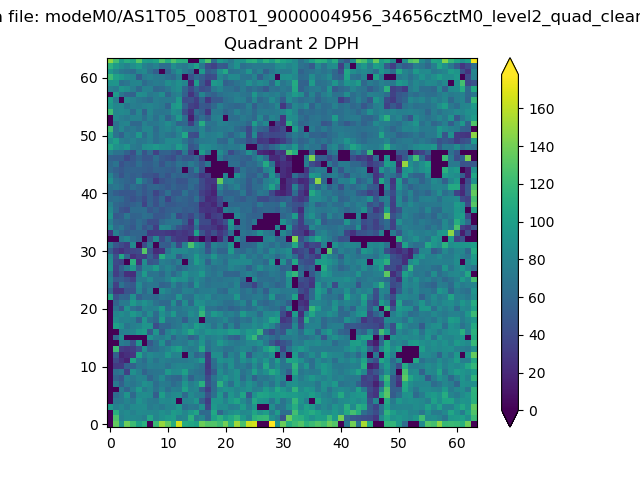
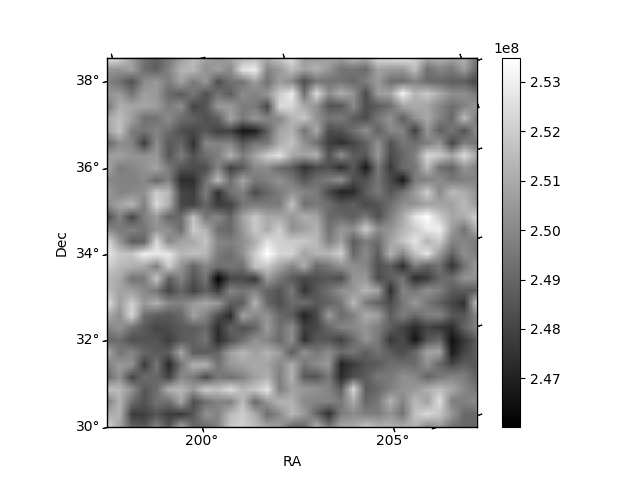
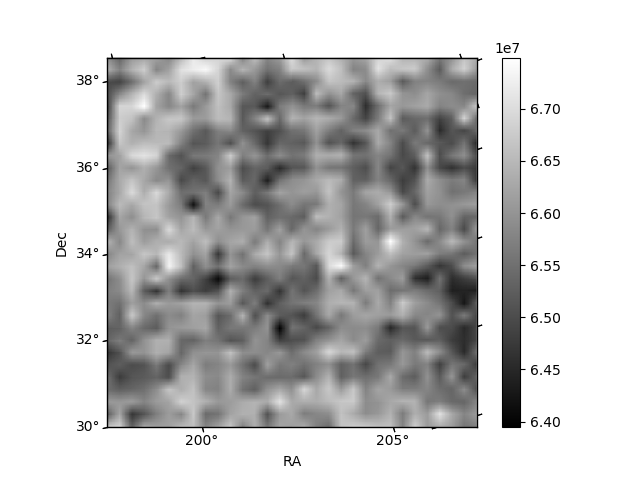
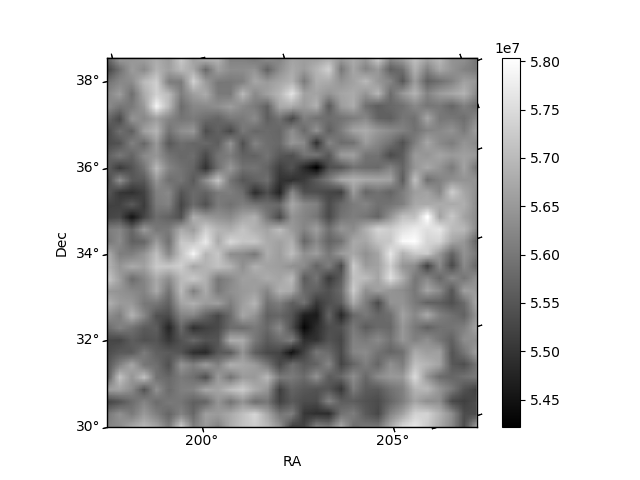
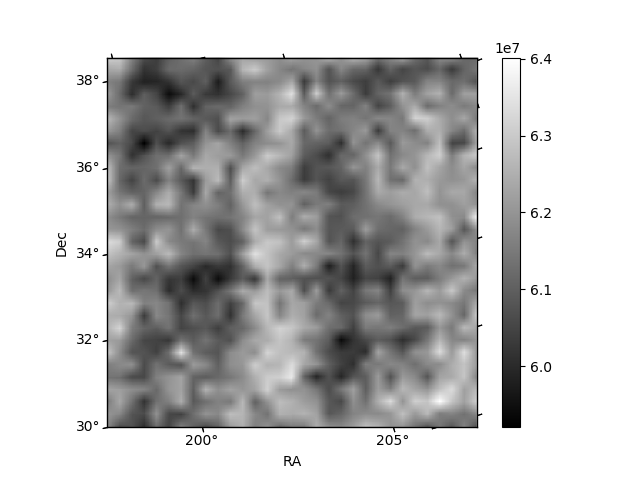
Histogram calculated using DETX and DETY for each event in the final _common_clean file
| Quadrant A | 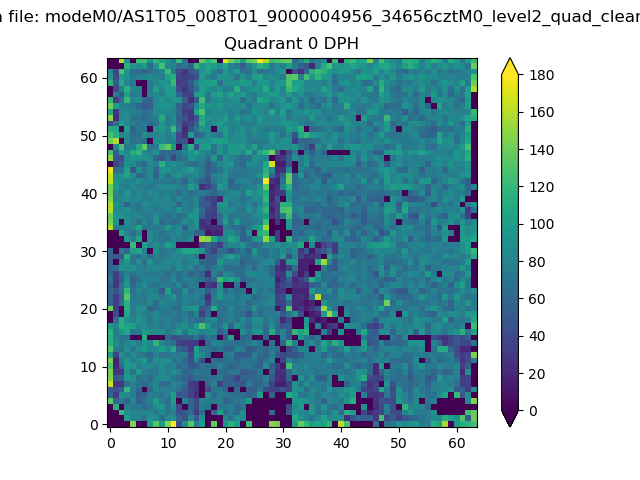 |
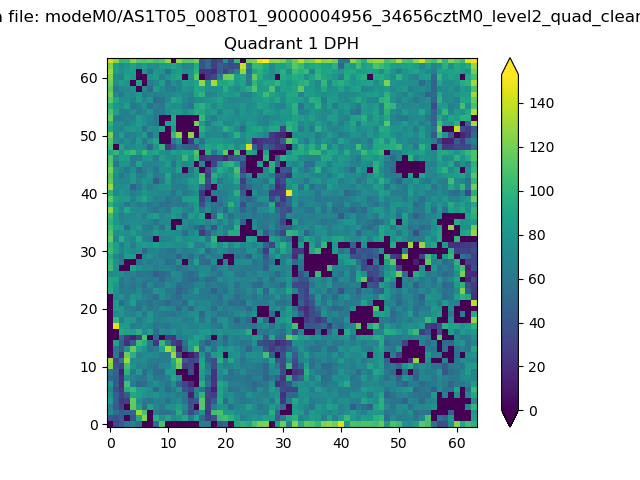 |
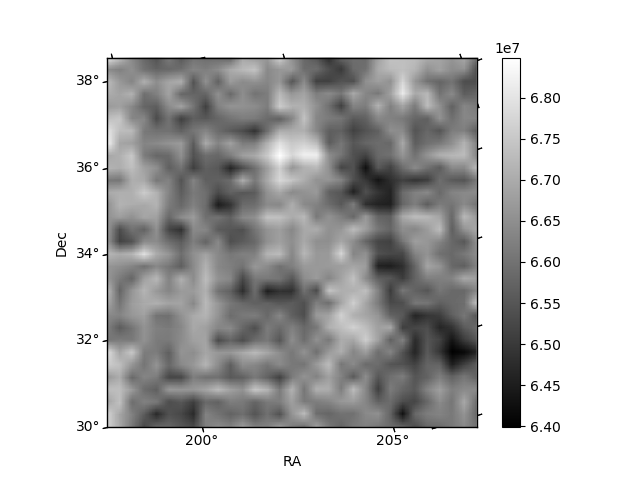
Quadrant B |
|---|---|---|---|
| Quadrant D | 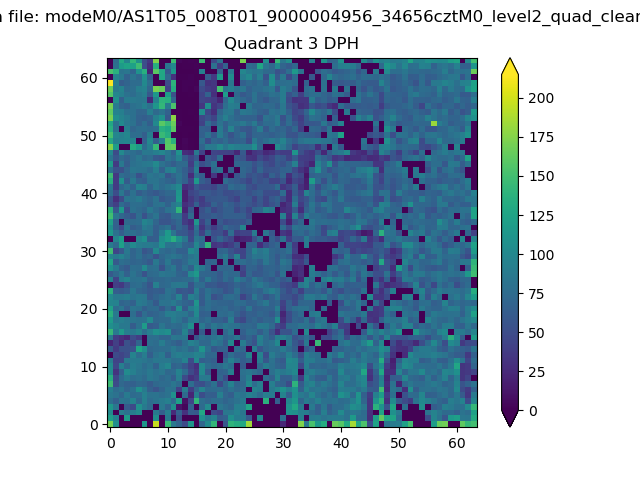 |
 |
Quadrant C |
| Plot type | Count rate plots | Images |
|---|---|---|
| Comparison with Poisson distribution Blue bars denote a histogram of data divided into 1 sec bins. Red curve is a Poisson curve with rate = median count rate of data. |
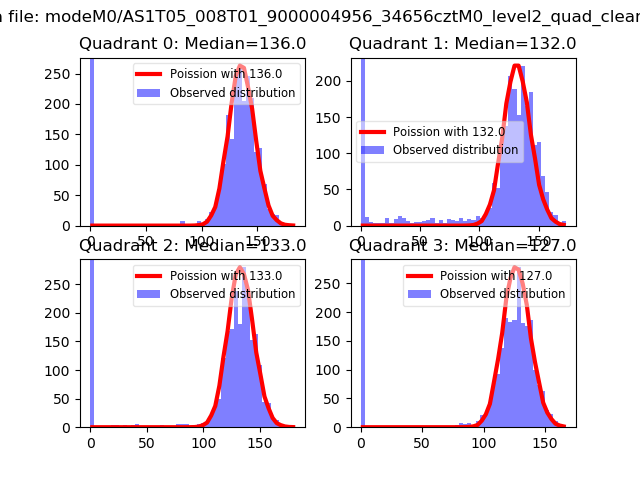 |
 |
| Quadrant-wise count rates Data is divided into 100 sec bins |
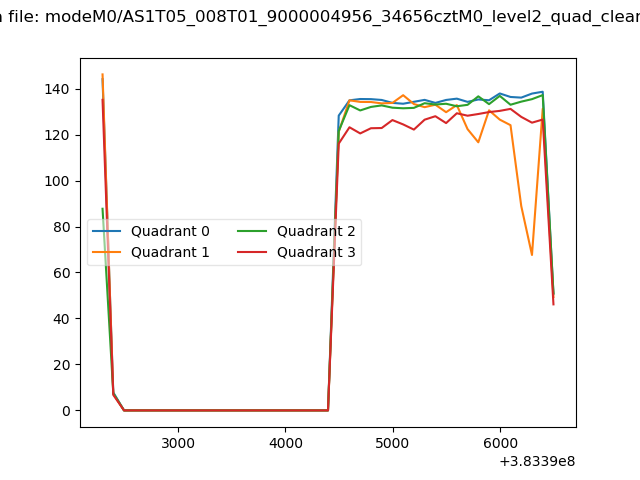 |
|
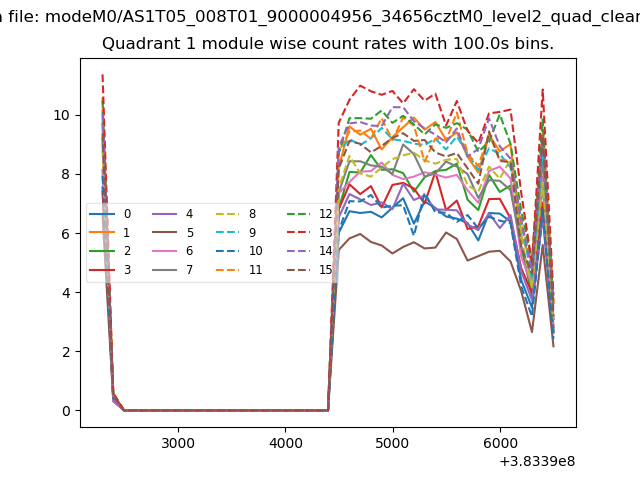
| Module-wise count rates for Quadrant A Data is divided into 100 sec bins |
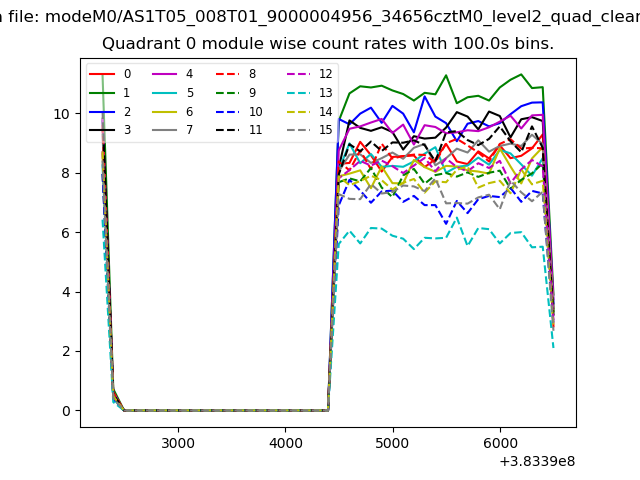 |
 |
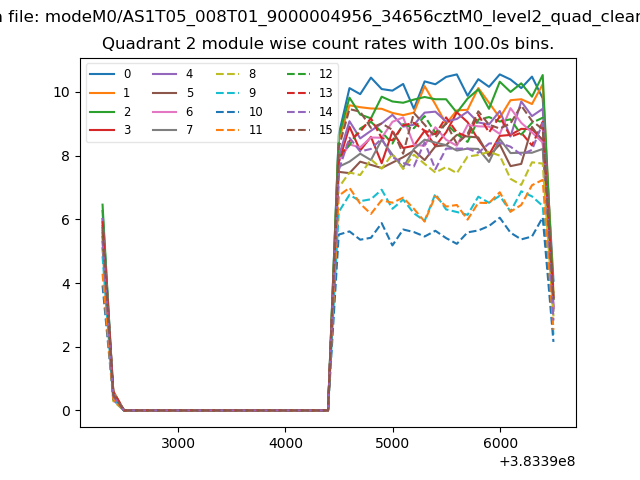
| Module-wise count rates for Quadrant B Data is divided into 100 sec bins |
 |
 |
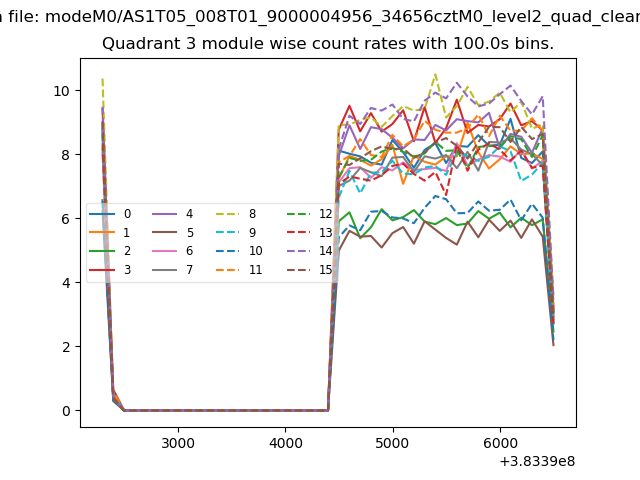
| Module-wise count rates for Quadrant C Data is divided into 100 sec bins |
 |
 |
| Module-wise count rates for Quadrant D Data is divided into 100 sec bins |
 |
 |
| Parameter | Plot |
|---|---|
| CZT HV Monitor |  |
| D_VDD | 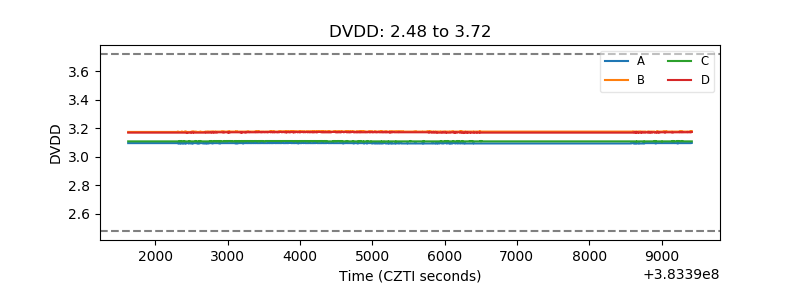 |
| Temperature 1 | 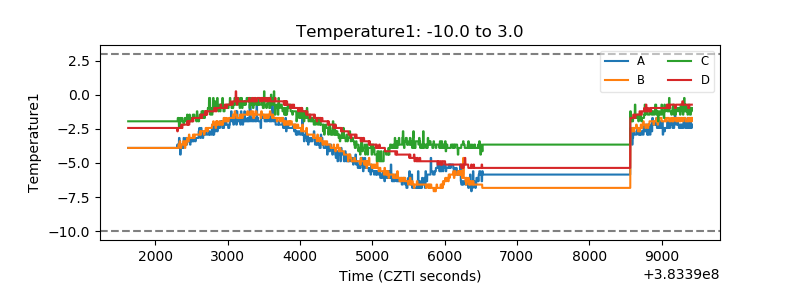 |
| Veto HV Monitor | 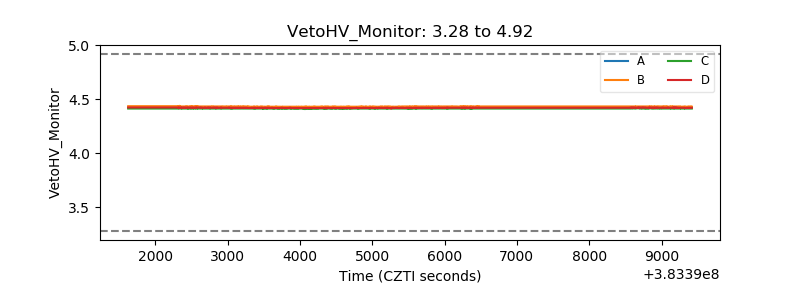 |
| Veto LLD | 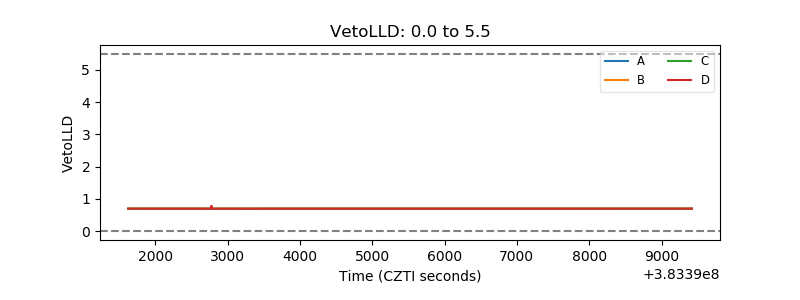 |
| Alpha Counter | 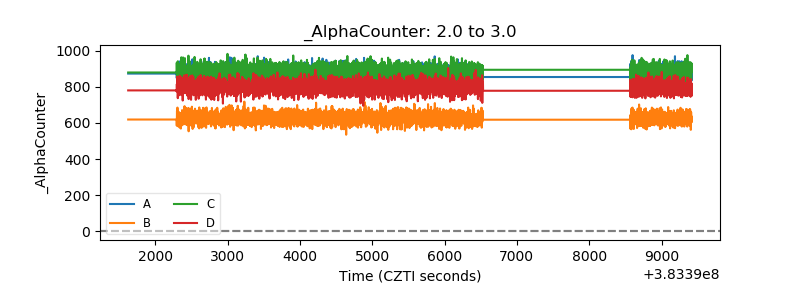 |
| _CPM_Rate | 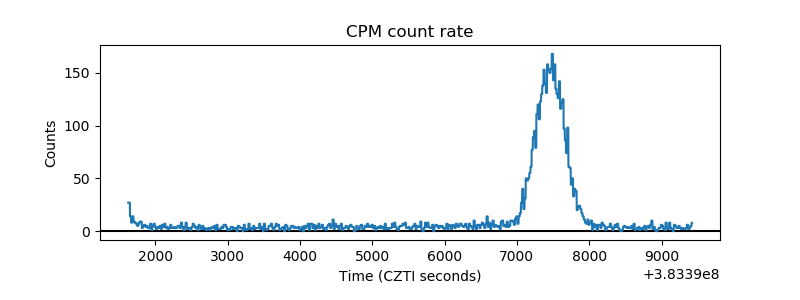 |
| CZT Counter | 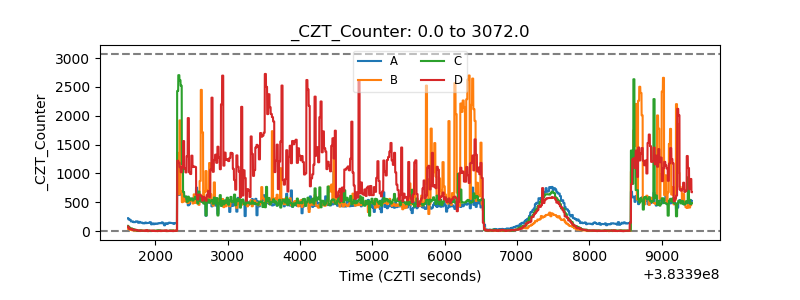 |
| +2.5 Volts monitor | 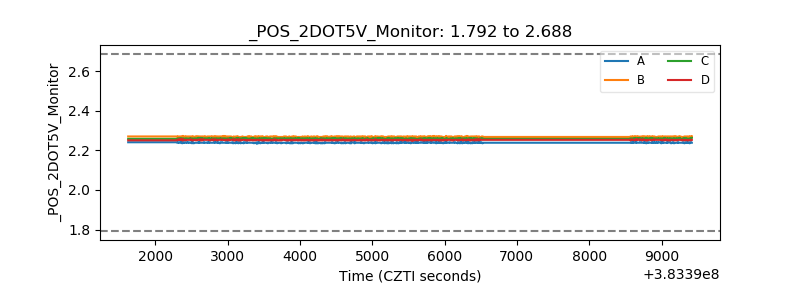 |
| +5 Volts monitor | 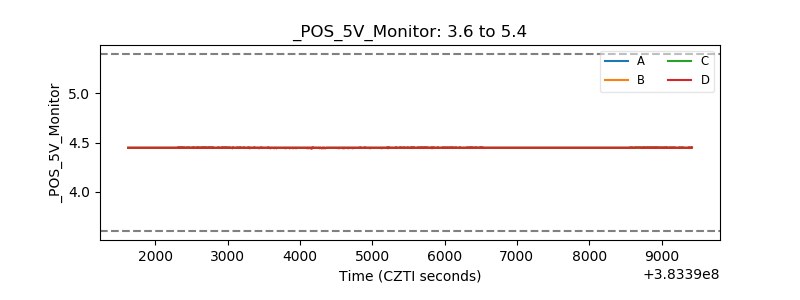 |
| _ROLL_ROT | 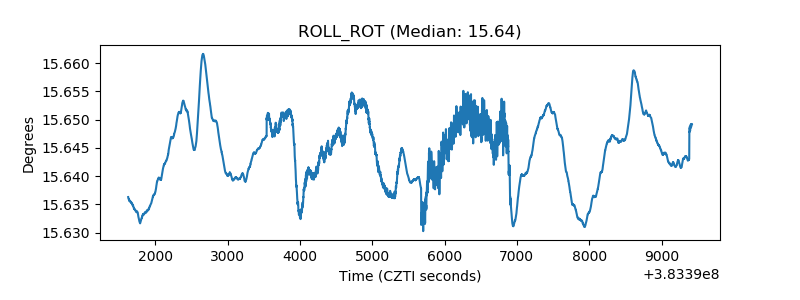 |
| _Roll_DEC | 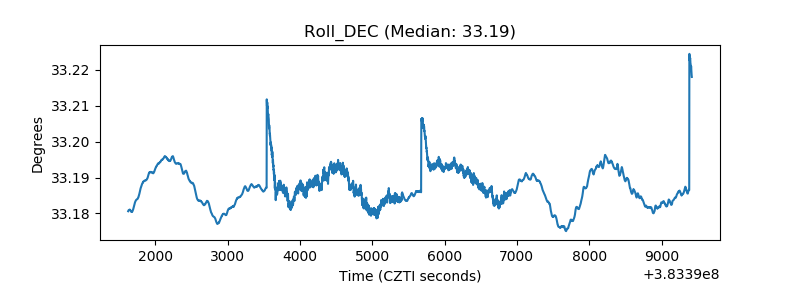 |
| _Roll_RA |  |
| Veto Counter | 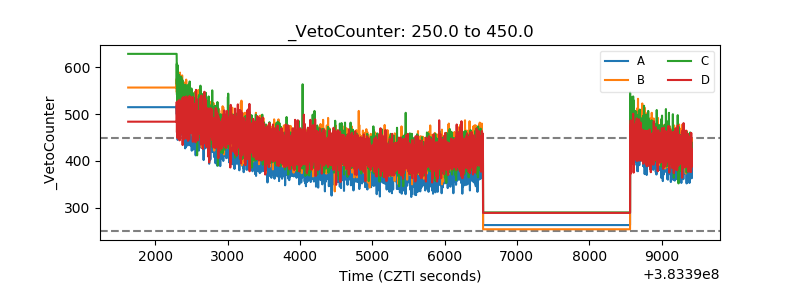 |