| Param | Original file | Final file |
|---|---|---|
| Filename | modeM0/AS1T05_008T01_9000004956_34654cztM0_level2.evt | modeM0/AS1T05_008T01_9000004956_34654cztM0_level2_quad_clean.evt |
| Size (bytes) | 421,283,520 | 62,789,760 |
| Size | 401.8 MB | 59.9 MB |
| Events in quadrant A | 2,623,320 | 399,415 |
| Events in quadrant B | 2,830,918 | 399,736 |
| Events in quadrant C | 2,895,200 | 384,736 |
| Events in quadrant D | 4,071,993 | 368,760 |
| Mode SS | |||
|---|---|---|---|
| Quadrant | BADHDUFLAG | Total packets | Discarded packets |
| A | 0 | 100 | 0 |
| B | 0 | 100 | 0 |
| C | 0 | 100 | 0 |
| D | 0 | 100 | 0 |
| Mode M9 | |||
|---|---|---|---|
| Quadrant | BADHDUFLAG | Total packets | Discarded packets |
| A | 0 | 22 | 0 |
| B | 0 | 22 | 0 |
| C | 0 | 22 | 0 |
| D | 0 | 23 | 0 |
| Mode M0 | |||
|---|---|---|---|
| Quadrant | BADHDUFLAG | Total packets | Discarded packets |
| A | 0 | 10495 | 3 |
| B | 0 | 11217 | 2 |
| C | 0 | 11275 | 2 |
| D | 0 | 15718 | 2 |
| Quadrant | Total seconds | Saturated seconds | Saturation percentage |
|---|---|---|---|
| A | 4972 | 25 | 0.502816% |
| B | 4972 | 29 | 0.583266% |
| C | 4972 | 68 | 1.367659% |
| D | 4972 | 87 | 1.749799% |
Noise dominated data is calculated using 1-second bins in cleaned event files. If a bin has >2000 counts, and if more than 50% of those come from <1% of pixels, then it is considered to be noise-dominated and hence unusable.
| Quadrant | # 1 sec bins | Bins with >0 counts | Bins with >2000 counts | High rate bins dominated by noise | Noise dominated (total time) | Noise dominated (detector-on time) | Marked lightcurve |
|---|---|---|---|---|---|---|---|
| A | 7065 | 4973 | 14 | 14 | 0.20% | 0.28% | 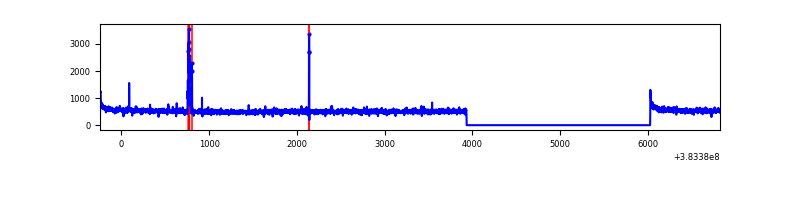 |
| B | 7065 | 4973 | 19 | 19 | 0.27% | 0.38% |  |
| C | 7065 | 4973 | 56 | 56 | 0.79% | 1.13% | 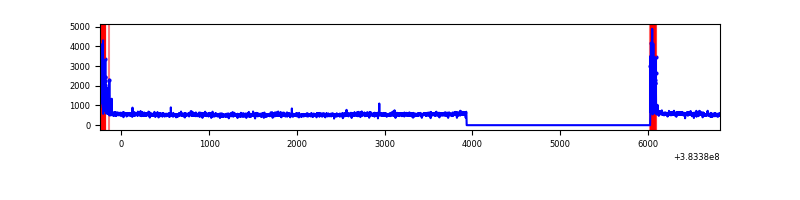 |
| D | 7065 | 4973 | 56 | 56 | 0.79% | 1.13% | 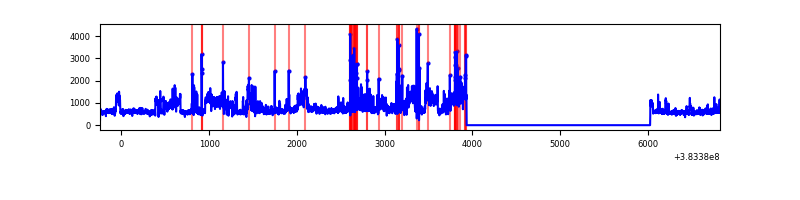 |
Top three noisy pixels from each quadrant. If the there are fewer than three noisy pixels in the level2.evt file, extra rows are filled as -1
| Pixel properties | Quadrant properties | ||||||
|---|---|---|---|---|---|---|---|
| Quadrant | DetID | PixID | Counts | Sigma | Mean | Median | Sigma |
| A | 15 | 174 | 46788 | 360.4 | 648 | 637 | 128.1 |
| A | 10 | 83 | 45391 | 349.49 | 648 | 637 | 128.1 |
| A | 9 | 143 | 16352 | 122.72 | 648 | 637 | 128.1 |
| B | 5 | 172 | 216323 | 1799.97 | 634 | 620 | 119.8 |
| B | 4 | 171 | 47961 | 395.05 | 634 | 620 | 119.8 |
| B | 4 | 232 | 29725 | 242.87 | 634 | 620 | 119.8 |
| C | 0 | 10 | 220850 | 1581.06 | 608 | 612 | 139.3 |
| C | 15 | 214 | 215196 | 1540.47 | 608 | 612 | 139.3 |
| C | 14 | 67 | 77047 | 548.72 | 608 | 612 | 139.3 |
| D | 8 | 195 | 1178156 | 7779.67 | 620 | 602 | 151.4 |
| D | 2 | 250 | 135711 | 892.62 | 620 | 602 | 151.4 |
| D | 12 | 235 | 90691 | 595.18 | 620 | 602 | 151.4 |
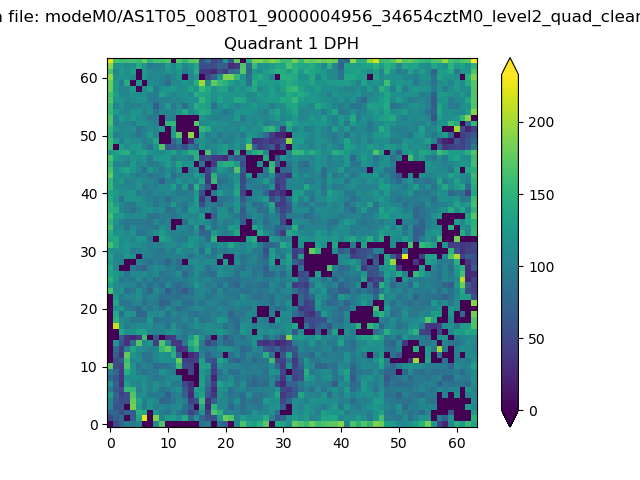
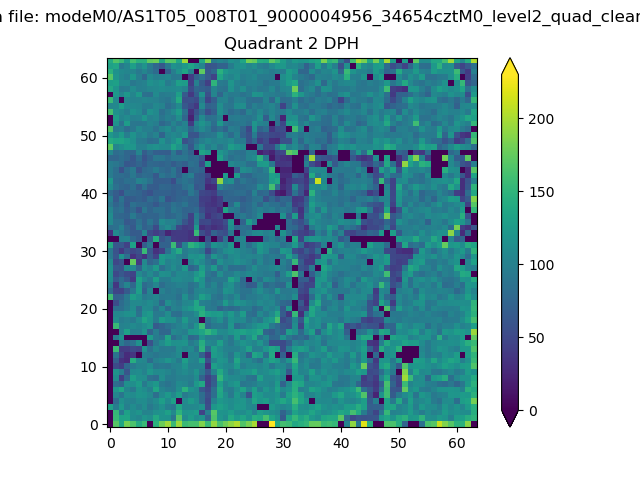
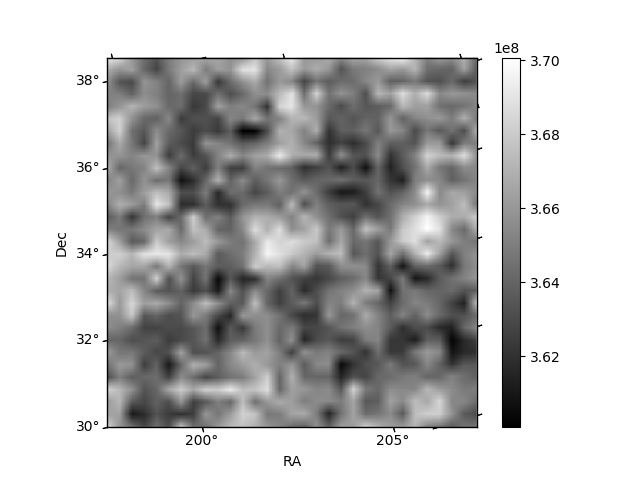
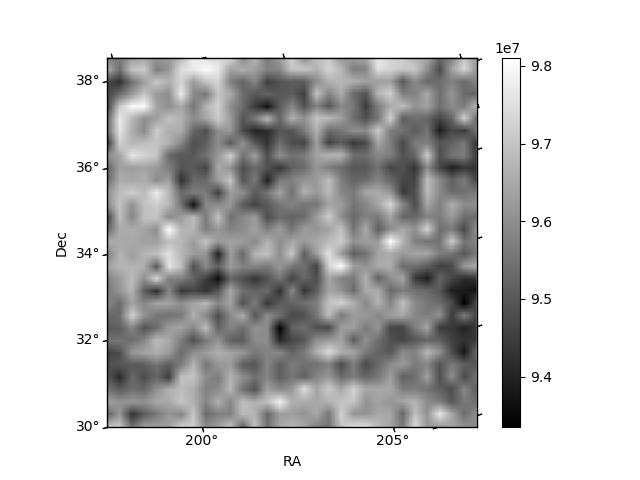
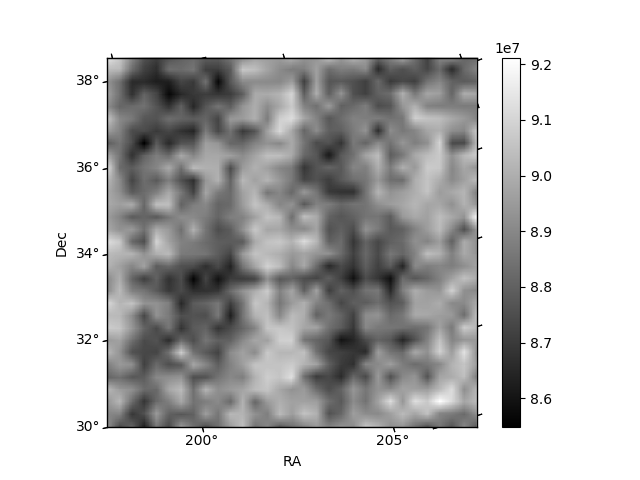
Histogram calculated using DETX and DETY for each event in the final _common_clean file
| Quadrant A | 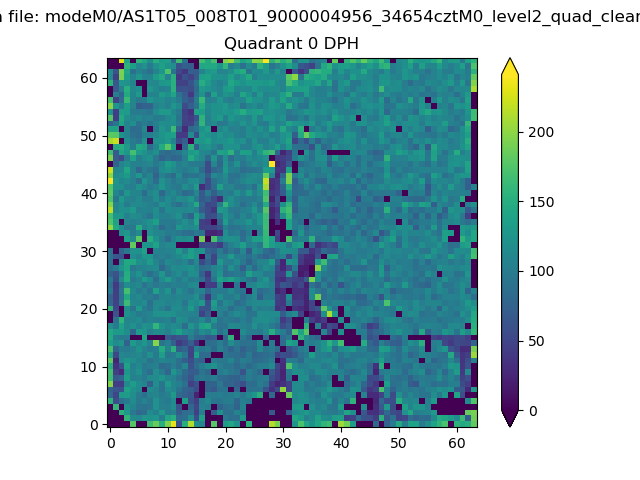 |
 |
Quadrant B |
|---|---|---|---|
| Quadrant D | 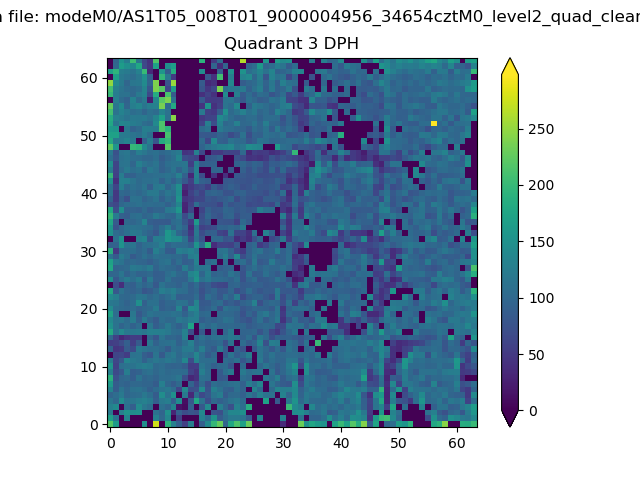 |
 |
Quadrant C |
| Plot type | Count rate plots | Images |
|---|---|---|
| Comparison with Poisson distribution Blue bars denote a histogram of data divided into 1 sec bins. Red curve is a Poisson curve with rate = median count rate of data. |
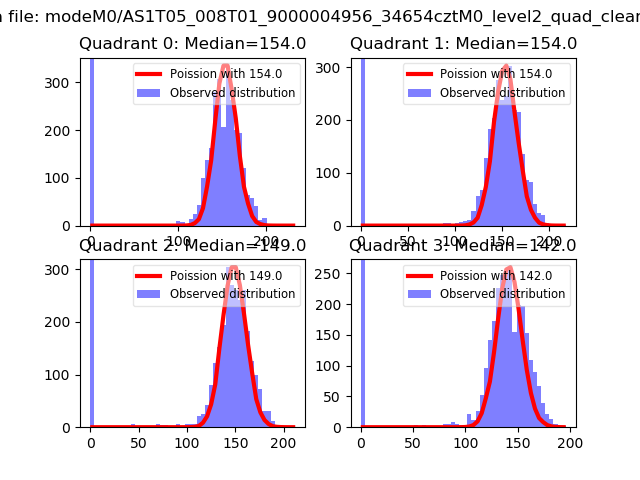 |
 |
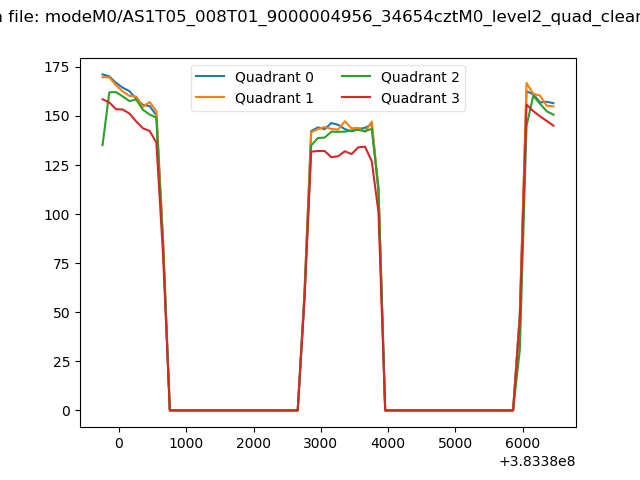
| Quadrant-wise count rates Data is divided into 100 sec bins |
 |
|
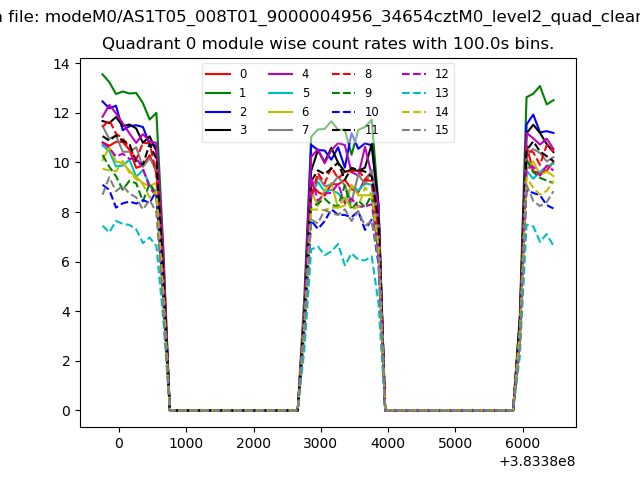
| Module-wise count rates for Quadrant A Data is divided into 100 sec bins |
 |
 |
| Module-wise count rates for Quadrant B Data is divided into 100 sec bins |
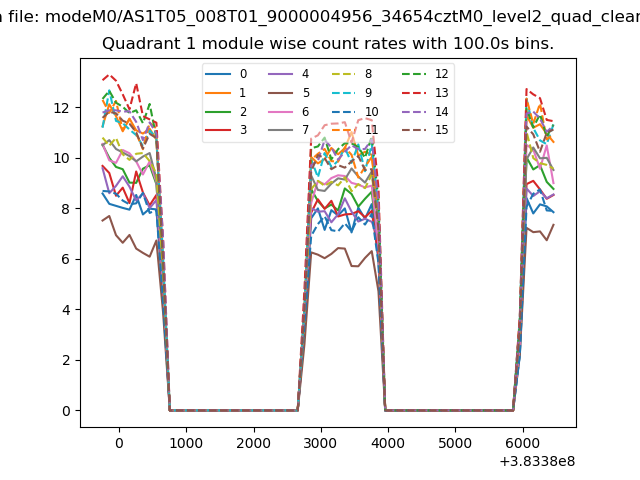 |
 |
| Module-wise count rates for Quadrant C Data is divided into 100 sec bins |
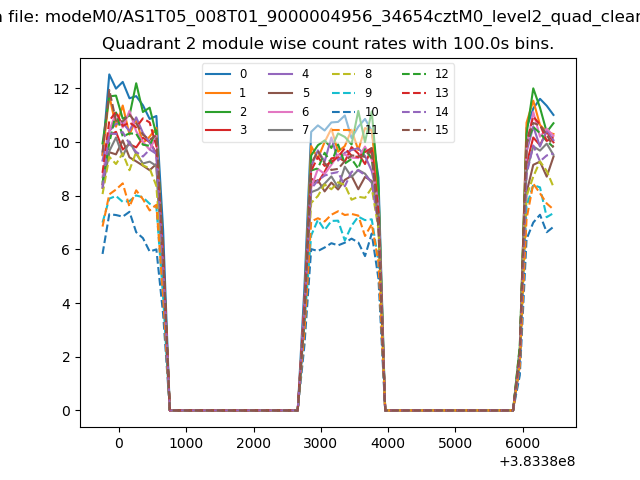 |
 |
| Module-wise count rates for Quadrant D Data is divided into 100 sec bins |
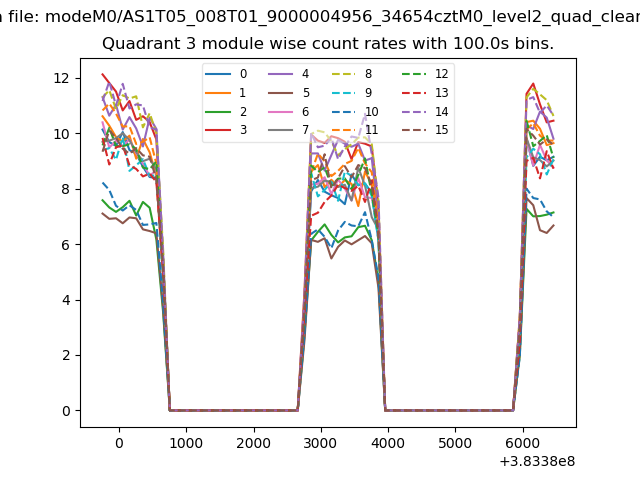 |
 |
| Parameter | Plot |
|---|---|
| CZT HV Monitor | 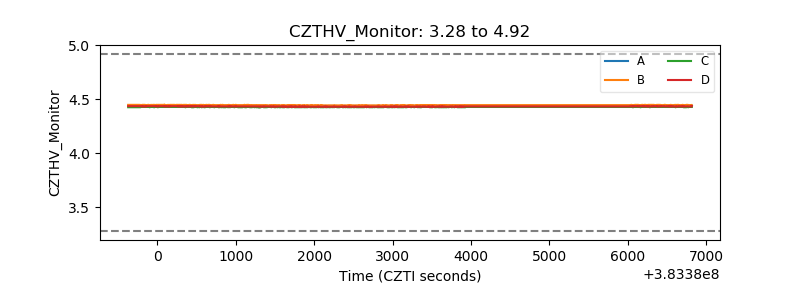 |
| D_VDD | 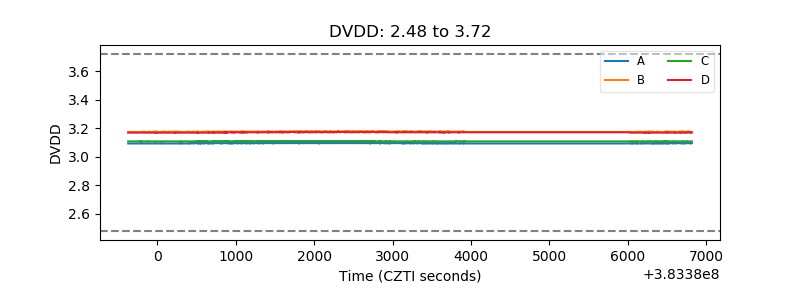 |
| Temperature 1 | 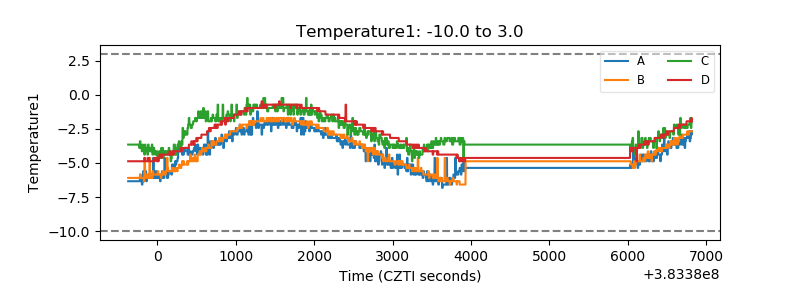 |
| Veto HV Monitor | 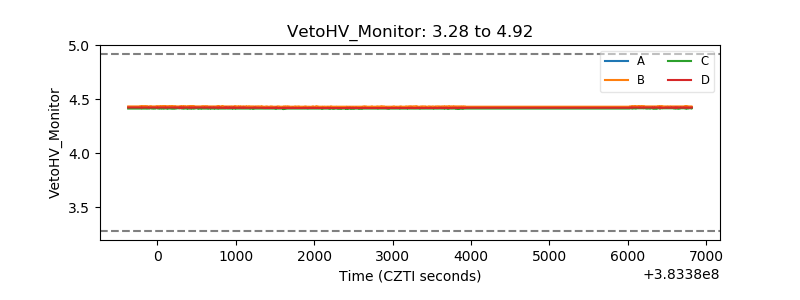 |
| Veto LLD | 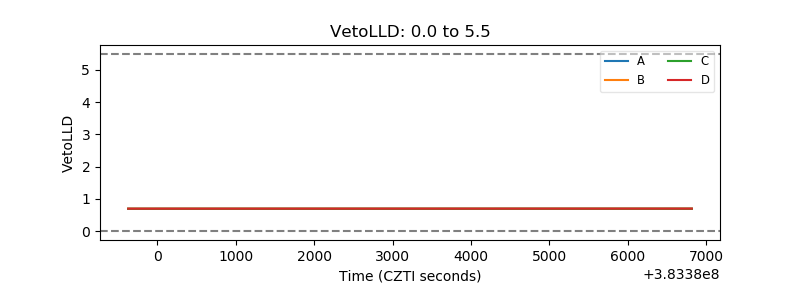 |
| Alpha Counter | 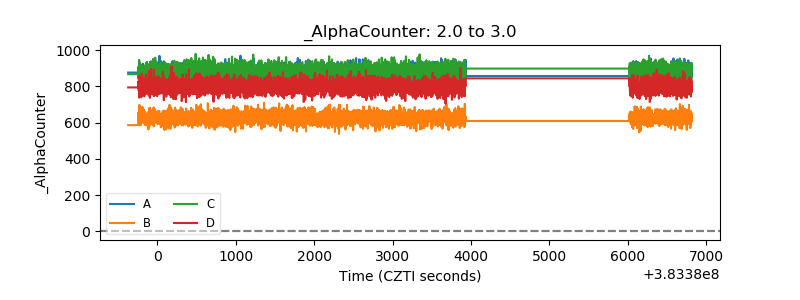 |
| _CPM_Rate | 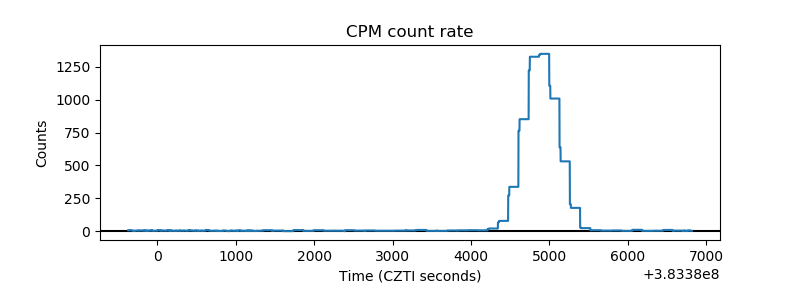 |
| CZT Counter | 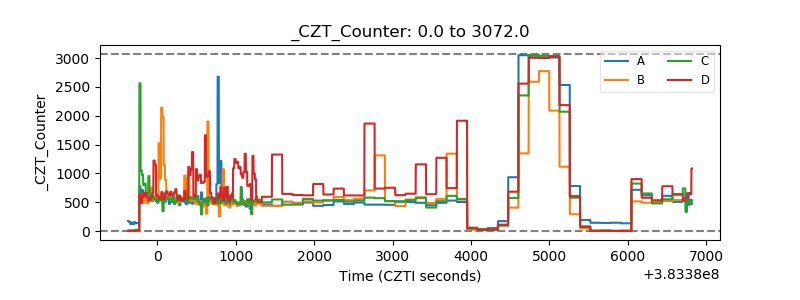 |
| +2.5 Volts monitor | 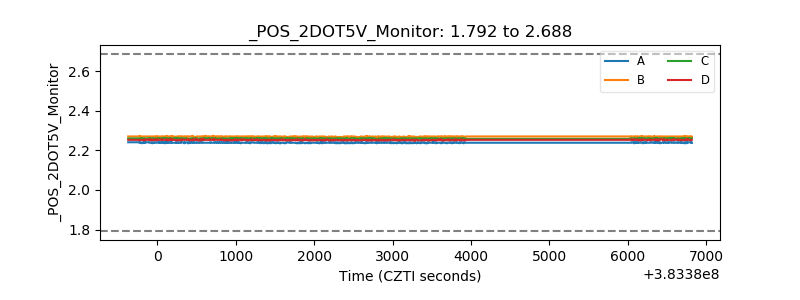 |
| +5 Volts monitor | 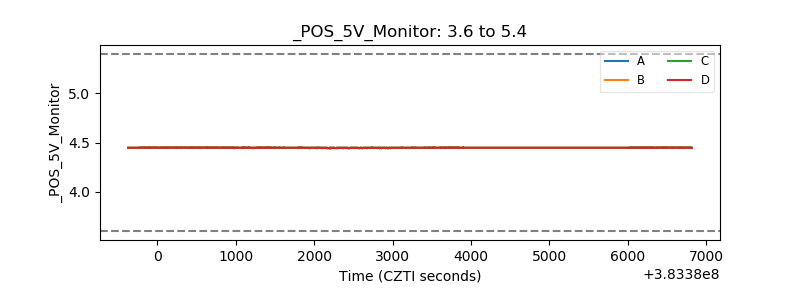 |
| _ROLL_ROT | 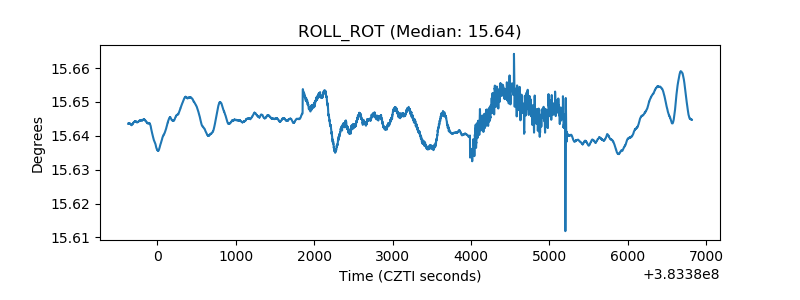 |
| _Roll_DEC | 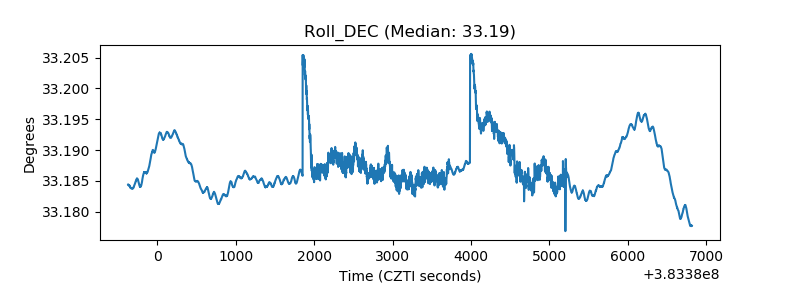 |
| _Roll_RA | 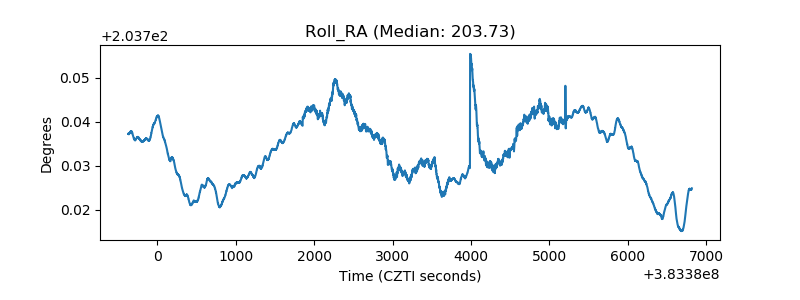 |
| Veto Counter | 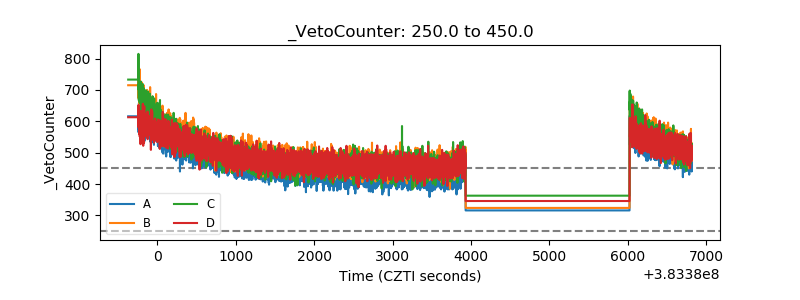 |