| Param | Original file | Final file |
|---|---|---|
| Filename | modeM0/AS1T05_008T01_9000004956_34653cztM0_level2.evt | modeM0/AS1T05_008T01_9000004956_34653cztM0_level2_quad_clean.evt |
| Size (bytes) | 434,689,920 | 68,011,200 |
| Size | 414.6 MB | 64.9 MB |
| Events in quadrant A | 2,555,082 | 439,319 |
| Events in quadrant B | 2,944,966 | 440,335 |
| Events in quadrant C | 2,761,617 | 427,429 |
| Events in quadrant D | 4,564,347 | 402,109 |
| Mode SS | |||
|---|---|---|---|
| Quadrant | BADHDUFLAG | Total packets | Discarded packets |
| A | 0 | 100 | 0 |
| B | 0 | 100 | 0 |
| C | 0 | 100 | 0 |
| D | 0 | 100 | 0 |
| Mode M9 | |||
|---|---|---|---|
| Quadrant | BADHDUFLAG | Total packets | Discarded packets |
| A | 0 | 21 | 0 |
| B | 0 | 21 | 0 |
| C | 0 | 21 | 0 |
| D | 0 | 21 | 0 |
| Mode M0 | |||
|---|---|---|---|
| Quadrant | BADHDUFLAG | Total packets | Discarded packets |
| A | 0 | 10310 | 2 |
| B | 0 | 11667 | 1 |
| C | 0 | 10851 | 1 |
| D | 0 | 17168 | 1 |
| Quadrant | Total seconds | Saturated seconds | Saturation percentage |
|---|---|---|---|
| A | 5000 | 1 | 0.020000% |
| B | 5000 | 54 | 1.080000% |
| C | 5000 | 39 | 0.780000% |
| D | 5000 | 90 | 1.800000% |
Noise dominated data is calculated using 1-second bins in cleaned event files. If a bin has >2000 counts, and if more than 50% of those come from <1% of pixels, then it is considered to be noise-dominated and hence unusable.
| Quadrant | # 1 sec bins | Bins with >0 counts | Bins with >2000 counts | High rate bins dominated by noise | Noise dominated (total time) | Noise dominated (detector-on time) | Marked lightcurve |
|---|---|---|---|---|---|---|---|
| A | 7033 | 5001 | 0 | 0 | 0.00% | 0.00% | 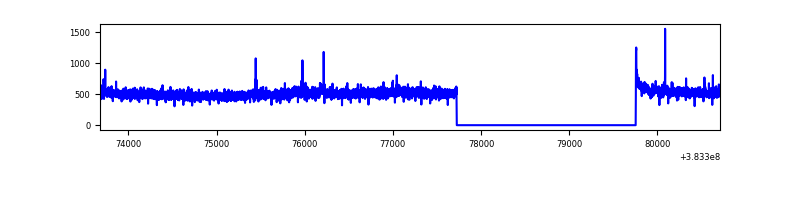 |
| B | 7033 | 5001 | 35 | 35 | 0.50% | 0.70% | 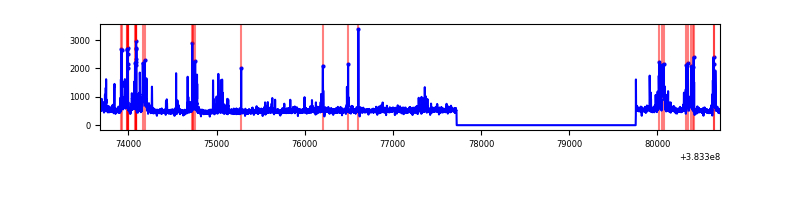 |
| C | 7033 | 5001 | 31 | 31 | 0.44% | 0.62% | 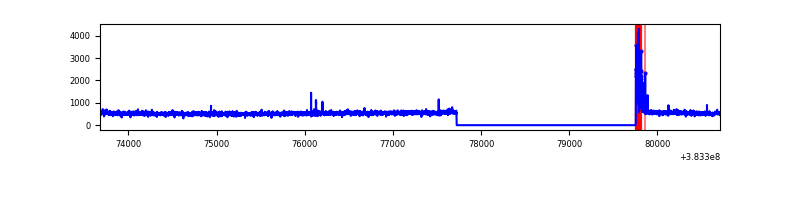 |
| D | 7033 | 5001 | 61 | 61 | 0.87% | 1.22% | 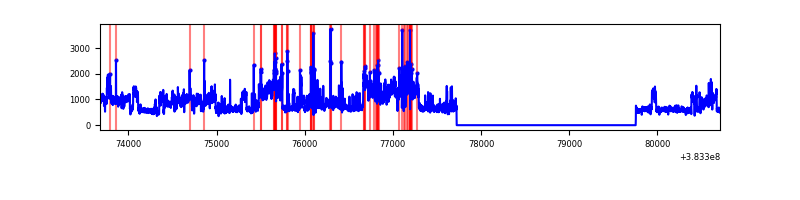 |
Top three noisy pixels from each quadrant. If the there are fewer than three noisy pixels in the level2.evt file, extra rows are filled as -1
| Pixel properties | Quadrant properties | ||||||
|---|---|---|---|---|---|---|---|
| Quadrant | DetID | PixID | Counts | Sigma | Mean | Median | Sigma |
| A | 10 | 83 | 31102 | 239.51 | 643 | 631 | 127.2 |
| A | 13 | 6 | 25795 | 197.8 | 643 | 631 | 127.2 |
| A | 9 | 143 | 11768 | 87.54 | 643 | 631 | 127.2 |
| B | 5 | 172 | 388391 | 3269.52 | 629 | 616 | 118.6 |
| B | 4 | 232 | 21283 | 174.25 | 629 | 616 | 118.6 |
| B | 5 | 255 | 20607 | 168.55 | 629 | 616 | 118.6 |
| C | 15 | 214 | 214114 | 1524.91 | 607 | 610 | 140.0 |
| C | 0 | 10 | 121277 | 861.84 | 607 | 610 | 140.0 |
| C | 14 | 67 | 47416 | 334.3 | 607 | 610 | 140.0 |
| D | 8 | 195 | 1797062 | 11872.26 | 613 | 594 | 151.3 |
| D | 14 | 52 | 59703 | 390.63 | 613 | 594 | 151.3 |
| D | 2 | 250 | 49415 | 322.64 | 613 | 594 | 151.3 |
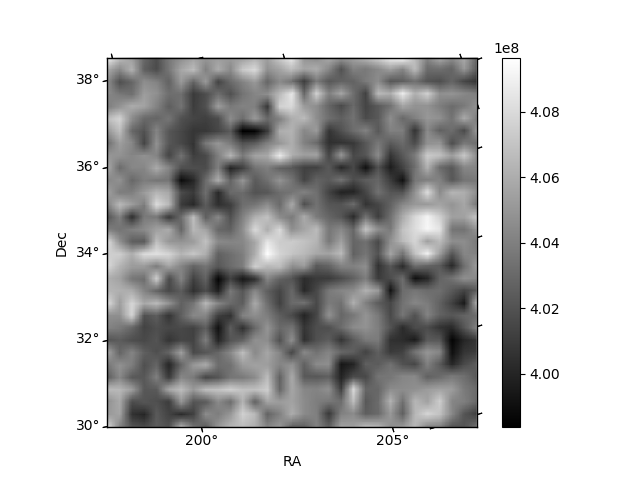
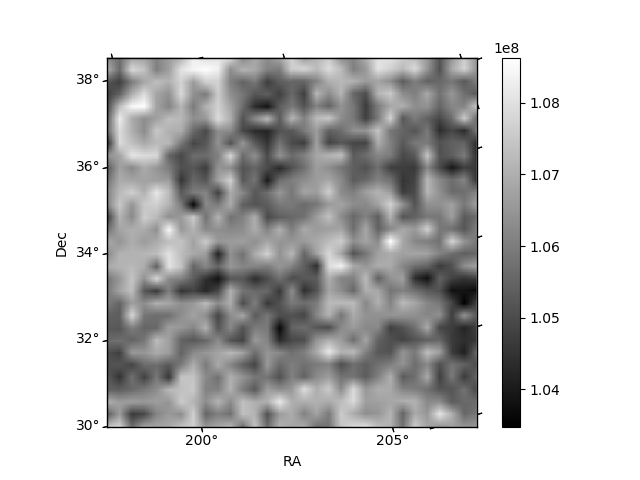
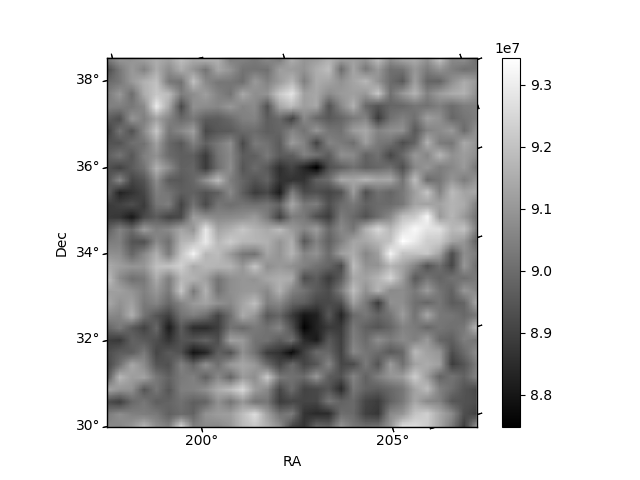
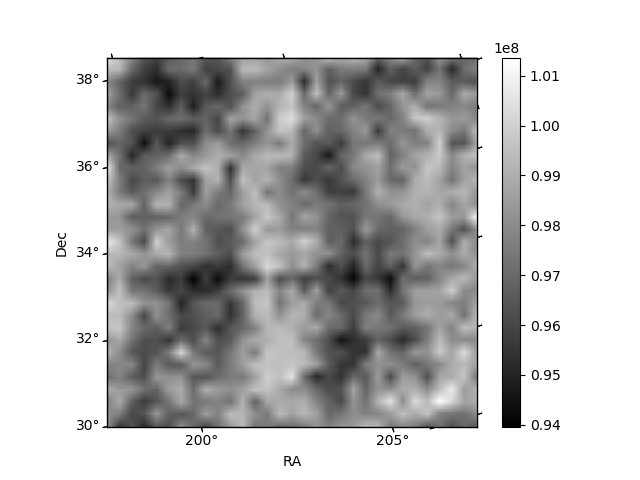
Histogram calculated using DETX and DETY for each event in the final _common_clean file
| Quadrant A | 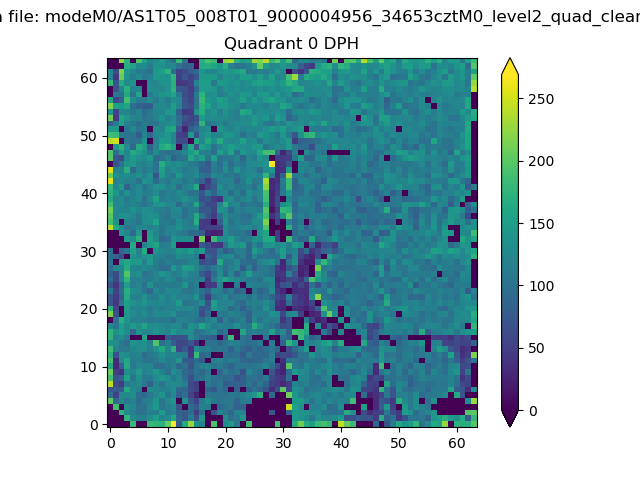 |
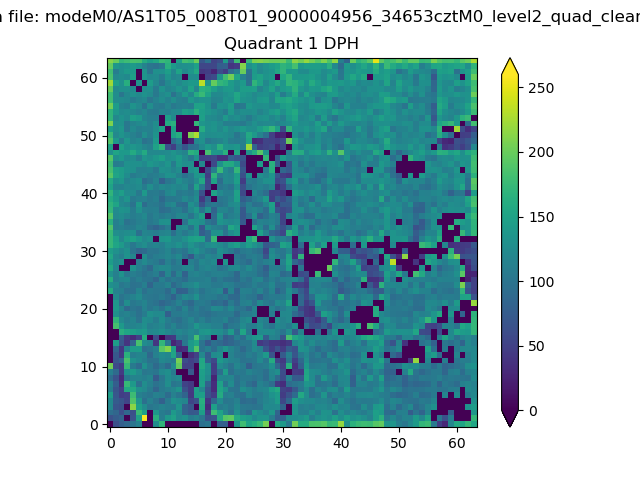 |
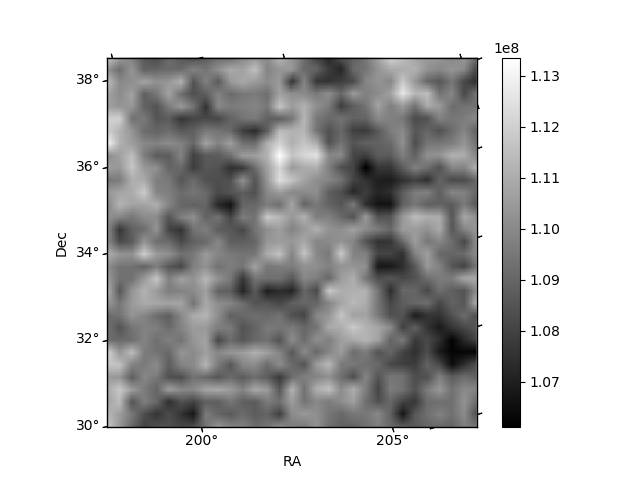
Quadrant B |
|---|---|---|---|
| Quadrant D | 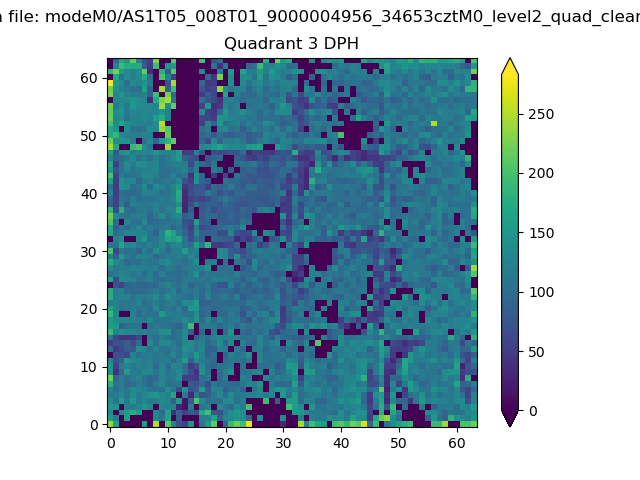 |
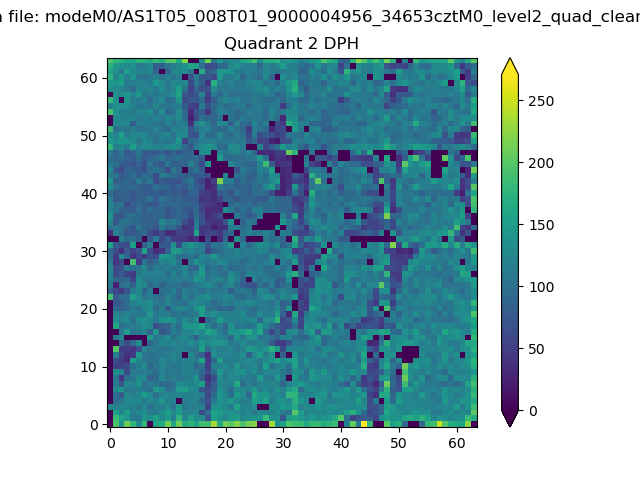 |
Quadrant C |
| Plot type | Count rate plots | Images |
|---|---|---|
| Comparison with Poisson distribution Blue bars denote a histogram of data divided into 1 sec bins. Red curve is a Poisson curve with rate = median count rate of data. |
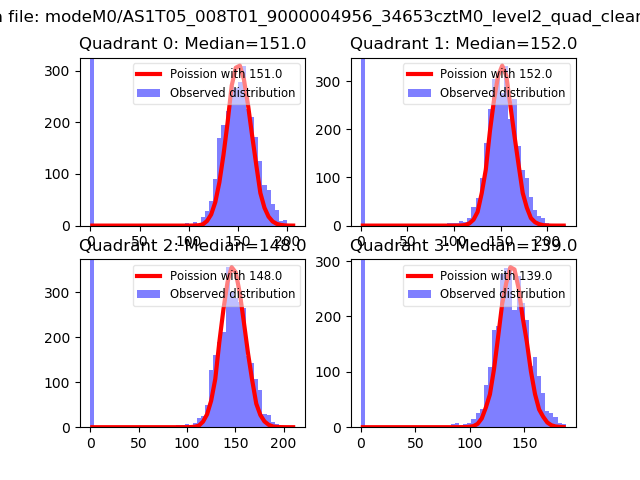 |
 |
| Quadrant-wise count rates Data is divided into 100 sec bins |
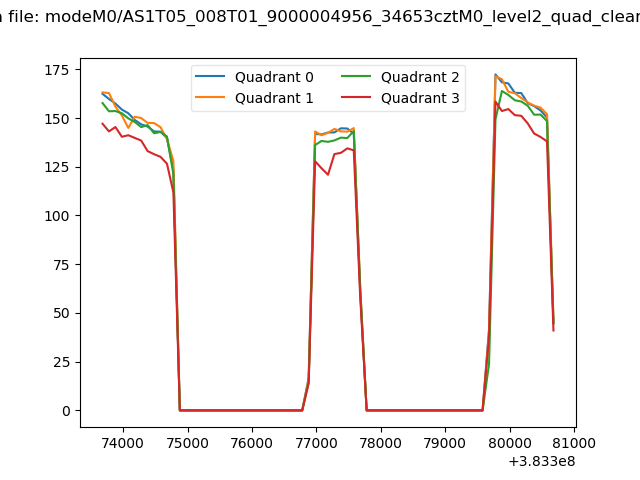 |
|
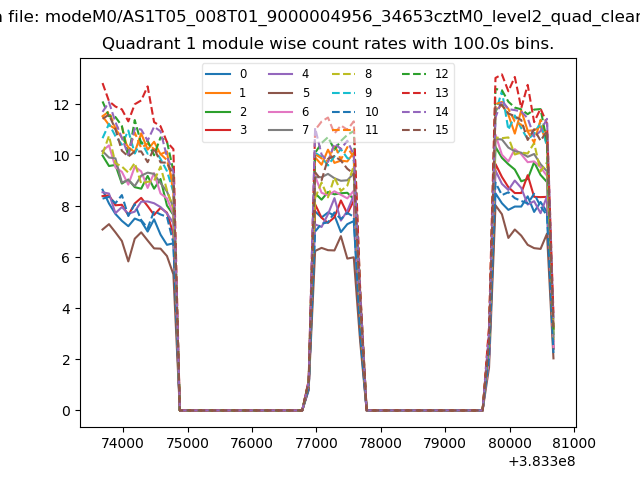
| Module-wise count rates for Quadrant A Data is divided into 100 sec bins |
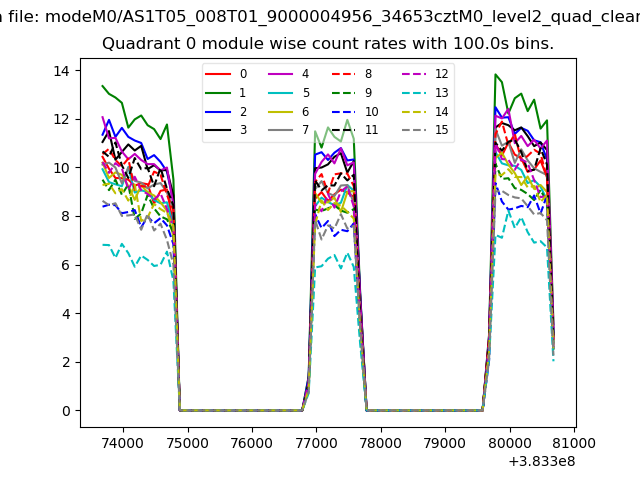 |
 |
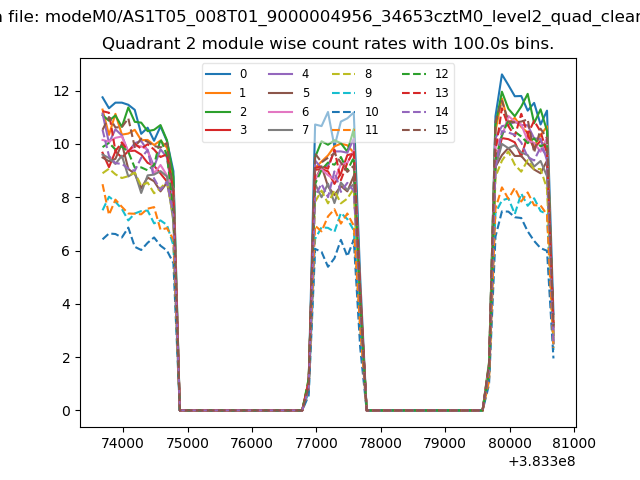
| Module-wise count rates for Quadrant B Data is divided into 100 sec bins |
 |
 |
| Module-wise count rates for Quadrant C Data is divided into 100 sec bins |
 |
 |
| Module-wise count rates for Quadrant D Data is divided into 100 sec bins |
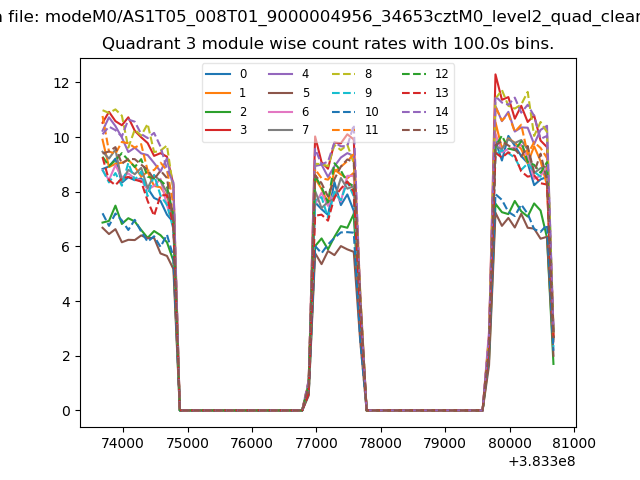 |
 |
| Parameter | Plot |
|---|---|
| CZT HV Monitor | 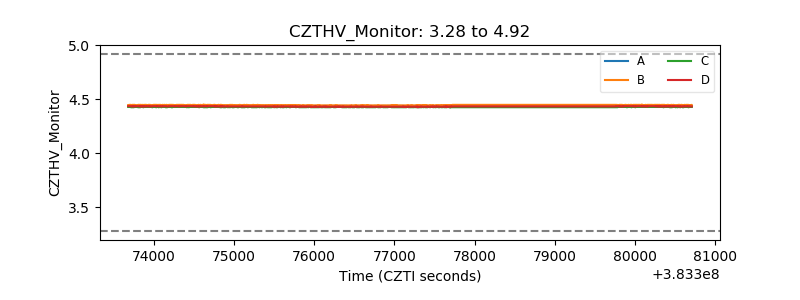 |
| D_VDD | 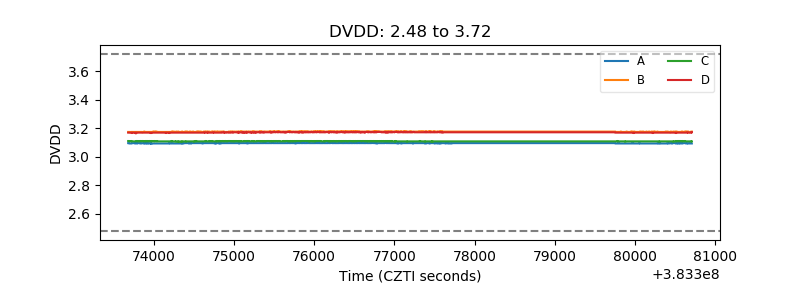 |
| Temperature 1 | 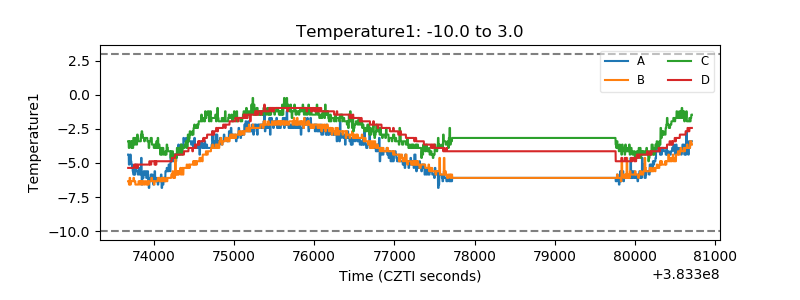 |
| Veto HV Monitor | 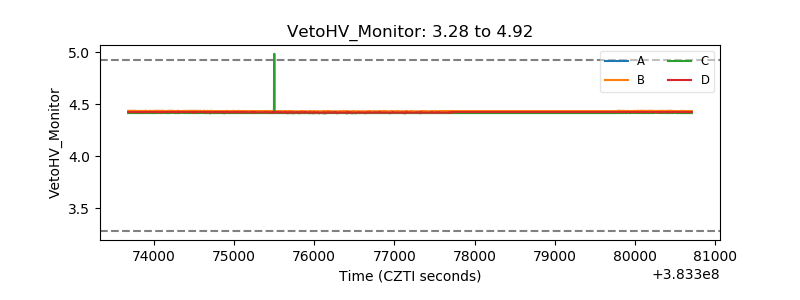 |
| Veto LLD | 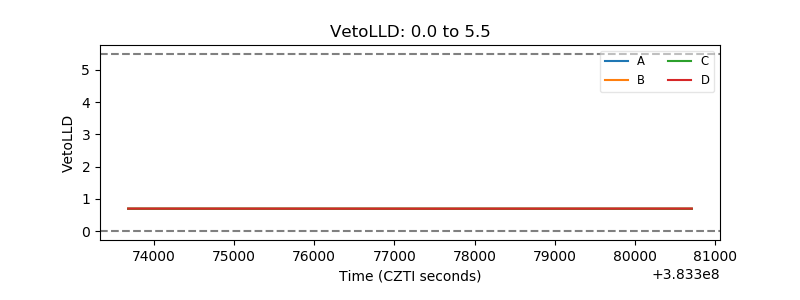 |
| Alpha Counter | 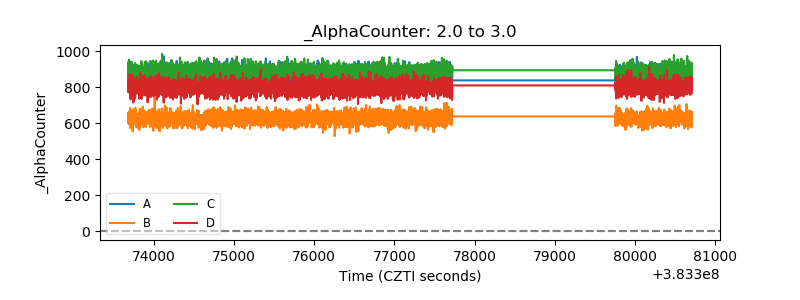 |
| _CPM_Rate | 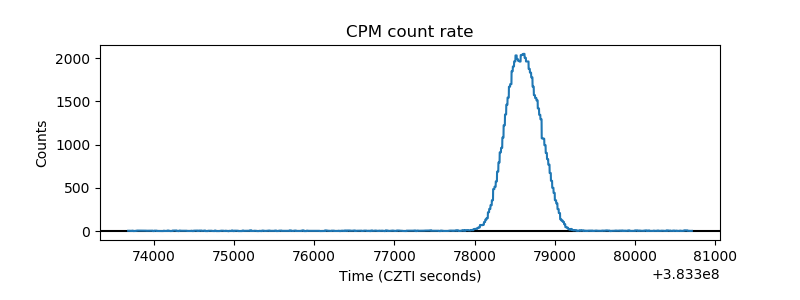 |
| CZT Counter | 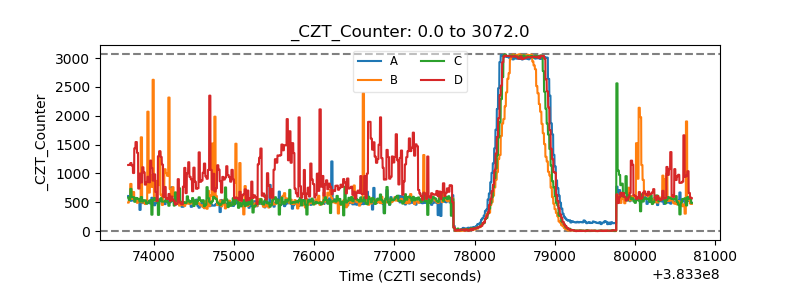 |
| +2.5 Volts monitor | 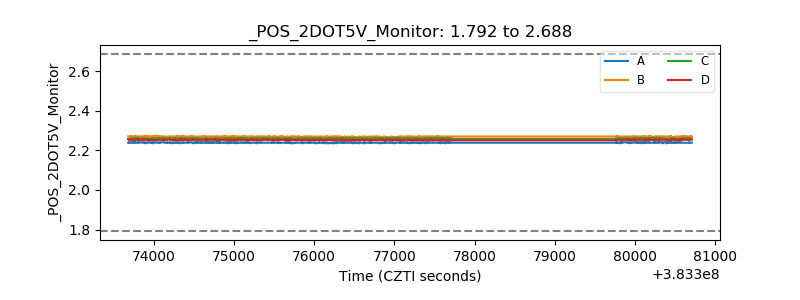 |
| +5 Volts monitor | 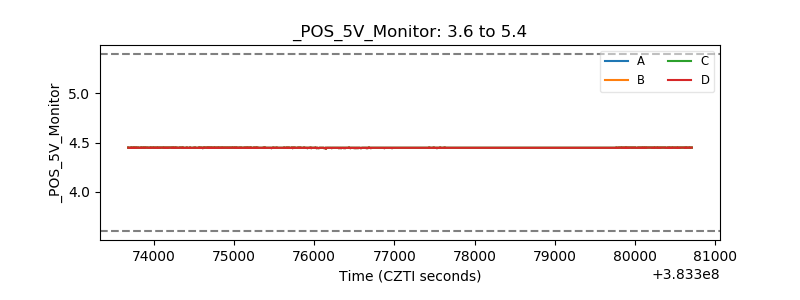 |
| _ROLL_ROT | 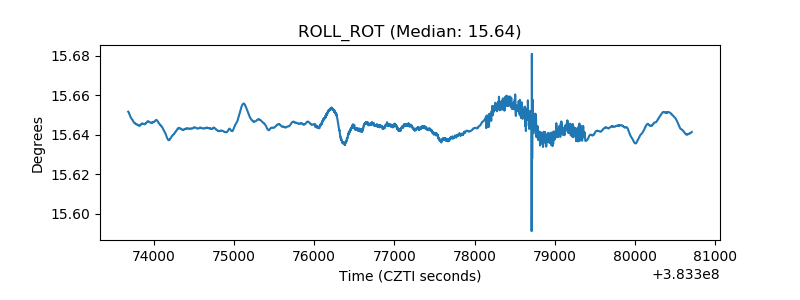 |
| _Roll_DEC | 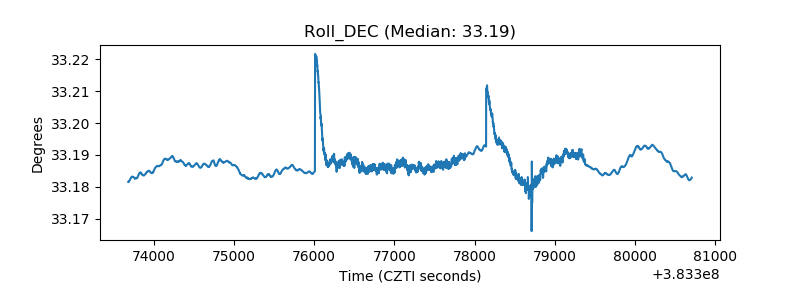 |
| _Roll_RA | 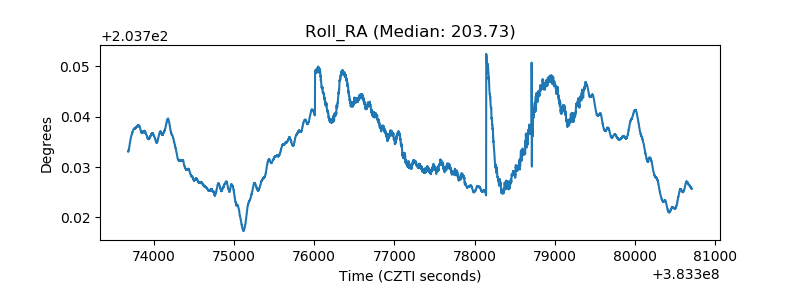 |
| Veto Counter | 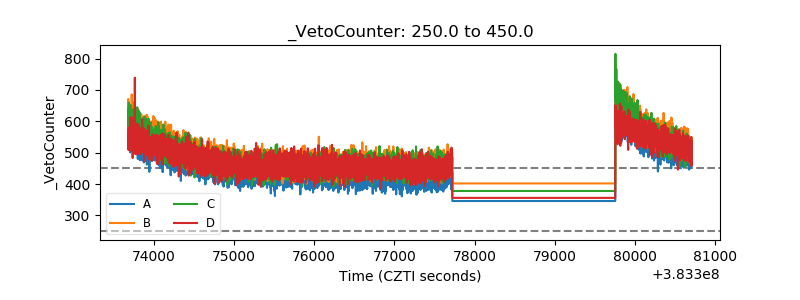 |