| Param | Original file | Final file |
|---|---|---|
| Filename | modeM0/AS1T05_008T01_9000004956_34649cztM0_level2.evt | modeM0/AS1T05_008T01_9000004956_34649cztM0_level2_quad_clean.evt |
| Size (bytes) | 465,687,360 | 72,636,480 |
| Size | 444.1 MB | 69.3 MB |
| Events in quadrant A | 2,550,481 | 457,758 |
| Events in quadrant B | 3,442,510 | 459,698 |
| Events in quadrant C | 2,934,161 | 458,067 |
| Events in quadrant D | 4,792,568 | 428,487 |
| Mode SS | |||
|---|---|---|---|
| Quadrant | BADHDUFLAG | Total packets | Discarded packets |
| A | 0 | 116 | 0 |
| B | 0 | 116 | 0 |
| C | 0 | 116 | 0 |
| D | 0 | 116 | 0 |
| Mode M9 | |||
|---|---|---|---|
| Quadrant | BADHDUFLAG | Total packets | Discarded packets |
| A | 0 | 22 | 0 |
| B | 0 | 22 | 0 |
| C | 0 | 22 | 0 |
| D | 0 | 23 | 0 |
| Mode M0 | |||
|---|---|---|---|
| Quadrant | BADHDUFLAG | Total packets | Discarded packets |
| A | 0 | 11495 | 25 |
| B | 0 | 13923 | 59 |
| C | 0 | 12216 | 16 |
| D | 0 | 18215 | 70 |
| Quadrant | Total seconds | Saturated seconds | Saturation percentage |
|---|---|---|---|
| A | 5652 | 5 | 0.088464% |
| B | 5646 | 130 | 2.302515% |
| C | 5661 | 76 | 1.342519% |
| D | 5644 | 122 | 2.161588% |
Noise dominated data is calculated using 1-second bins in cleaned event files. If a bin has >2000 counts, and if more than 50% of those come from <1% of pixels, then it is considered to be noise-dominated and hence unusable.
| Quadrant | # 1 sec bins | Bins with >0 counts | Bins with >2000 counts | High rate bins dominated by noise | Noise dominated (total time) | Noise dominated (detector-on time) | Marked lightcurve |
|---|---|---|---|---|---|---|---|
| A | 7342 | 5665 | 1 | 1 | 0.01% | 0.02% | 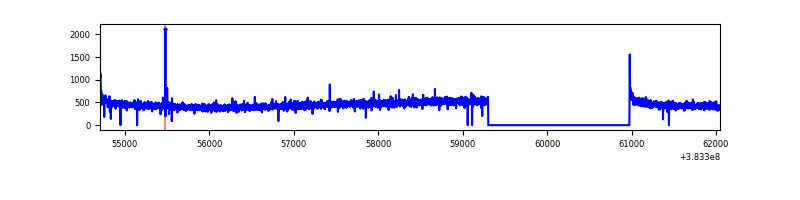 |
| B | 7342 | 5663 | 94 | 94 | 1.28% | 1.66% | 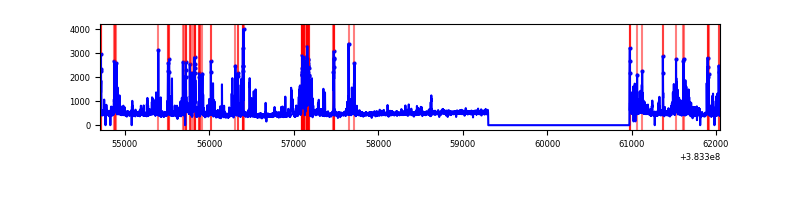 |
| C | 7342 | 5668 | 60 | 60 | 0.82% | 1.06% | 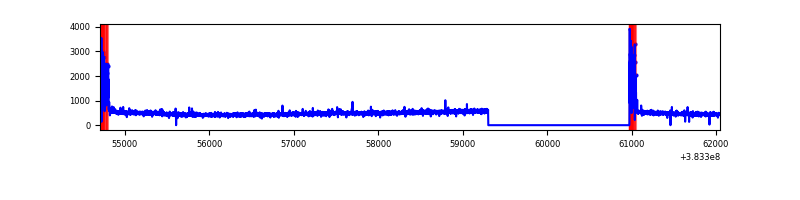 |
| D | 7342 | 5663 | 85 | 85 | 1.16% | 1.50% | 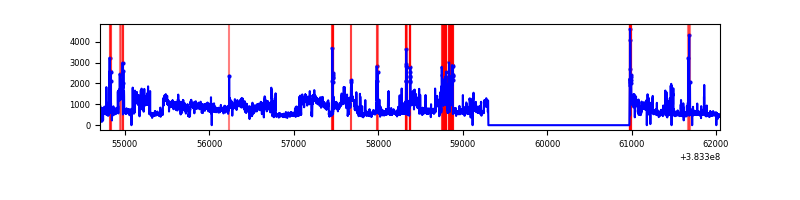 |
Top three noisy pixels from each quadrant. If the there are fewer than three noisy pixels in the level2.evt file, extra rows are filled as -1
| Pixel properties | Quadrant properties | ||||||
|---|---|---|---|---|---|---|---|
| Quadrant | DetID | PixID | Counts | Sigma | Mean | Median | Sigma |
| A | 10 | 83 | 46306 | 358.75 | 642 | 631 | 127.3 |
| A | 13 | 6 | 10462 | 77.22 | 642 | 631 | 127.3 |
| A | 13 | 254 | 10375 | 76.53 | 642 | 631 | 127.3 |
| B | 5 | 172 | 802560 | 6549.75 | 638 | 620 | 122.4 |
| B | 4 | 232 | 68046 | 550.69 | 638 | 620 | 122.4 |
| B | 0 | 219 | 21425 | 169.92 | 638 | 620 | 122.4 |
| C | 15 | 214 | 239134 | 1655.91 | 621 | 625 | 144.0 |
| C | 0 | 10 | 231827 | 1605.18 | 621 | 625 | 144.0 |
| C | 14 | 67 | 23965 | 162.04 | 621 | 625 | 144.0 |
| D | 8 | 195 | 1884868 | 12466.23 | 614 | 596 | 151.2 |
| D | 2 | 120 | 184491 | 1216.64 | 614 | 596 | 151.2 |
| D | 2 | 250 | 116375 | 765.98 | 614 | 596 | 151.2 |
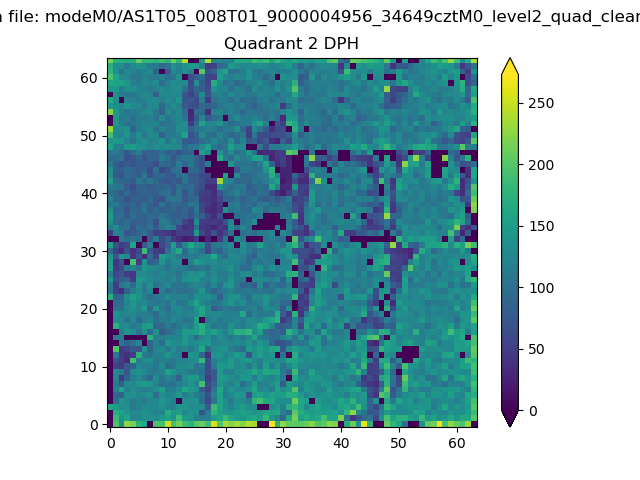
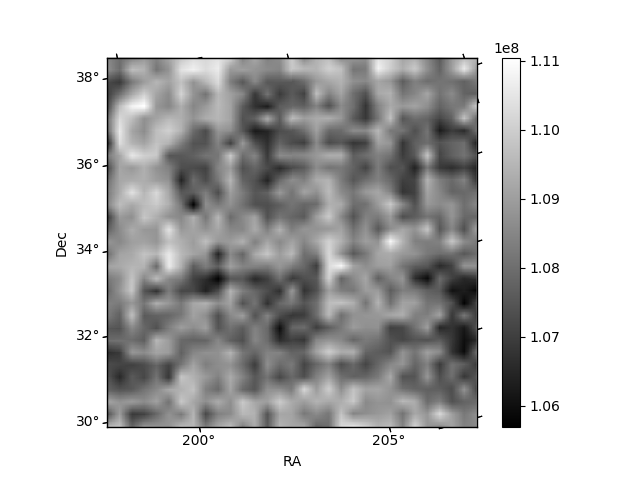
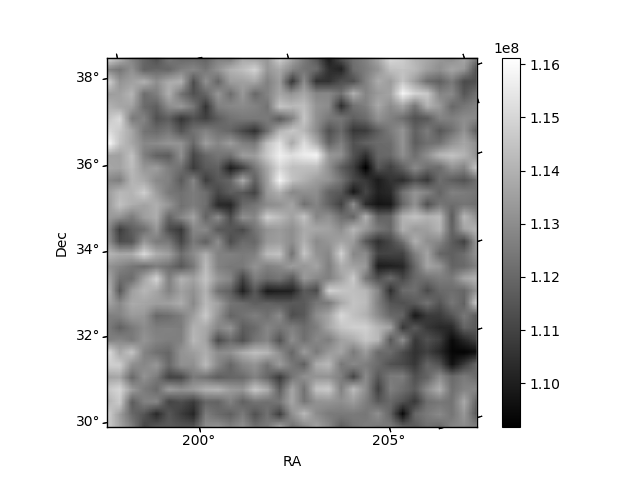
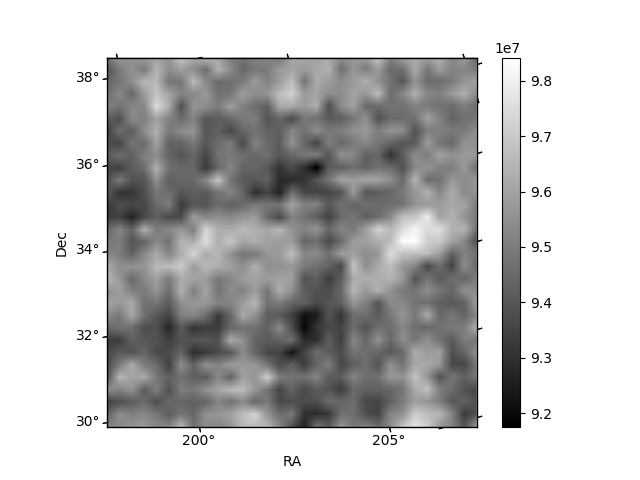
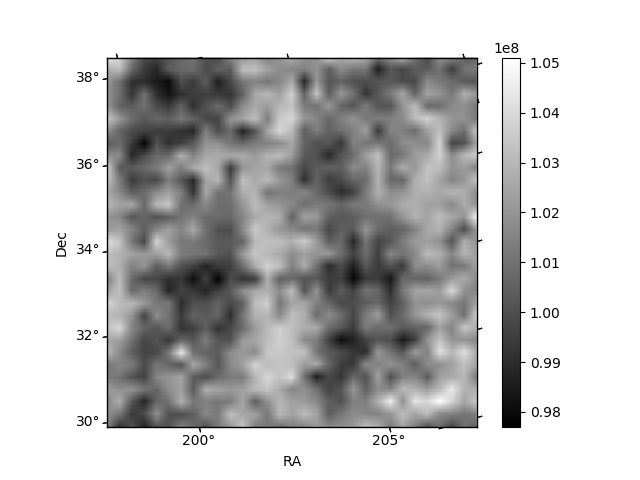
Histogram calculated using DETX and DETY for each event in the final _common_clean file
| Quadrant A | 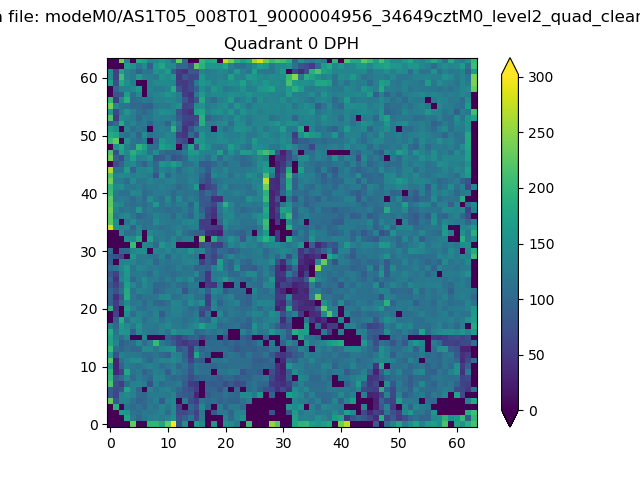 |
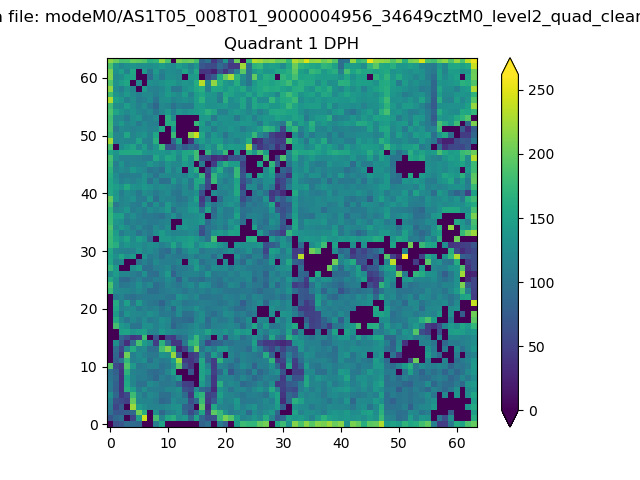 |
Quadrant B |
|---|---|---|---|
| Quadrant D | 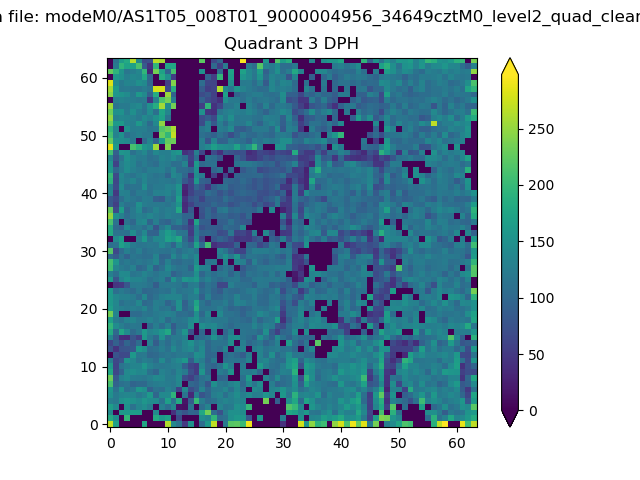 |
 |
Quadrant C |
| Plot type | Count rate plots | Images |
|---|---|---|
| Comparison with Poisson distribution Blue bars denote a histogram of data divided into 1 sec bins. Red curve is a Poisson curve with rate = median count rate of data. |
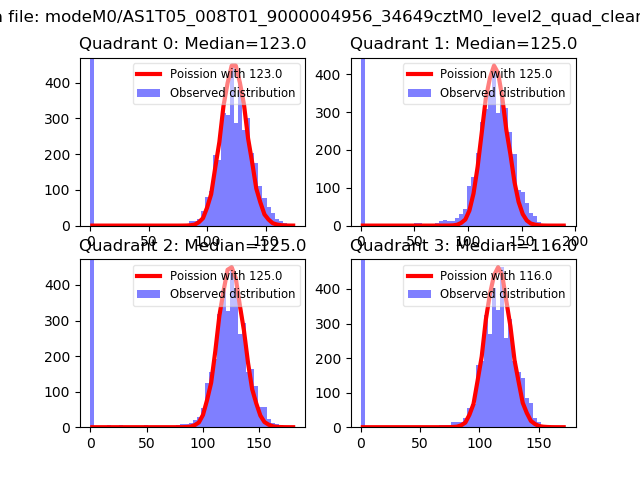 |
 |
| Quadrant-wise count rates Data is divided into 100 sec bins |
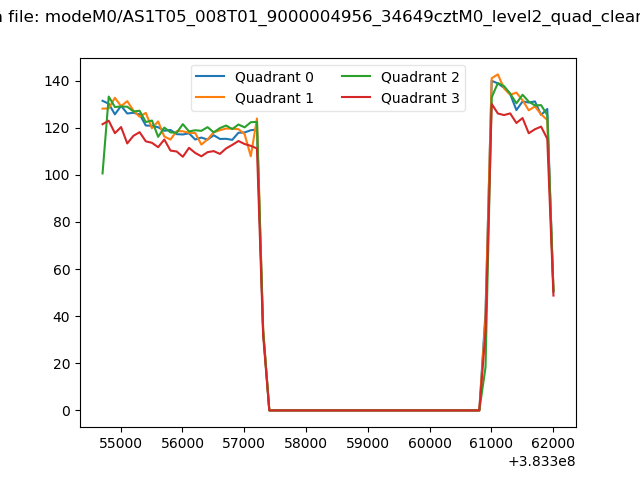 |
|
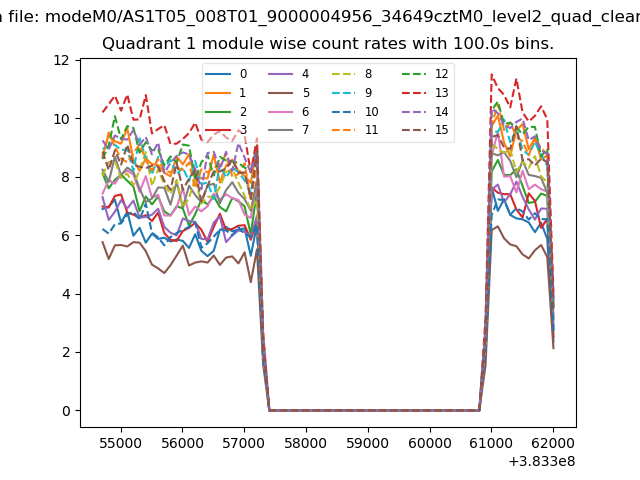
| Module-wise count rates for Quadrant A Data is divided into 100 sec bins |
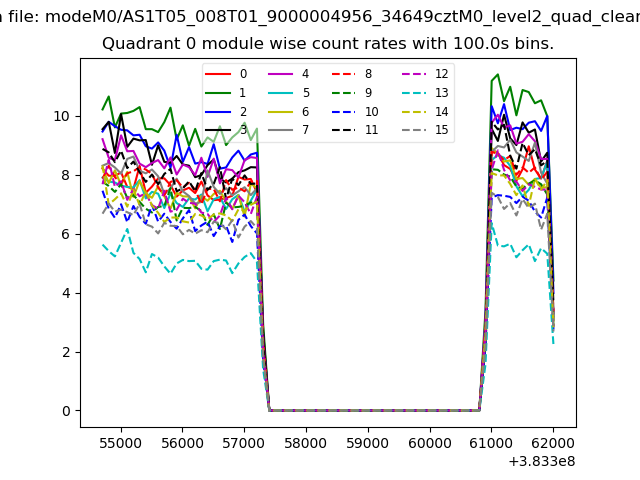 |
 |
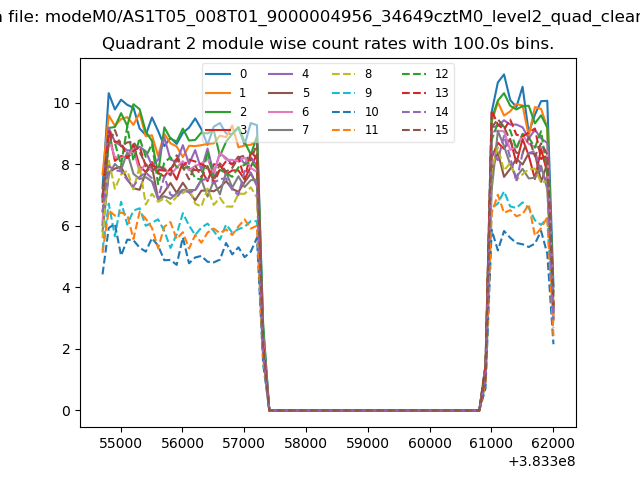
| Module-wise count rates for Quadrant B Data is divided into 100 sec bins |
 |
 |
| Module-wise count rates for Quadrant C Data is divided into 100 sec bins |
 |
 |
| Module-wise count rates for Quadrant D Data is divided into 100 sec bins |
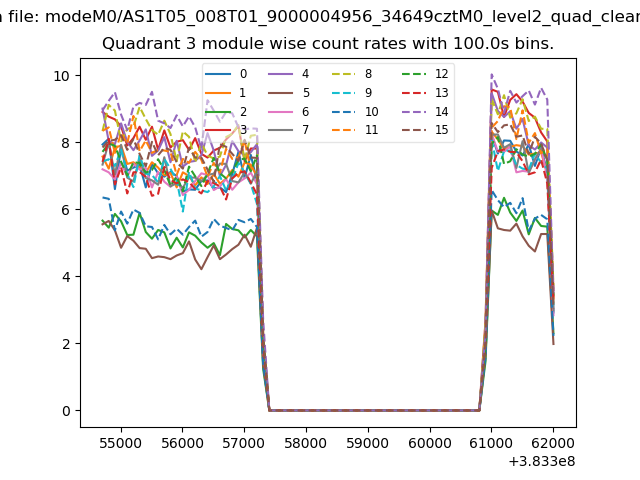 |
 |
| Parameter | Plot |
|---|---|
| CZT HV Monitor | 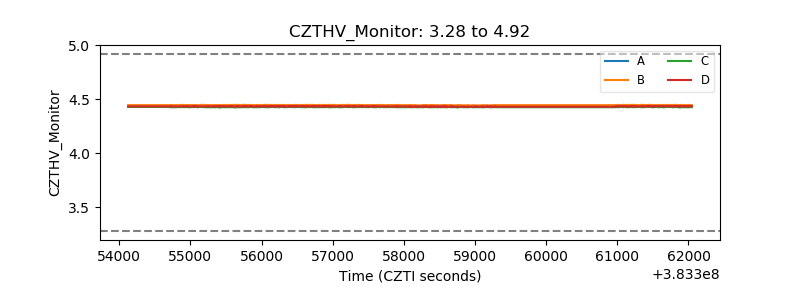 |
| D_VDD | 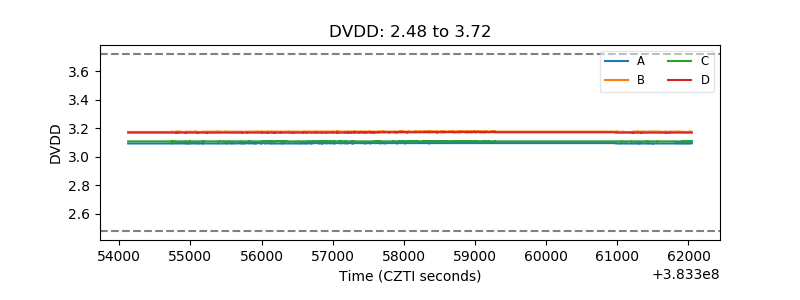 |
| Temperature 1 | 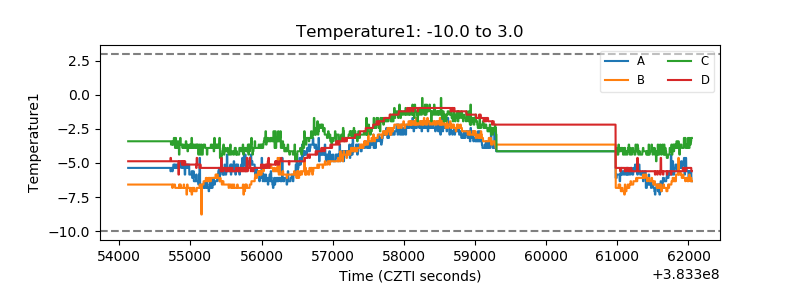 |
| Veto HV Monitor | 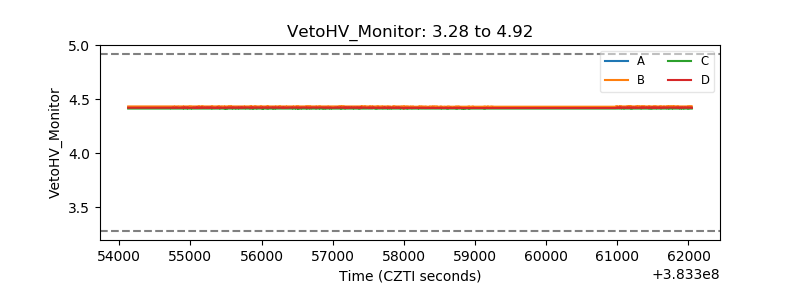 |
| Veto LLD | 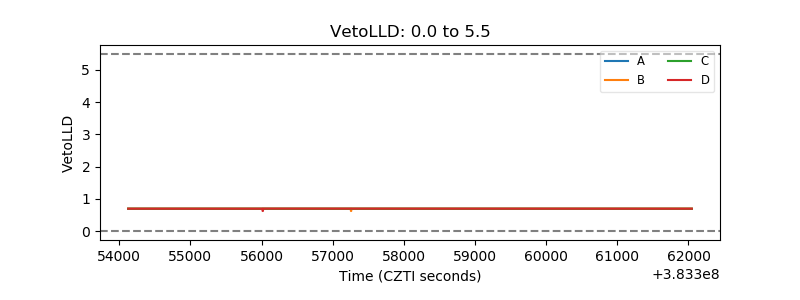 |
| Alpha Counter | 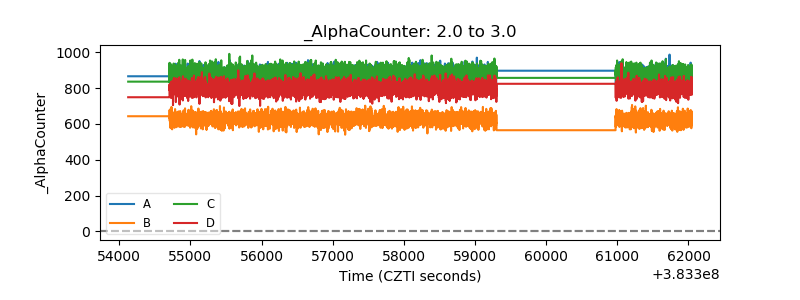 |
| _CPM_Rate | 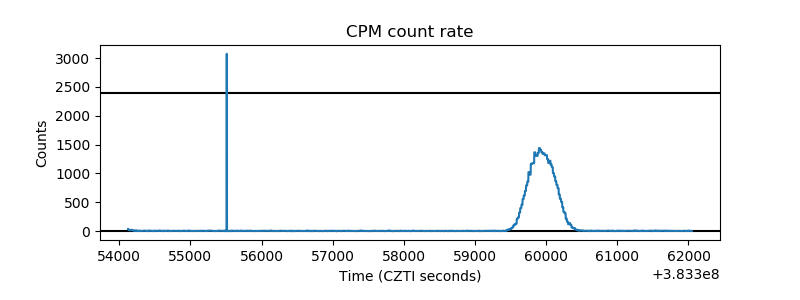 |
| CZT Counter | 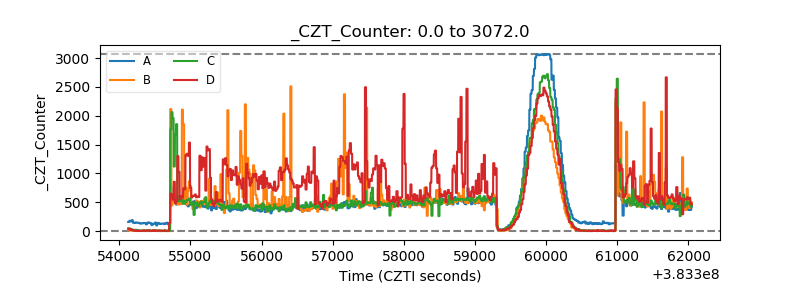 |
| +2.5 Volts monitor |  |
| +5 Volts monitor | 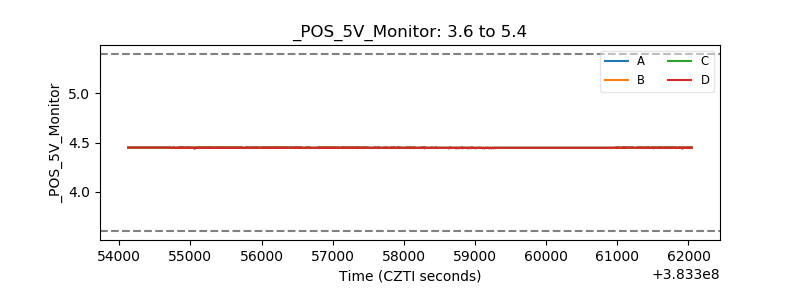 |
| _ROLL_ROT | 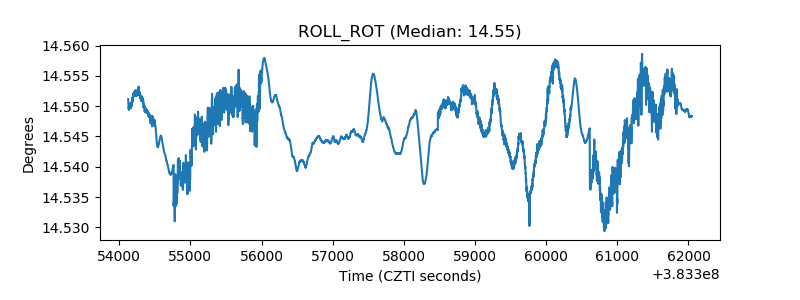 |
| _Roll_DEC | 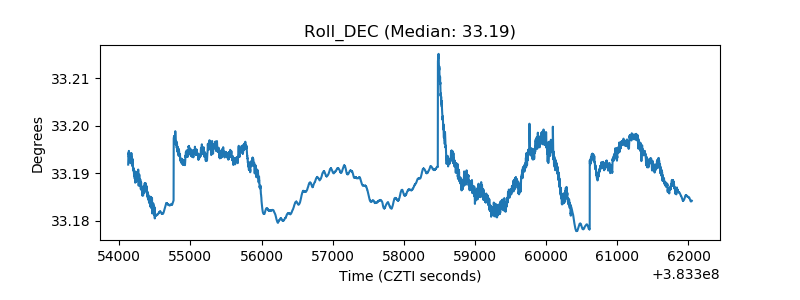 |
| _Roll_RA | 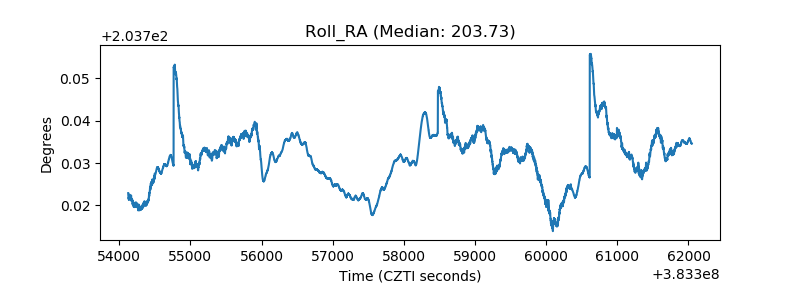 |
| Veto Counter | 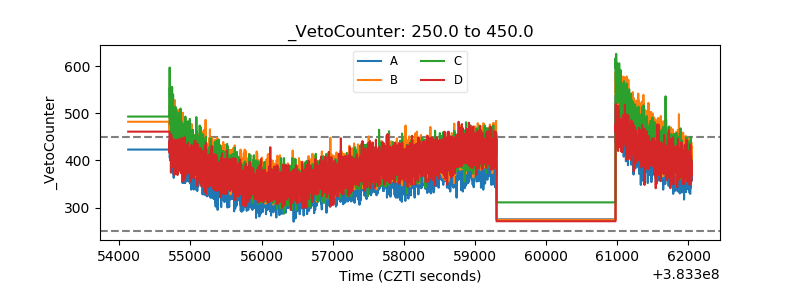 |