| Param | Original file | Final file |
|---|---|---|
| Filename | modeM0/AS1T05_008T01_9000004956_34647cztM0_level2.evt | modeM0/AS1T05_008T01_9000004956_34647cztM0_level2_quad_clean.evt |
| Size (bytes) | 321,269,760 | 63,858,240 |
| Size | 306.4 MB | 60.9 MB |
| Events in quadrant A | 1,603,045 | 428,286 |
| Events in quadrant B | 2,144,890 | 423,865 |
| Events in quadrant C | 1,840,145 | 427,159 |
| Events in quadrant D | 3,889,815 | 392,909 |
| Mode SS | |||
|---|---|---|---|
| Quadrant | BADHDUFLAG | Total packets | Discarded packets |
| A | 0 | 74 | 0 |
| B | 0 | 74 | 0 |
| C | 0 | 74 | 0 |
| D | 0 | 74 | 0 |
| Mode M9 | |||
|---|---|---|---|
| Quadrant | BADHDUFLAG | Total packets | Discarded packets |
| A | 1 | 139678669425448 | 46 |
| B | 1 | -1 | -1 |
| C | 1 | -1 | -1 |
| D | 1 | -1 | -1 |
| Mode M0 | |||
|---|---|---|---|
| Quadrant | BADHDUFLAG | Total packets | Discarded packets |
| A | 0 | 7515 | 2 |
| B | 0 | 8871 | 1 |
| C | 0 | 7817 | 1 |
| D | 0 | 14148 | 1 |
| Quadrant | Total seconds | Saturated seconds | Saturation percentage |
|---|---|---|---|
| A | 3694 | 3 | 0.081213% |
| B | 3694 | 129 | 3.492149% |
| C | 3694 | 31 | 0.839199% |
| D | 3694 | 256 | 6.930157% |
Noise dominated data is calculated using 1-second bins in cleaned event files. If a bin has >2000 counts, and if more than 50% of those come from <1% of pixels, then it is considered to be noise-dominated and hence unusable.
| Quadrant | # 1 sec bins | Bins with >0 counts | Bins with >2000 counts | High rate bins dominated by noise | Noise dominated (total time) | Noise dominated (detector-on time) | Marked lightcurve |
|---|---|---|---|---|---|---|---|
| A | 3694 | 3694 | 3 | 3 | 0.08% | 0.08% | 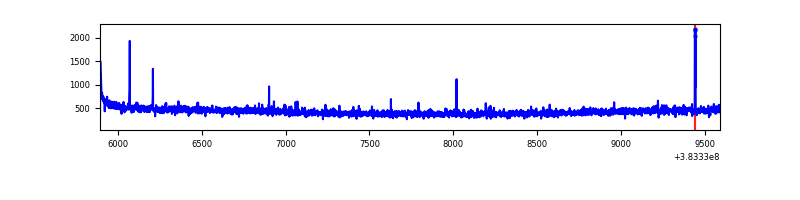 |
| B | 3694 | 3694 | 91 | 91 | 2.46% | 2.46% |  |
| C | 3694 | 3694 | 20 | 20 | 0.54% | 0.54% | 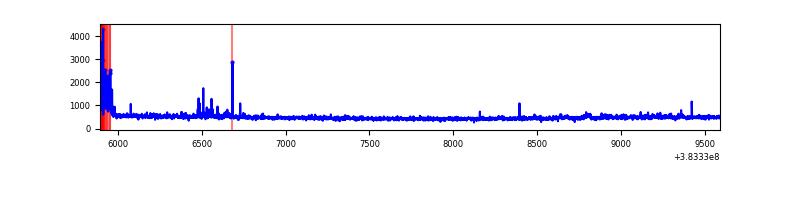 |
| D | 3694 | 3694 | 200 | 200 | 5.41% | 5.41% | 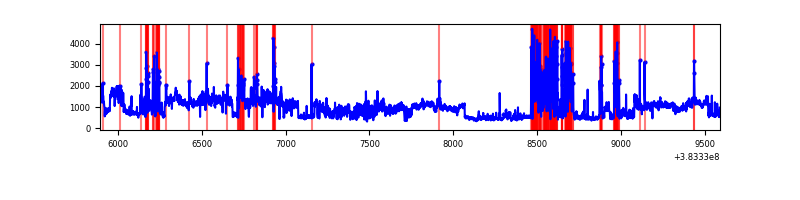 |
Top three noisy pixels from each quadrant. If the there are fewer than three noisy pixels in the level2.evt file, extra rows are filled as -1
| Pixel properties | Quadrant properties | ||||||
|---|---|---|---|---|---|---|---|
| Quadrant | DetID | PixID | Counts | Sigma | Mean | Median | Sigma |
| A | 10 | 83 | 25940 | 312.72 | 402 | 394 | 81.7 |
| A | 9 | 143 | 15030 | 179.17 | 402 | 394 | 81.7 |
| A | 13 | 254 | 7068 | 81.7 | 402 | 394 | 81.7 |
| B | 5 | 172 | 481576 | 6215.96 | 396 | 387 | 77.4 |
| B | 0 | 189 | 18353 | 232.08 | 396 | 387 | 77.4 |
| B | 0 | 190 | 16920 | 213.57 | 396 | 387 | 77.4 |
| C | 15 | 214 | 154323 | 1660.05 | 393 | 397 | 92.7 |
| C | 0 | 10 | 89748 | 963.63 | 393 | 397 | 92.7 |
| C | 14 | 67 | 35776 | 381.55 | 393 | 397 | 92.7 |
| D | 8 | 195 | 1594873 | 15586.32 | 378 | 370 | 102.3 |
| D | 2 | 250 | 551317 | 5385.53 | 378 | 370 | 102.3 |
| D | 13 | 249 | 89620 | 872.42 | 378 | 370 | 102.3 |
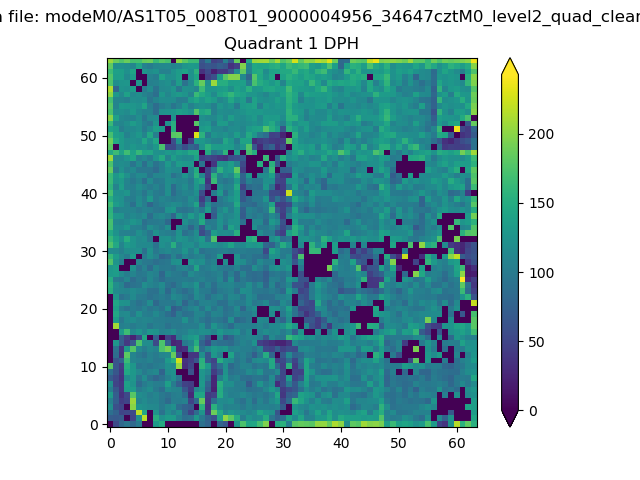
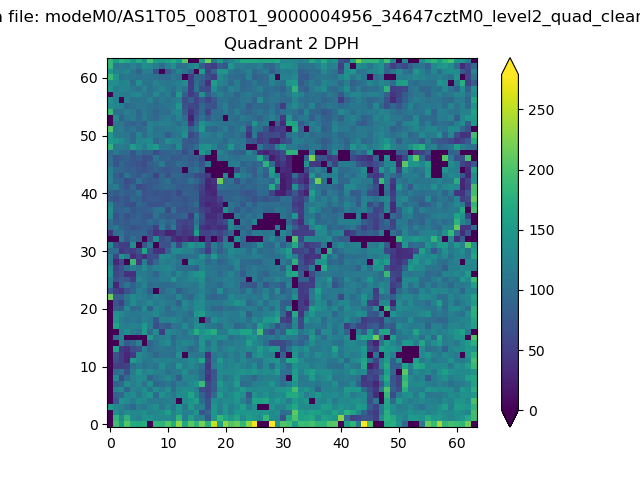
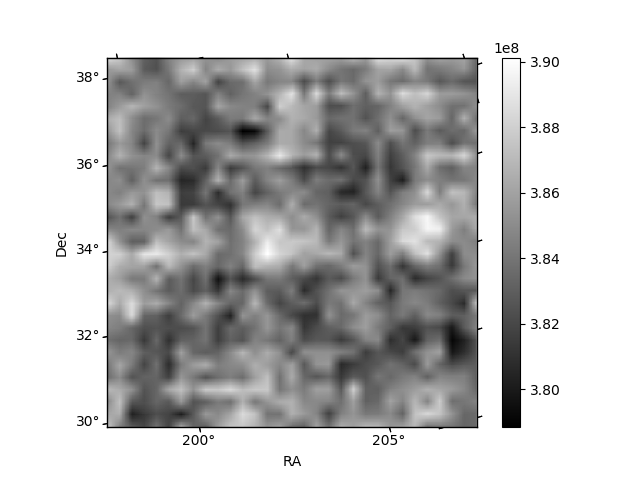
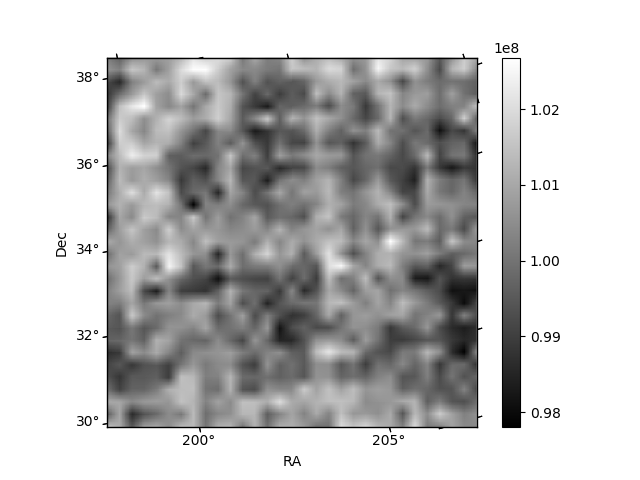
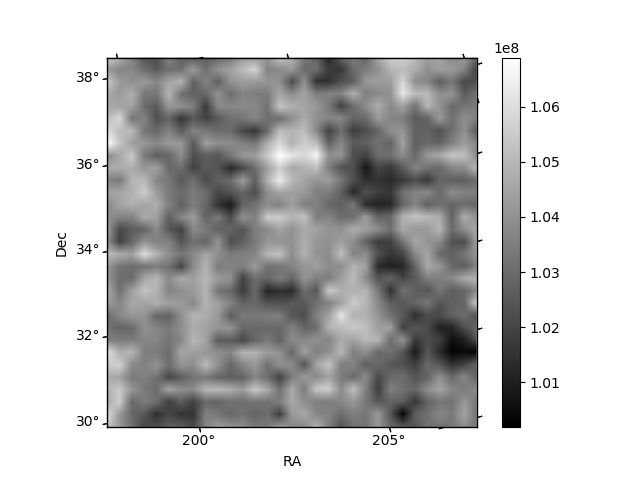
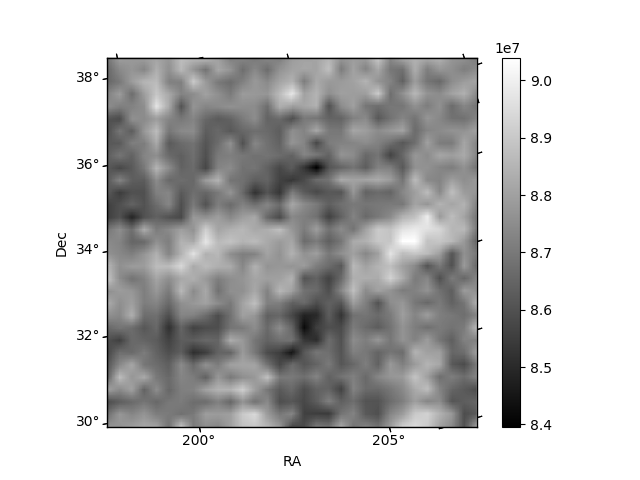
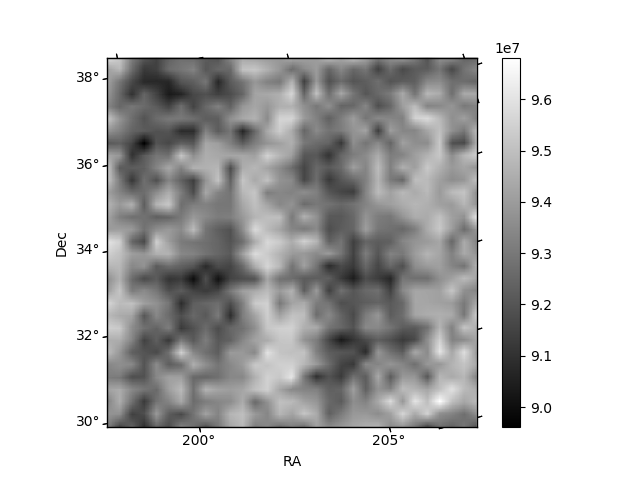
Histogram calculated using DETX and DETY for each event in the final _common_clean file
| Quadrant A | 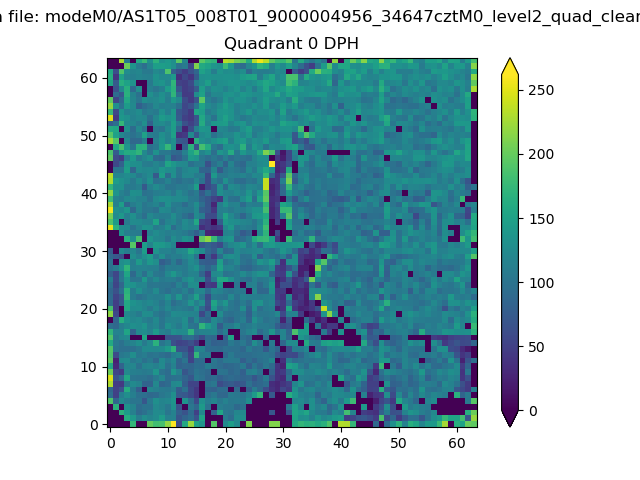 |
 |
Quadrant B |
|---|---|---|---|
| Quadrant D | 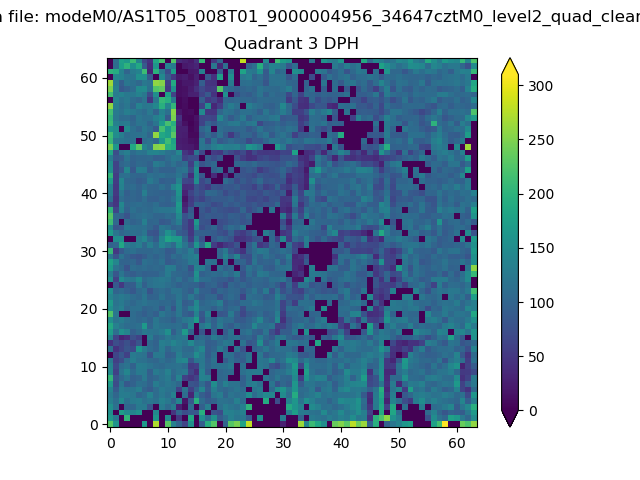 |
 |
Quadrant C |
| Plot type | Count rate plots | Images |
|---|---|---|
| Comparison with Poisson distribution Blue bars denote a histogram of data divided into 1 sec bins. Red curve is a Poisson curve with rate = median count rate of data. |
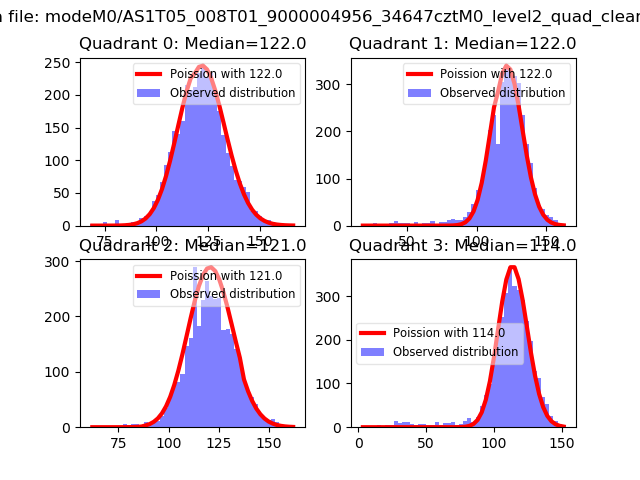 |
 |
| Quadrant-wise count rates Data is divided into 100 sec bins |
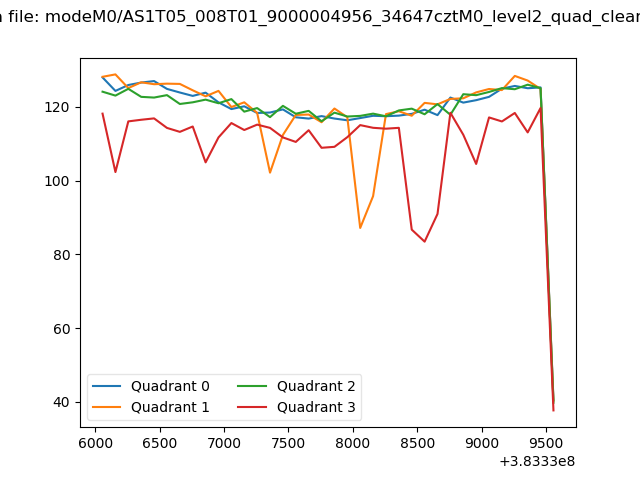 |
|
| Module-wise count rates for Quadrant A Data is divided into 100 sec bins |
 |
 |
| Module-wise count rates for Quadrant B Data is divided into 100 sec bins |
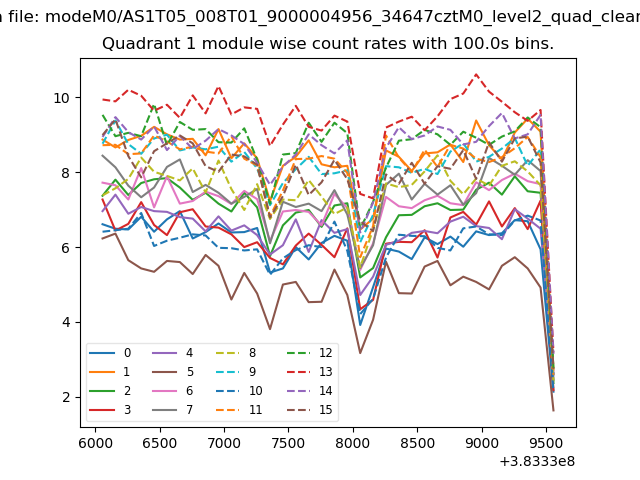 |
 |
| Module-wise count rates for Quadrant C Data is divided into 100 sec bins |
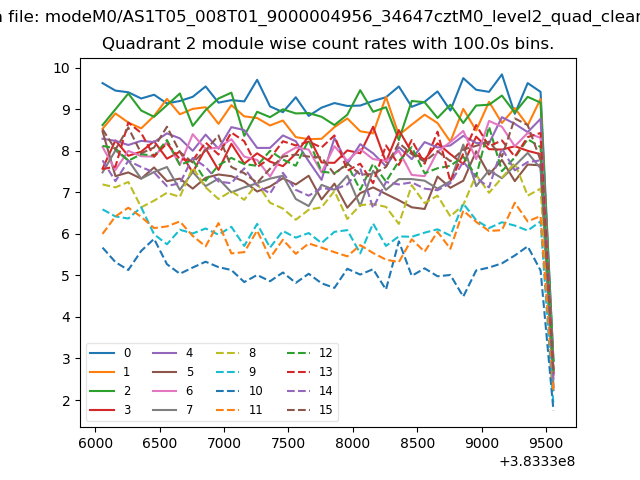 |
 |
| Module-wise count rates for Quadrant D Data is divided into 100 sec bins |
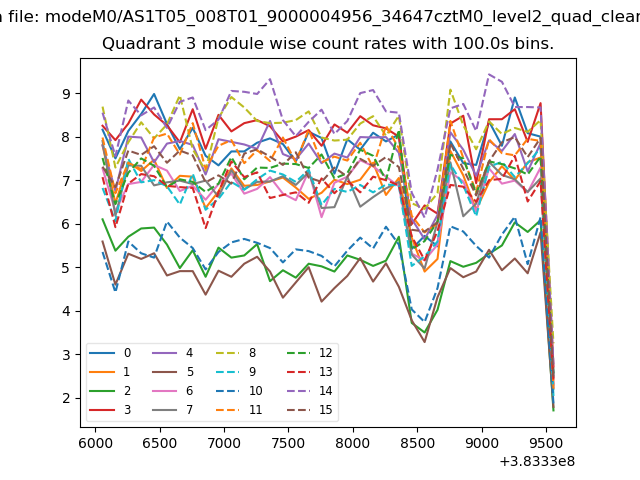 |
 |
| Parameter | Plot |
|---|---|
| CZT HV Monitor |  |
| D_VDD | 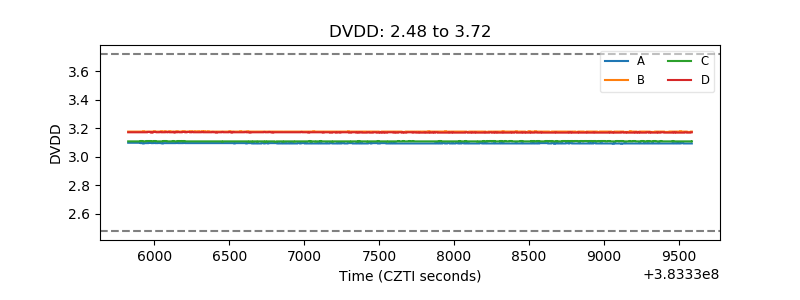 |
| Temperature 1 | 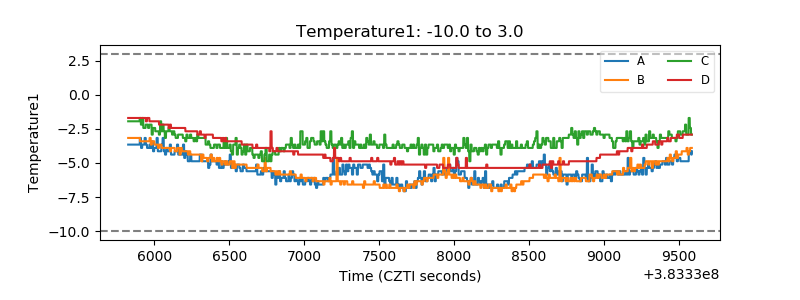 |
| Veto HV Monitor | 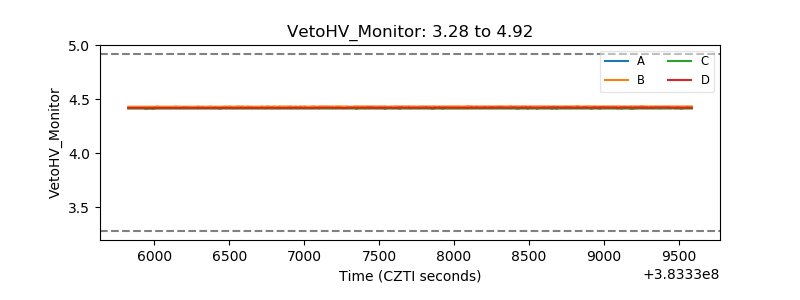 |
| Veto LLD | 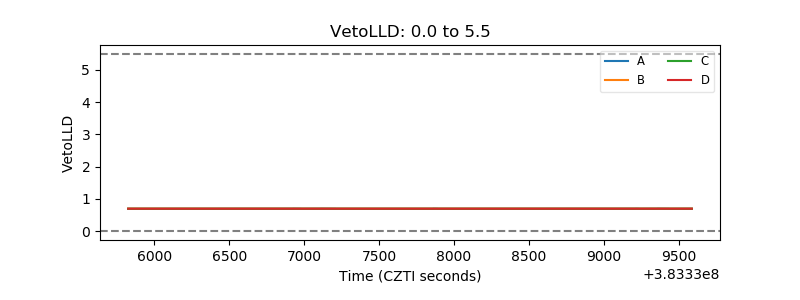 |
| Alpha Counter | 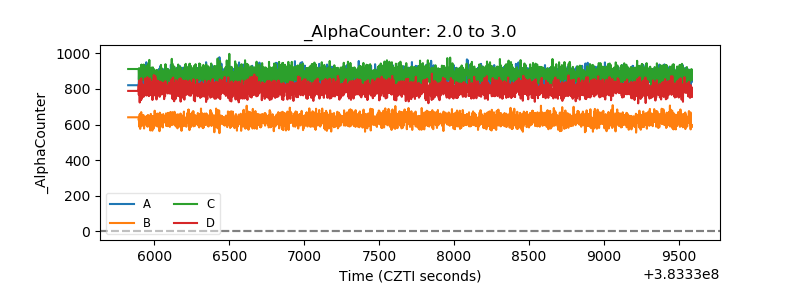 |
| _CPM_Rate |  |
| CZT Counter | 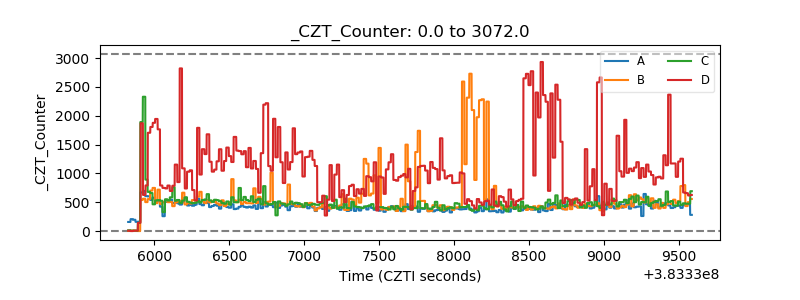 |
| +2.5 Volts monitor | 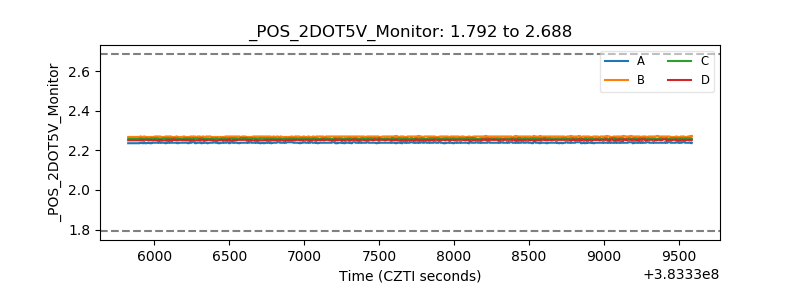 |
| +5 Volts monitor | 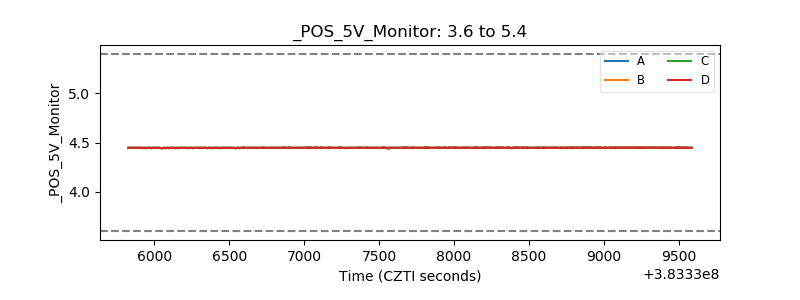 |
| _ROLL_ROT | 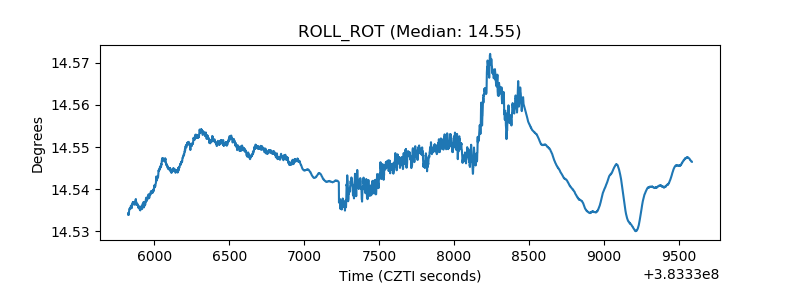 |
| _Roll_DEC | 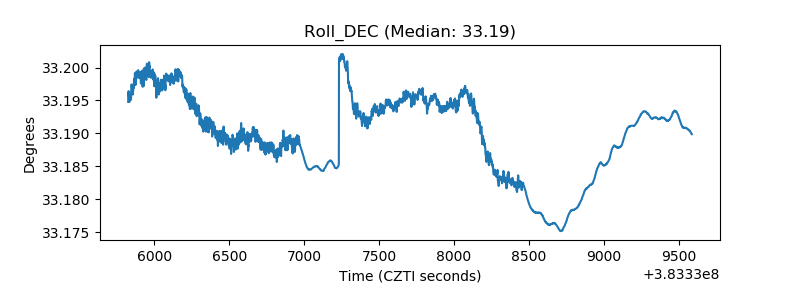 |
| _Roll_RA | 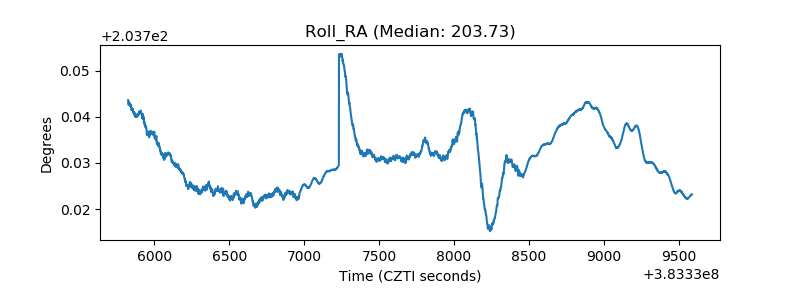 |
| Veto Counter | 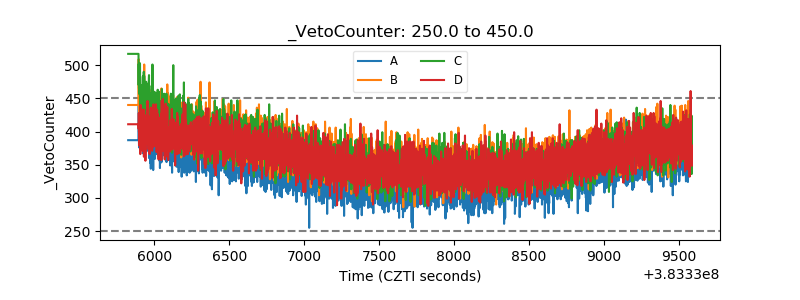 |