| Param | Original file | Final file |
|---|---|---|
| Filename | modeM0/AS1T05_008T01_9000004956_34643cztM0_level2.evt | modeM0/AS1T05_008T01_9000004956_34643cztM0_level2_quad_clean.evt |
| Size (bytes) | 585,123,840 | 65,401,920 |
| Size | 558.0 MB | 62.4 MB |
| Events in quadrant A | 2,560,818 | 411,680 |
| Events in quadrant B | 3,416,656 | 404,944 |
| Events in quadrant C | 2,847,077 | 407,413 |
| Events in quadrant D | 8,525,713 | 372,631 |
| Mode SS | |||
|---|---|---|---|
| Quadrant | BADHDUFLAG | Total packets | Discarded packets |
| A | 0 | 112 | 0 |
| B | 0 | 112 | 0 |
| C | 0 | 112 | 0 |
| D | 0 | 112 | 0 |
| Mode M9 | |||
|---|---|---|---|
| Quadrant | BADHDUFLAG | Total packets | Discarded packets |
| A | 0 | 28 | 0 |
| B | 0 | 28 | 0 |
| C | 0 | 28 | 0 |
| D | 0 | 29 | 0 |
| Mode M0 | |||
|---|---|---|---|
| Quadrant | BADHDUFLAG | Total packets | Discarded packets |
| A | 0 | 11189 | 3 |
| B | 0 | 13562 | 2 |
| C | 0 | 11593 | 2 |
| D | 0 | 29261 | 2 |
| Quadrant | Total seconds | Saturated seconds | Saturation percentage |
|---|---|---|---|
| A | 5478 | 9 | 0.164294% |
| B | 5478 | 204 | 3.723987% |
| C | 5478 | 52 | 0.949252% |
| D | 5478 | 882 | 16.100767% |
Noise dominated data is calculated using 1-second bins in cleaned event files. If a bin has >2000 counts, and if more than 50% of those come from <1% of pixels, then it is considered to be noise-dominated and hence unusable.
| Quadrant | # 1 sec bins | Bins with >0 counts | Bins with >2000 counts | High rate bins dominated by noise | Noise dominated (total time) | Noise dominated (detector-on time) | Marked lightcurve |
|---|---|---|---|---|---|---|---|
| A | 7090 | 5479 | 3 | 3 | 0.04% | 0.05% | 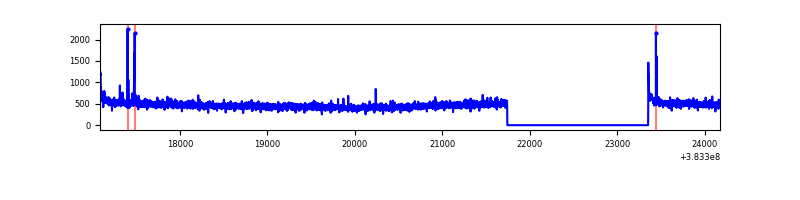 |
| B | 7090 | 5479 | 148 | 148 | 2.09% | 2.70% | 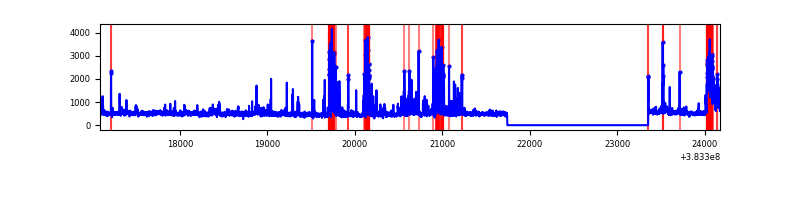 |
| C | 7090 | 5479 | 35 | 35 | 0.49% | 0.64% | 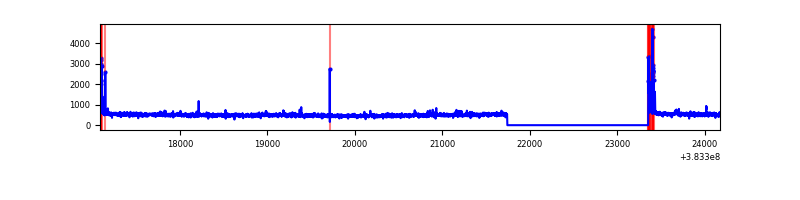 |
| D | 7090 | 5479 | 754 | 754 | 10.63% | 13.76% | 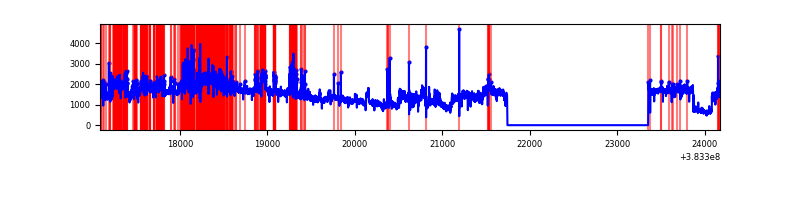 |
Top three noisy pixels from each quadrant. If the there are fewer than three noisy pixels in the level2.evt file, extra rows are filled as -1
| Pixel properties | Quadrant properties | ||||||
|---|---|---|---|---|---|---|---|
| Quadrant | DetID | PixID | Counts | Sigma | Mean | Median | Sigma |
| A | 10 | 83 | 48966 | 375.04 | 639 | 628 | 128.9 |
| A | 9 | 143 | 22717 | 171.38 | 639 | 628 | 128.9 |
| A | 13 | 6 | 12818 | 94.58 | 639 | 628 | 128.9 |
| B | 5 | 172 | 733105 | 6055.75 | 626 | 610 | 121.0 |
| B | 0 | 189 | 75451 | 618.73 | 626 | 610 | 121.0 |
| B | 0 | 190 | 28080 | 227.1 | 626 | 610 | 121.0 |
| C | 15 | 214 | 232283 | 1601.44 | 617 | 620 | 144.7 |
| C | 0 | 10 | 135853 | 934.84 | 617 | 620 | 144.7 |
| C | 14 | 67 | 28652 | 193.78 | 617 | 620 | 144.7 |
| D | 10 | 203 | 3716262 | 22903.95 | 596 | 584 | 162.2 |
| D | 8 | 195 | 1874037 | 11548.22 | 596 | 584 | 162.2 |
| D | 14 | 52 | 131203 | 805.15 | 596 | 584 | 162.2 |
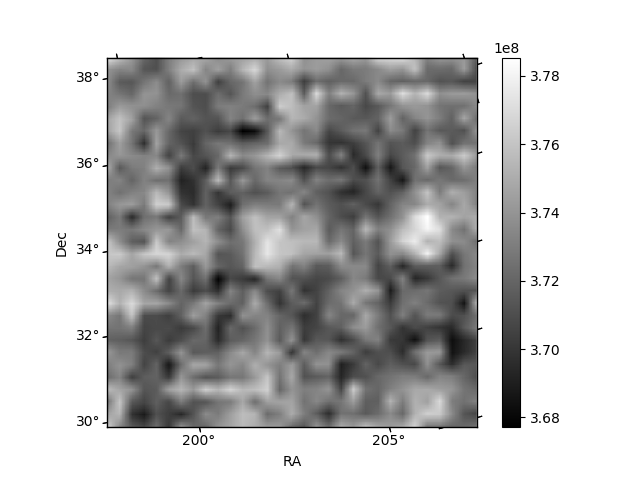
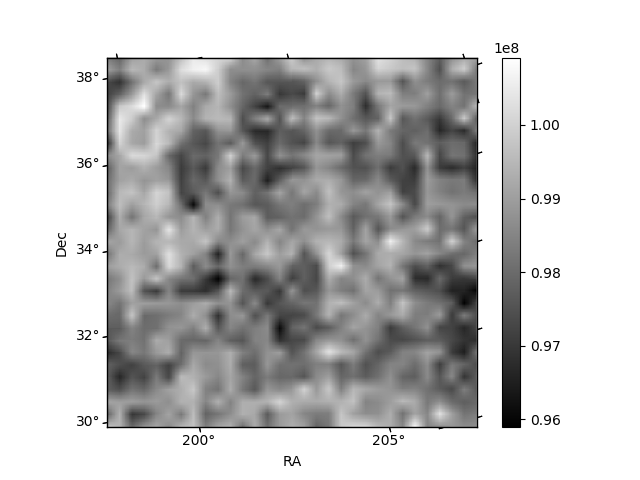
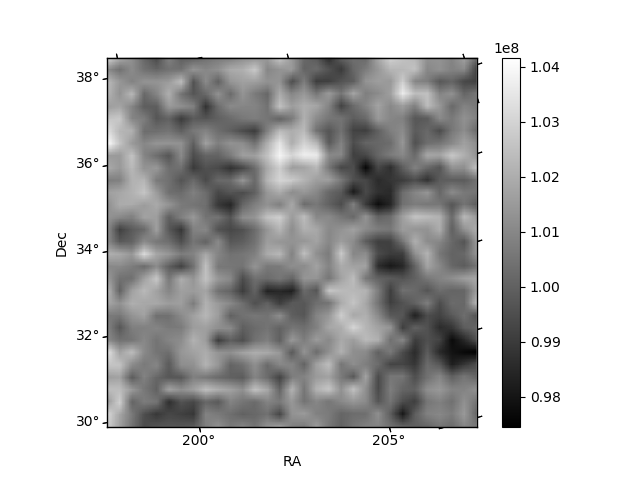
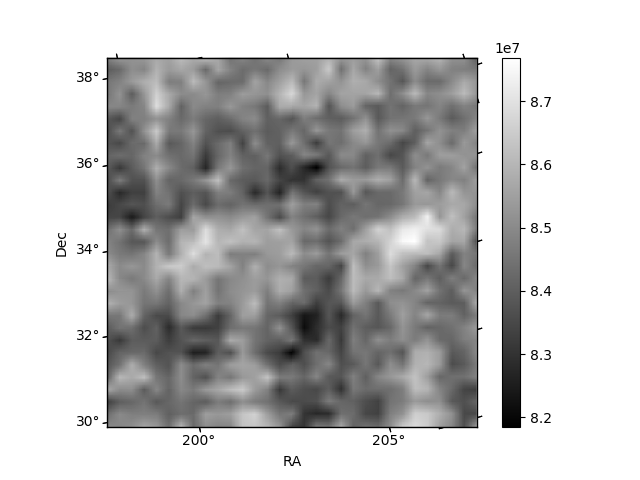
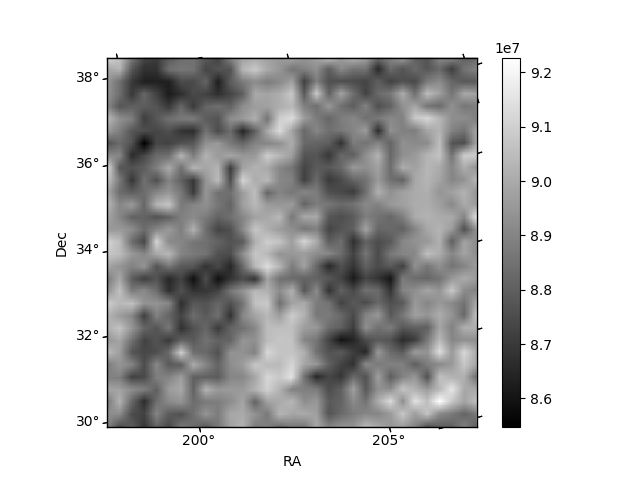
Histogram calculated using DETX and DETY for each event in the final _common_clean file
| Quadrant A | 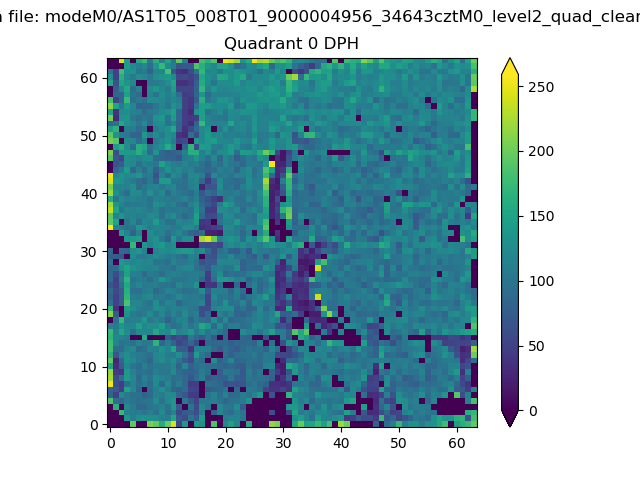 |
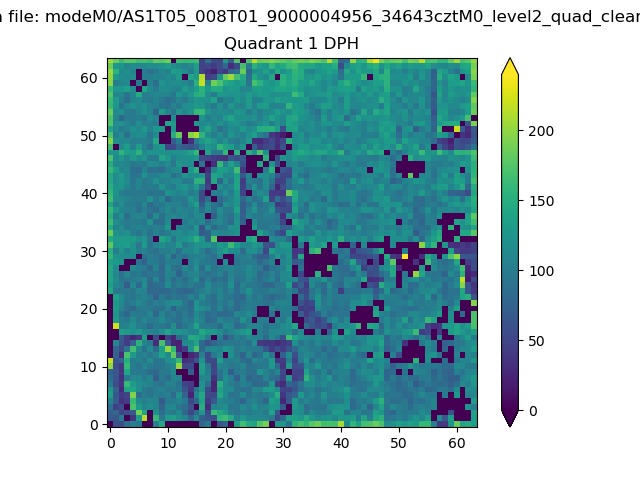 |
Quadrant B |
|---|---|---|---|
| Quadrant D | 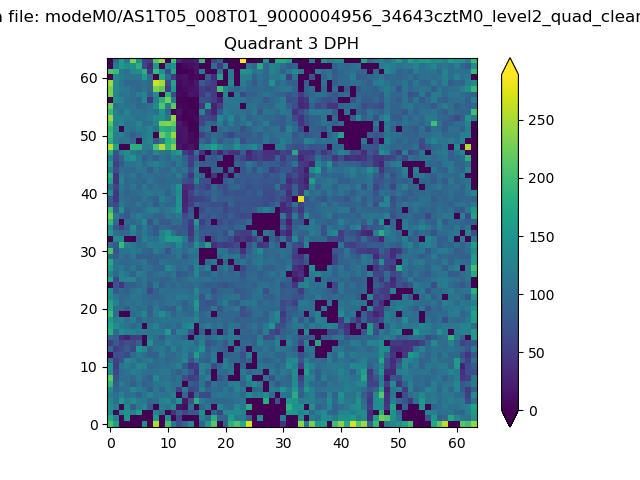 |
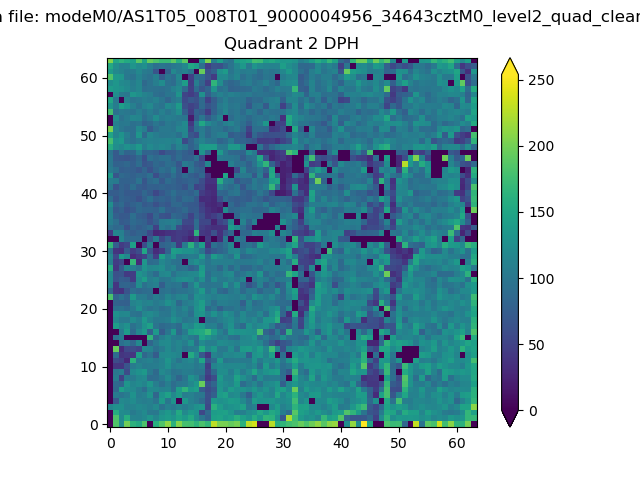 |
Quadrant C |
| Plot type | Count rate plots | Images |
|---|---|---|
| Comparison with Poisson distribution Blue bars denote a histogram of data divided into 1 sec bins. Red curve is a Poisson curve with rate = median count rate of data. |
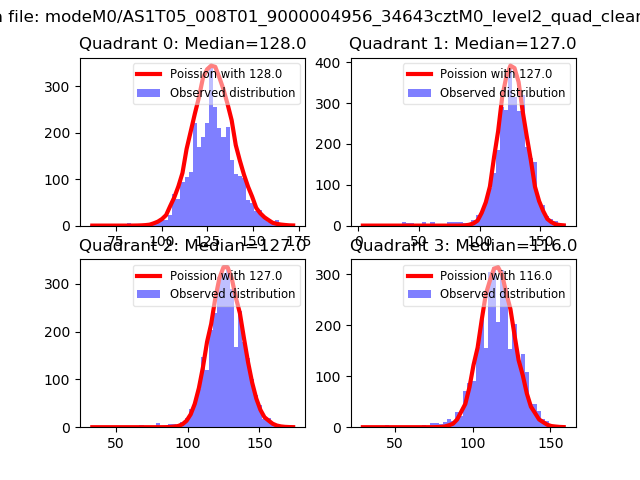 |
 |
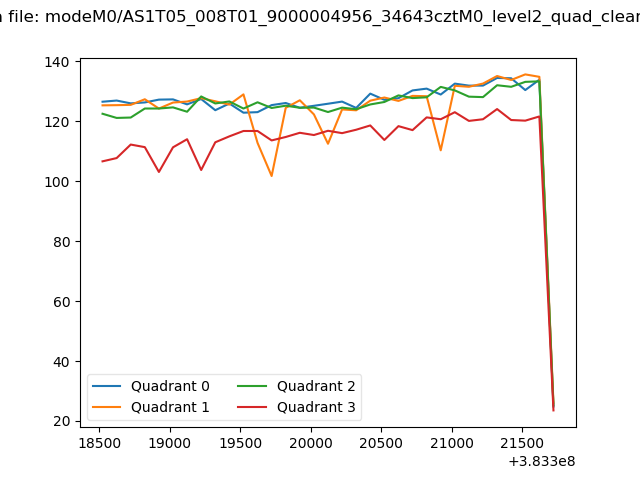
| Quadrant-wise count rates Data is divided into 100 sec bins |
 |
|
| Module-wise count rates for Quadrant A Data is divided into 100 sec bins |
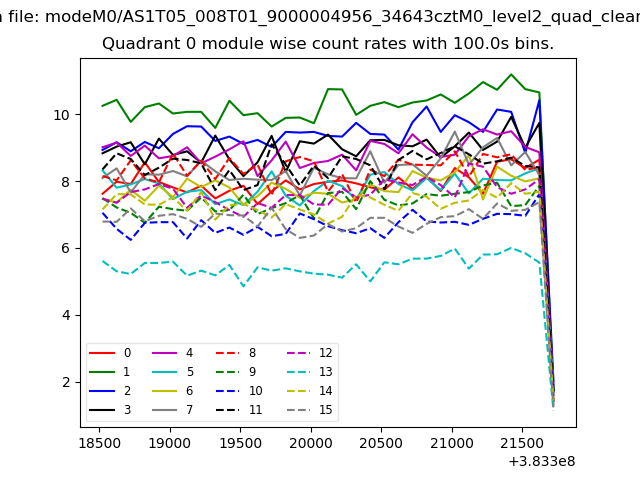 |
 |
| Module-wise count rates for Quadrant B Data is divided into 100 sec bins |
 |
 |
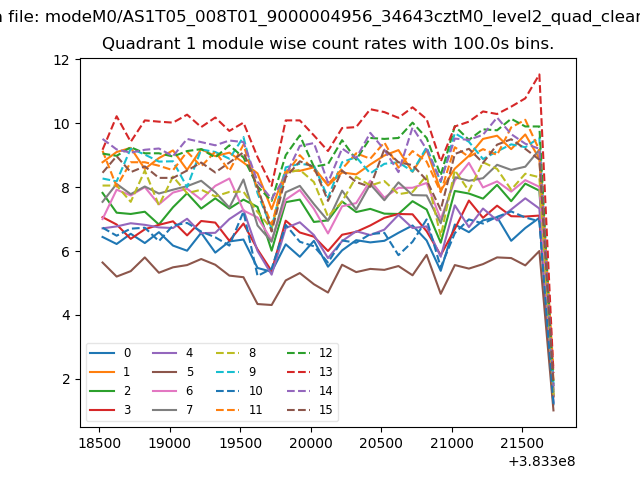
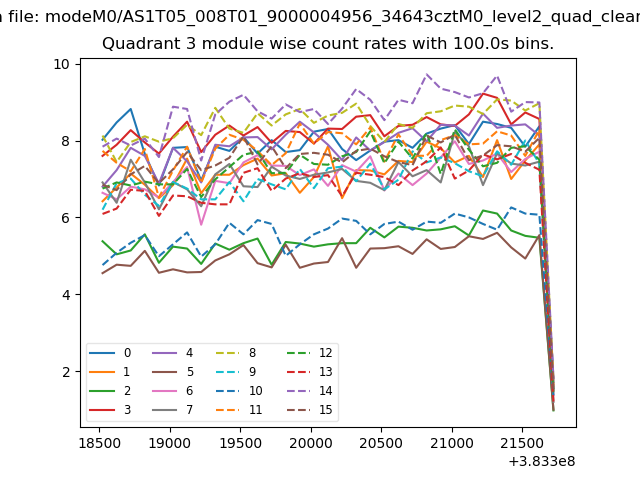
| Module-wise count rates for Quadrant C Data is divided into 100 sec bins |
 |
 |
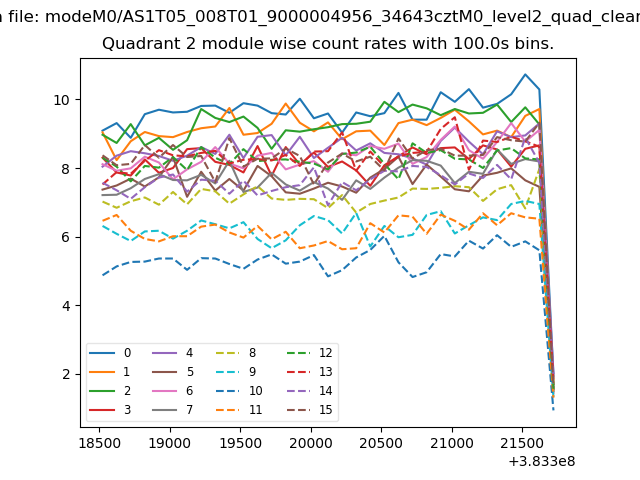
| Module-wise count rates for Quadrant D Data is divided into 100 sec bins |
 |
 |
| Parameter | Plot |
|---|---|
| CZT HV Monitor | 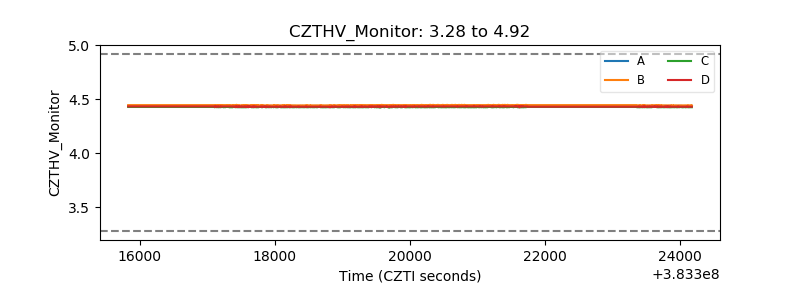 |
| D_VDD | 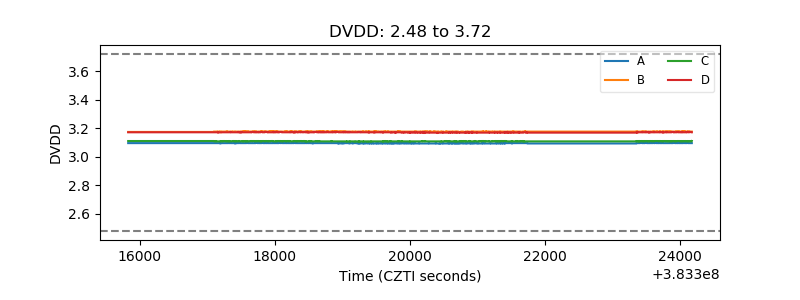 |
| Temperature 1 | 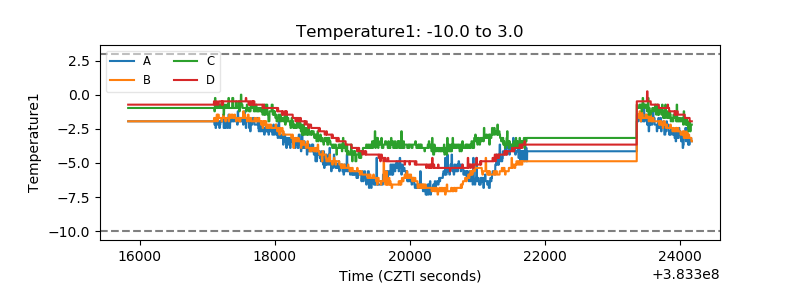 |
| Veto HV Monitor | 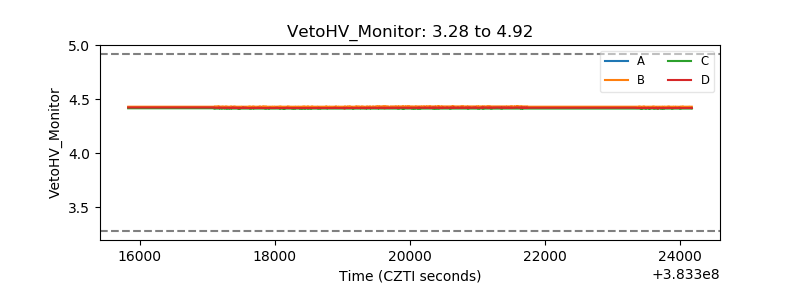 |
| Veto LLD | 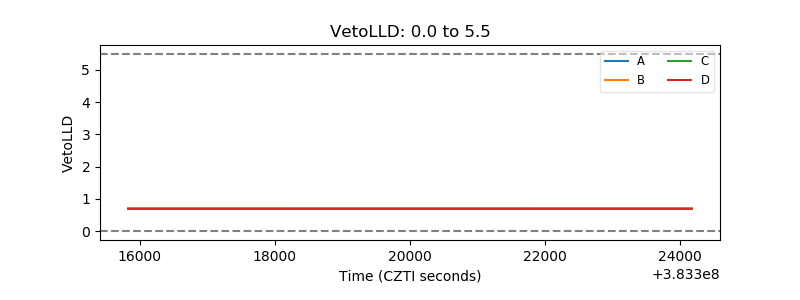 |
| Alpha Counter | 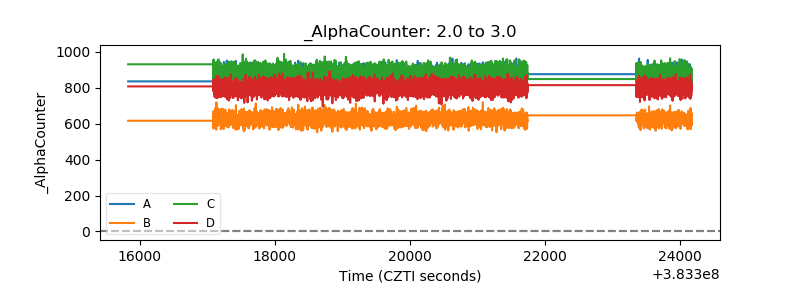 |
| _CPM_Rate | 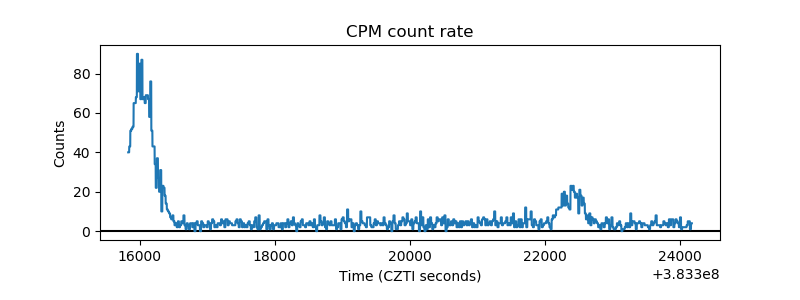 |
| CZT Counter | 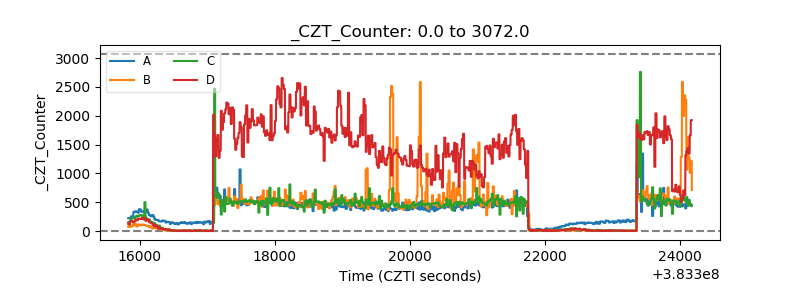 |
| +2.5 Volts monitor | 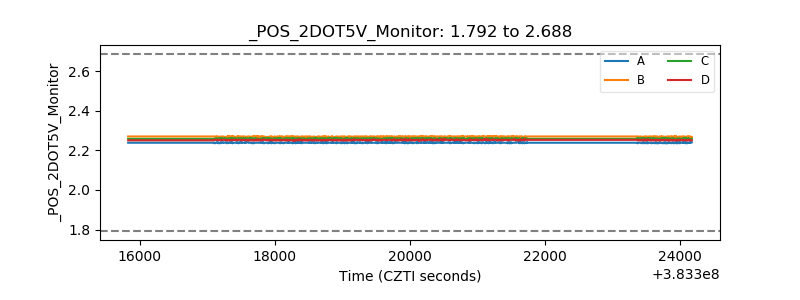 |
| +5 Volts monitor | 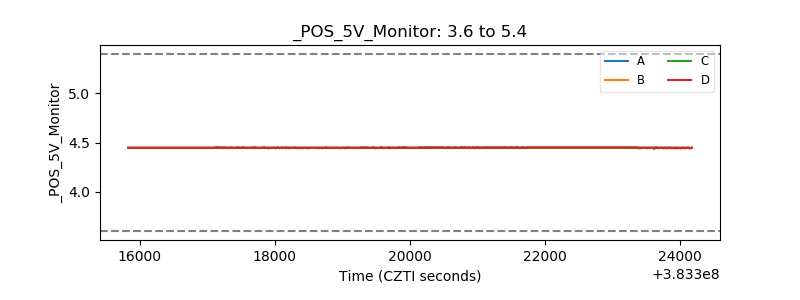 |
| _ROLL_ROT | 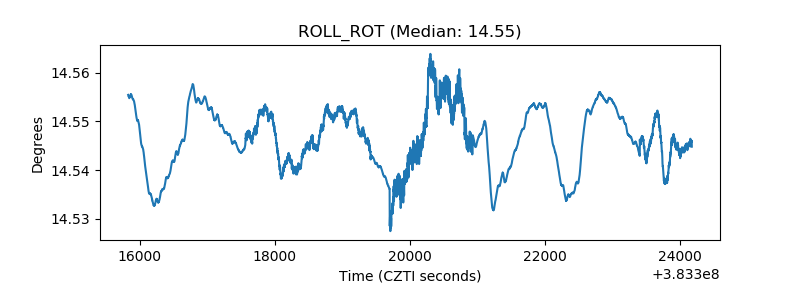 |
| _Roll_DEC | 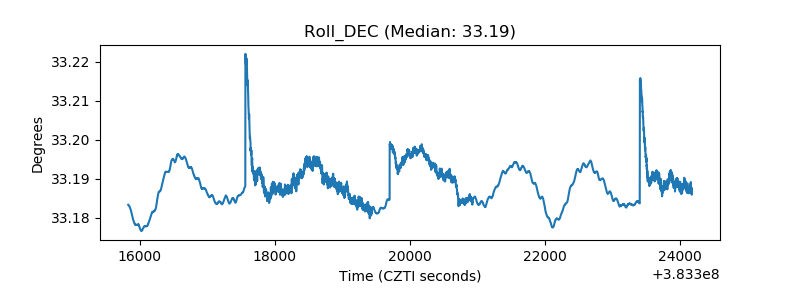 |
| _Roll_RA | 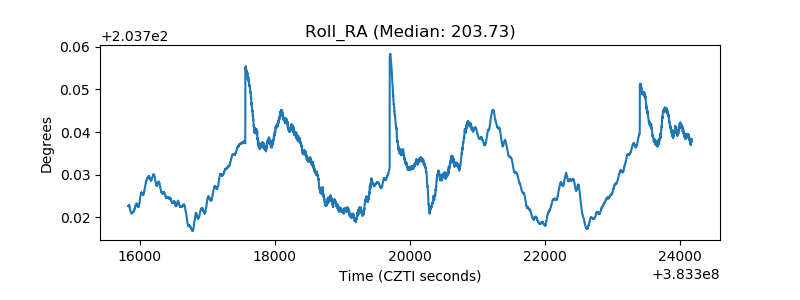 |
| Veto Counter | 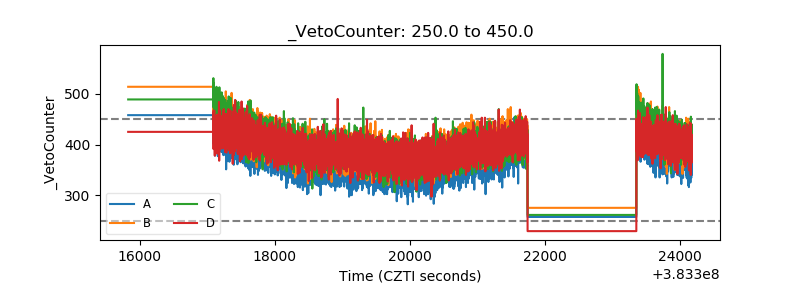 |