| Param | Original file | Final file |
|---|---|---|
| Filename | modeM0/AS1T05_008T01_9000004956_34642cztM0_level2.evt | modeM0/AS1T05_008T01_9000004956_34642cztM0_level2_quad_clean.evt |
| Size (bytes) | 487,048,320 | 54,311,040 |
| Size | 464.5 MB | 51.8 MB |
| Events in quadrant A | 2,559,756 | 324,971 |
| Events in quadrant B | 3,364,506 | 317,673 |
| Events in quadrant C | 2,770,416 | 321,410 |
| Events in quadrant D | 5,693,565 | 306,056 |
| Mode SS | |||
|---|---|---|---|
| Quadrant | BADHDUFLAG | Total packets | Discarded packets |
| A | 0 | 110 | 0 |
| B | 0 | 110 | 0 |
| C | 0 | 110 | 0 |
| D | 0 | 110 | 0 |
| Mode M9 | |||
|---|---|---|---|
| Quadrant | BADHDUFLAG | Total packets | Discarded packets |
| A | 0 | 31 | 0 |
| B | 0 | 31 | 0 |
| C | 0 | 31 | 0 |
| D | 0 | 32 | 0 |
| Mode M0 | |||
|---|---|---|---|
| Quadrant | BADHDUFLAG | Total packets | Discarded packets |
| A | 0 | 10942 | 3 |
| B | 0 | 13227 | 2 |
| C | 0 | 11148 | 2 |
| D | 0 | 20651 | 2 |
| Quadrant | Total seconds | Saturated seconds | Saturation percentage |
|---|---|---|---|
| A | 5338 | 14 | 0.262271% |
| B | 5338 | 189 | 3.540652% |
| C | 5338 | 37 | 0.693143% |
| D | 5338 | 413 | 7.736980% |
Noise dominated data is calculated using 1-second bins in cleaned event files. If a bin has >2000 counts, and if more than 50% of those come from <1% of pixels, then it is considered to be noise-dominated and hence unusable.
| Quadrant | # 1 sec bins | Bins with >0 counts | Bins with >2000 counts | High rate bins dominated by noise | Noise dominated (total time) | Noise dominated (detector-on time) | Marked lightcurve |
|---|---|---|---|---|---|---|---|
| A | 7281 | 5339 | 3 | 3 | 0.04% | 0.06% | 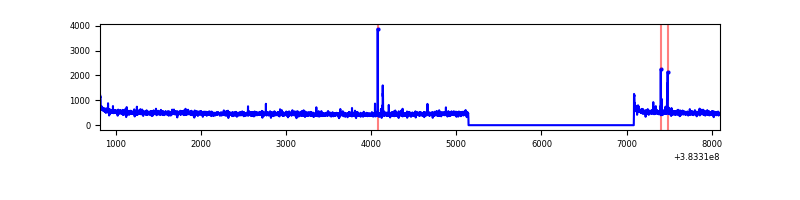 |
| B | 7281 | 5339 | 121 | 121 | 1.66% | 2.27% | 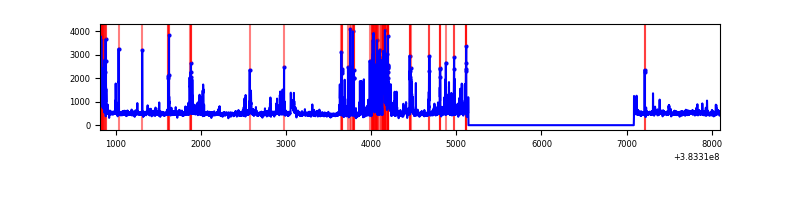 |
| C | 7281 | 5339 | 19 | 19 | 0.26% | 0.36% | 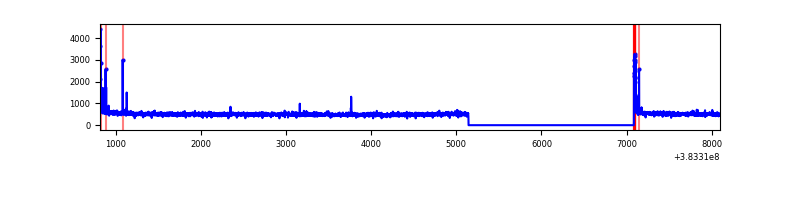 |
| D | 7281 | 5339 | 332 | 332 | 4.56% | 6.22% | 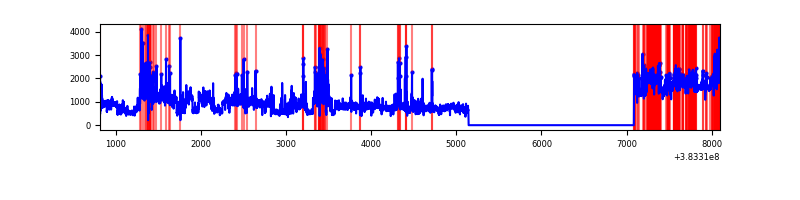 |
Top three noisy pixels from each quadrant. If the there are fewer than three noisy pixels in the level2.evt file, extra rows are filled as -1
| Pixel properties | Quadrant properties | ||||||
|---|---|---|---|---|---|---|---|
| Quadrant | DetID | PixID | Counts | Sigma | Mean | Median | Sigma |
| A | 10 | 83 | 47840 | 366.35 | 639 | 627 | 128.9 |
| A | 9 | 143 | 30208 | 229.54 | 639 | 627 | 128.9 |
| A | 13 | 254 | 9993 | 72.68 | 639 | 627 | 128.9 |
| B | 5 | 172 | 758584 | 6384.9 | 623 | 608 | 118.7 |
| B | 0 | 189 | 51412 | 427.95 | 623 | 608 | 118.7 |
| B | 4 | 173 | 32182 | 265.97 | 623 | 608 | 118.7 |
| C | 15 | 214 | 226463 | 1589.49 | 616 | 620 | 142.1 |
| C | 0 | 10 | 95469 | 667.55 | 616 | 620 | 142.1 |
| C | 14 | 67 | 21296 | 145.52 | 616 | 620 | 142.1 |
| D | 8 | 195 | 1857972 | 11333.41 | 606 | 594 | 163.9 |
| D | 10 | 203 | 869822 | 5303.88 | 606 | 594 | 163.9 |
| D | 2 | 250 | 108287 | 657.12 | 606 | 594 | 163.9 |
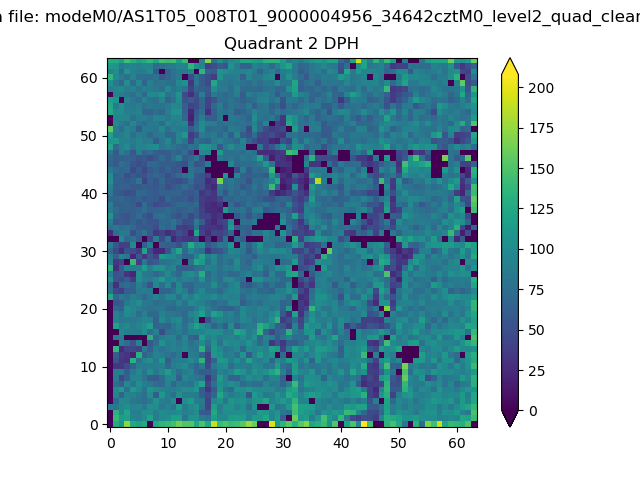
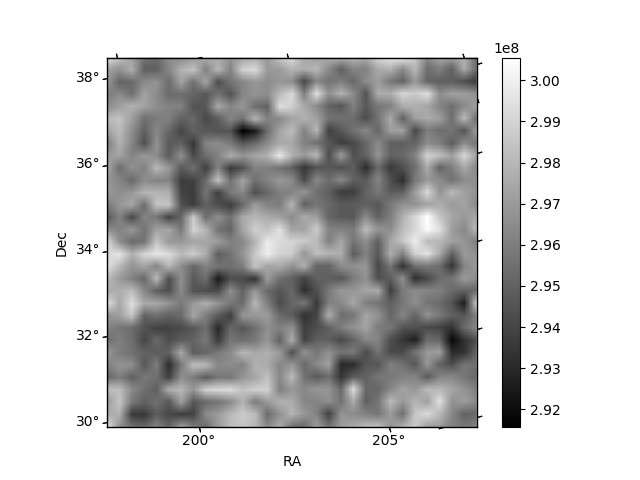
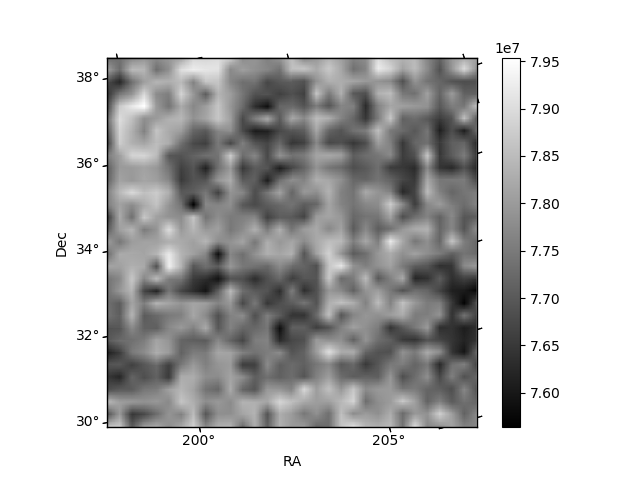
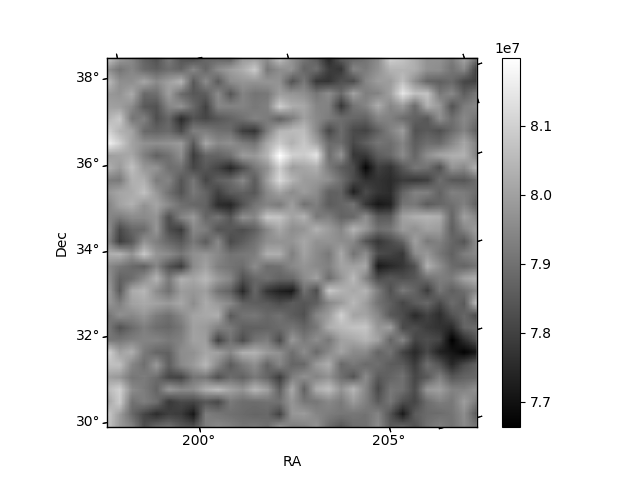
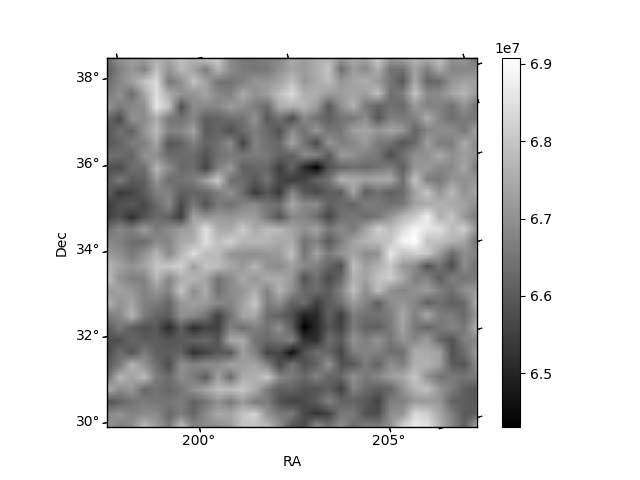
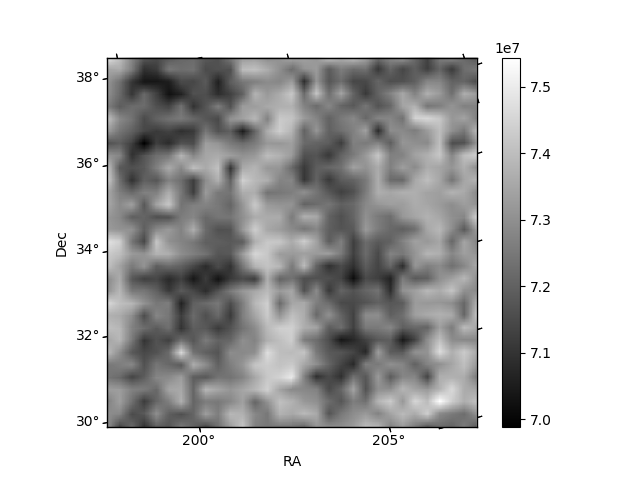
Histogram calculated using DETX and DETY for each event in the final _common_clean file
| Quadrant A | 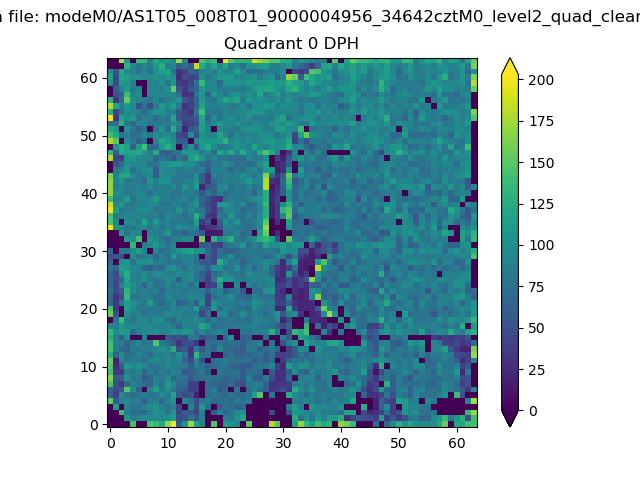 |
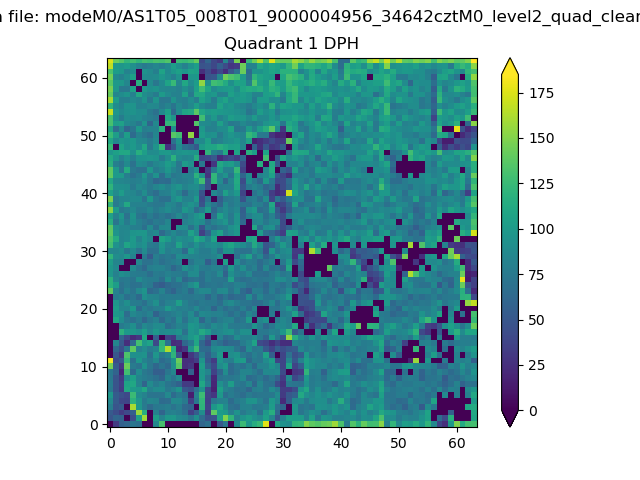 |
Quadrant B |
|---|---|---|---|
| Quadrant D | 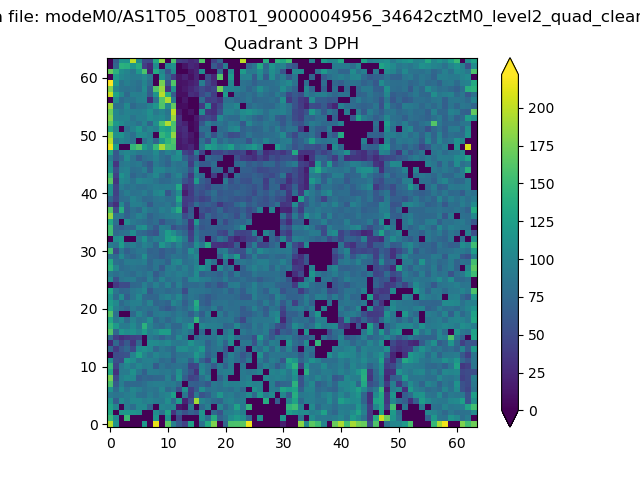 |
 |
Quadrant C |
| Plot type | Count rate plots | Images |
|---|---|---|
| Comparison with Poisson distribution Blue bars denote a histogram of data divided into 1 sec bins. Red curve is a Poisson curve with rate = median count rate of data. |
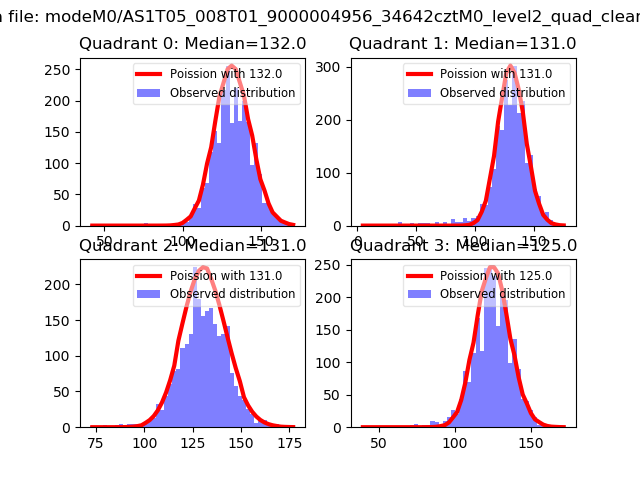 |
 |
| Quadrant-wise count rates Data is divided into 100 sec bins |
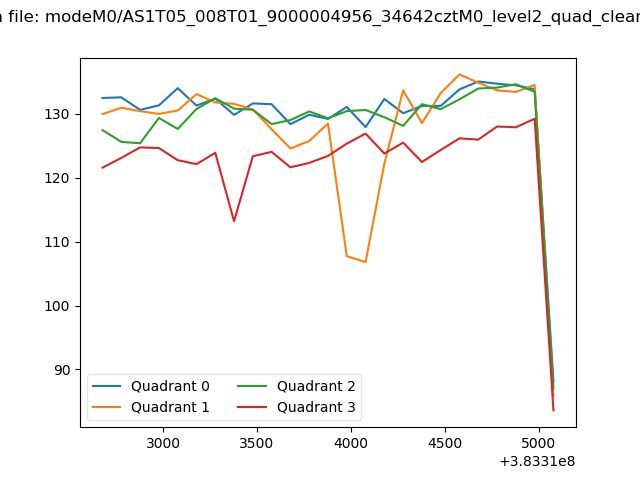 |
|
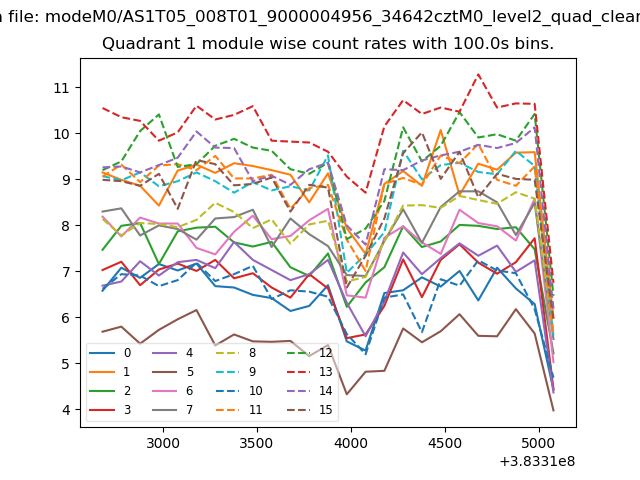
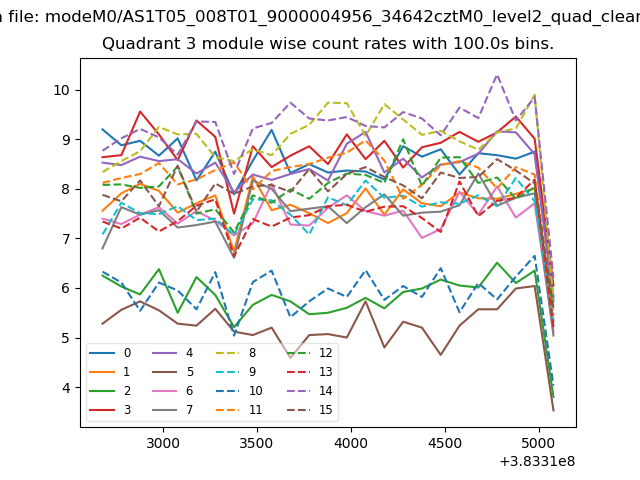
| Module-wise count rates for Quadrant A Data is divided into 100 sec bins |
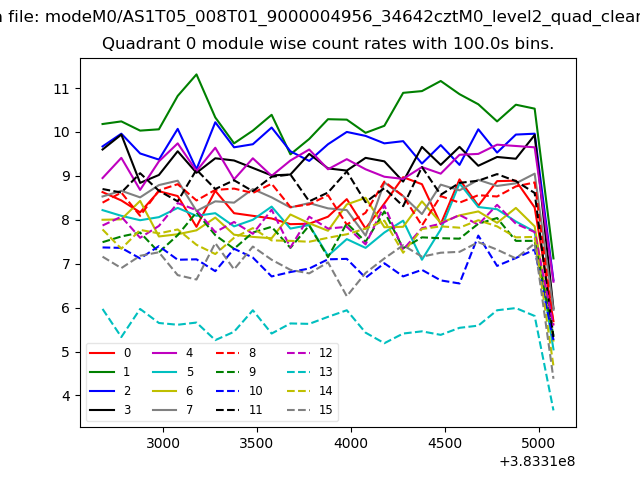 |
 |
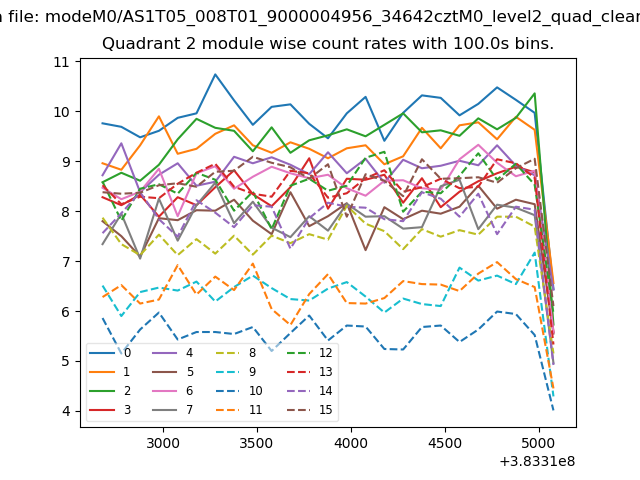
| Module-wise count rates for Quadrant B Data is divided into 100 sec bins |
 |
 |
| Module-wise count rates for Quadrant C Data is divided into 100 sec bins |
 |
 |
| Module-wise count rates for Quadrant D Data is divided into 100 sec bins |
 |
 |
| Parameter | Plot |
|---|---|
| CZT HV Monitor | 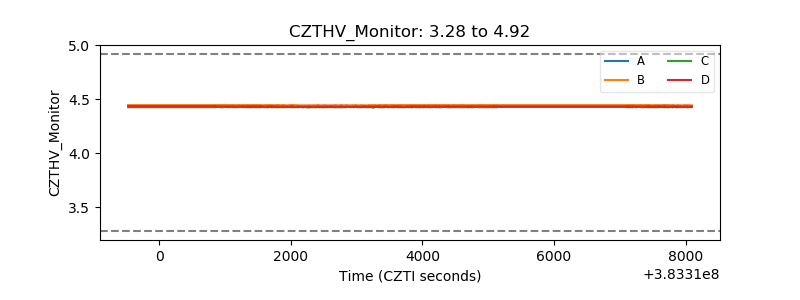 |
| D_VDD | 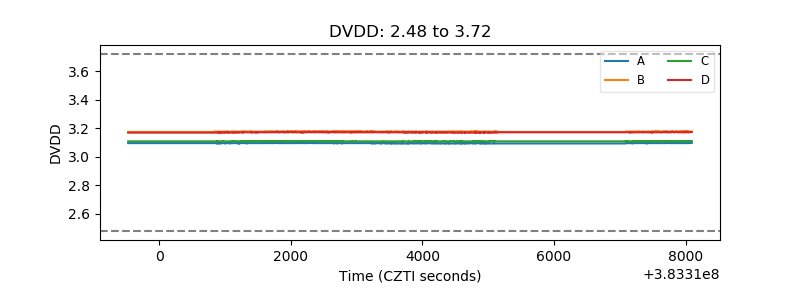 |
| Temperature 1 | 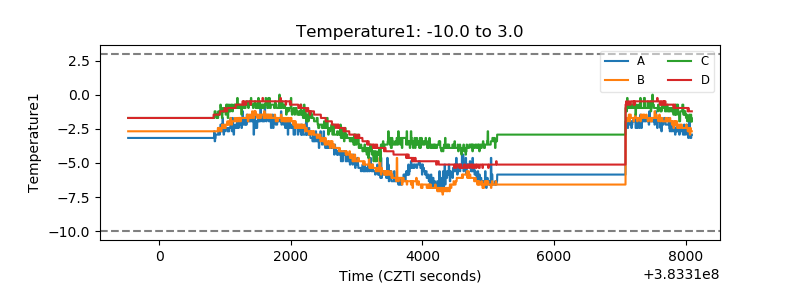 |
| Veto HV Monitor | 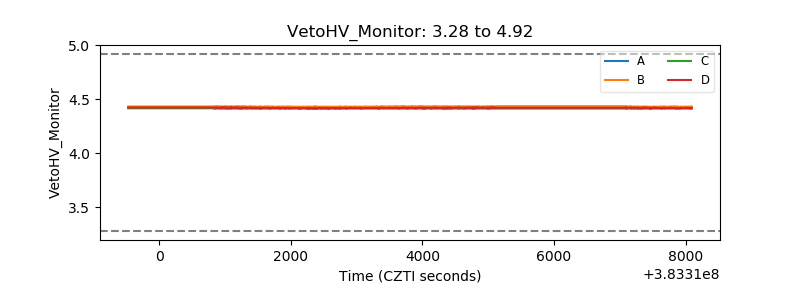 |
| Veto LLD | 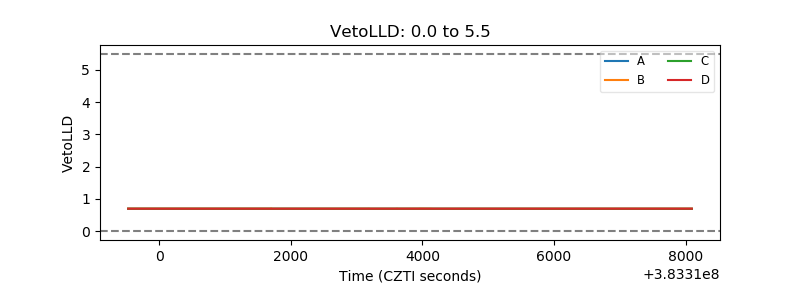 |
| Alpha Counter | 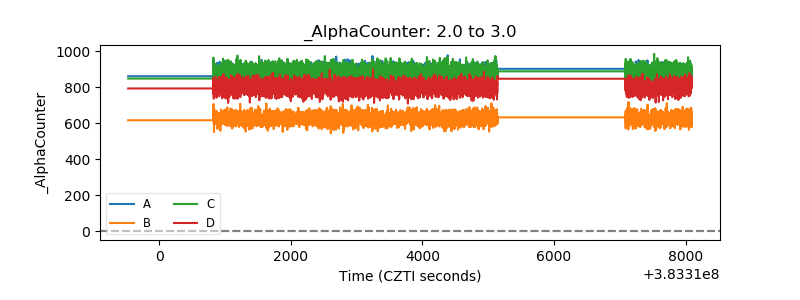 |
| _CPM_Rate | 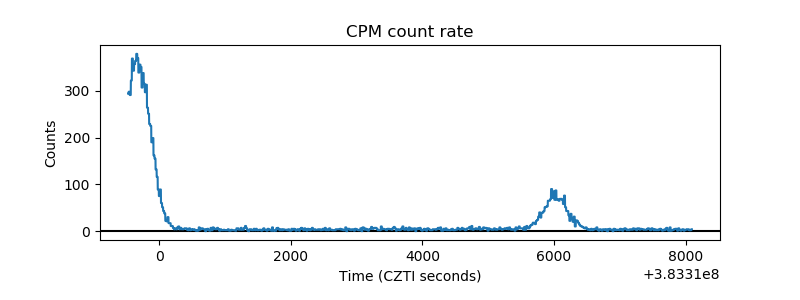 |
| CZT Counter | 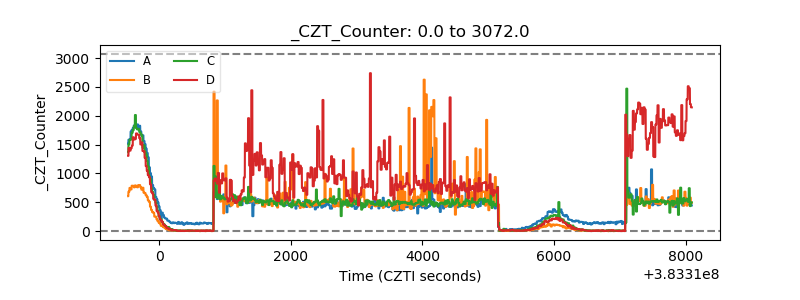 |
| +2.5 Volts monitor | 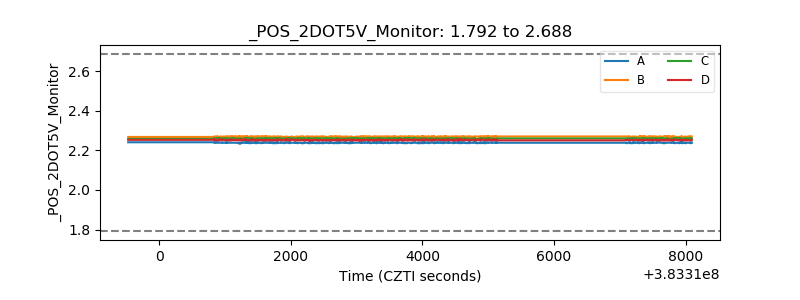 |
| +5 Volts monitor | 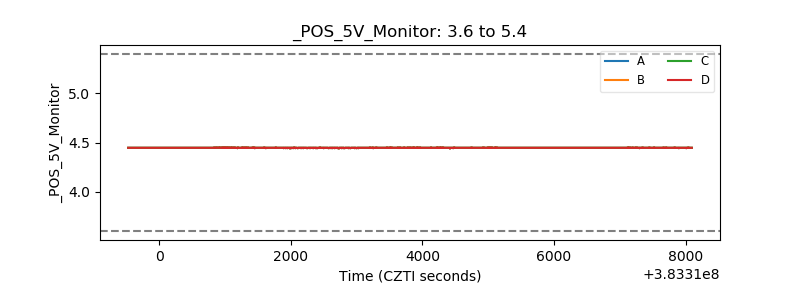 |
| _ROLL_ROT | 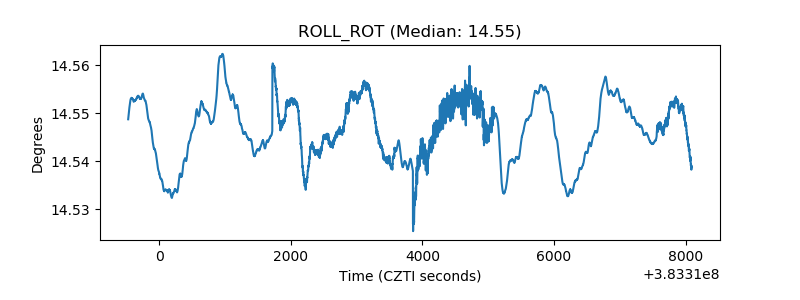 |
| _Roll_DEC | 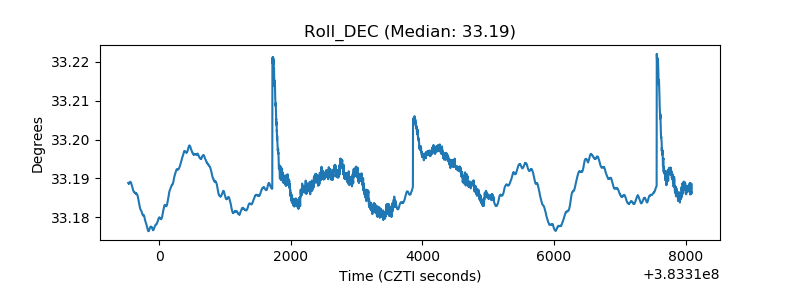 |
| _Roll_RA | 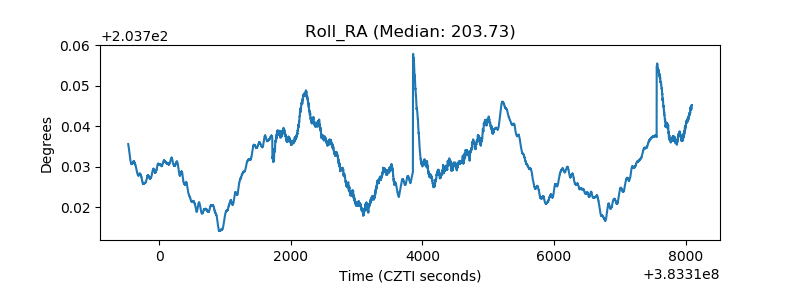 |
| Veto Counter | 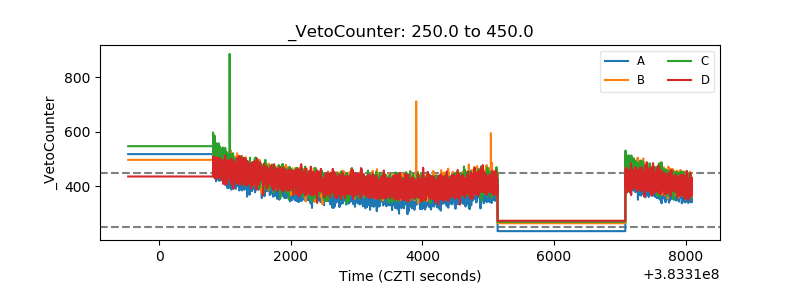 |