| Param | Original file | Final file |
|---|---|---|
| Filename | modeM0/AS1T05_008T01_9000004956_34640cztM0_level2.evt | modeM0/AS1T05_008T01_9000004956_34640cztM0_level2_quad_clean.evt |
| Size (bytes) | 433,272,960 | 53,023,680 |
| Size | 413.2 MB | 50.6 MB |
| Events in quadrant A | 2,503,485 | 330,882 |
| Events in quadrant B | 3,570,588 | 313,375 |
| Events in quadrant C | 3,013,336 | 315,008 |
| Events in quadrant D | 3,707,208 | 307,408 |
| Mode SS | |||
|---|---|---|---|
| Quadrant | BADHDUFLAG | Total packets | Discarded packets |
| A | 0 | 98 | 0 |
| B | 0 | 98 | 0 |
| C | 0 | 98 | 0 |
| D | 0 | 98 | 0 |
| Mode M9 | |||
|---|---|---|---|
| Quadrant | BADHDUFLAG | Total packets | Discarded packets |
| A | 0 | 22 | 0 |
| B | 0 | 22 | 0 |
| C | 0 | 22 | 0 |
| D | 0 | 23 | 0 |
| Mode M0 | |||
|---|---|---|---|
| Quadrant | BADHDUFLAG | Total packets | Discarded packets |
| A | 0 | 10080 | 3 |
| B | 0 | 13522 | 2 |
| C | 0 | 11658 | 2 |
| D | 0 | 14215 | 2 |
| Quadrant | Total seconds | Saturated seconds | Saturation percentage |
|---|---|---|---|
| A | 4823 | 8 | 0.165872% |
| B | 4823 | 351 | 7.277628% |
| C | 4823 | 98 | 2.031930% |
| D | 4823 | 61 | 1.264773% |
Noise dominated data is calculated using 1-second bins in cleaned event files. If a bin has >2000 counts, and if more than 50% of those come from <1% of pixels, then it is considered to be noise-dominated and hence unusable.
| Quadrant | # 1 sec bins | Bins with >0 counts | Bins with >2000 counts | High rate bins dominated by noise | Noise dominated (total time) | Noise dominated (detector-on time) | Marked lightcurve |
|---|---|---|---|---|---|---|---|
| A | 6975 | 4824 | 3 | 3 | 0.04% | 0.06% | 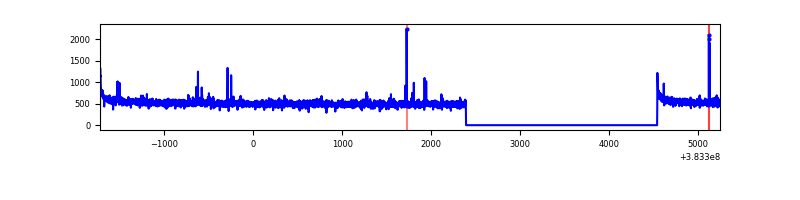 |
| B | 6975 | 4824 | 242 | 242 | 3.47% | 5.02% | 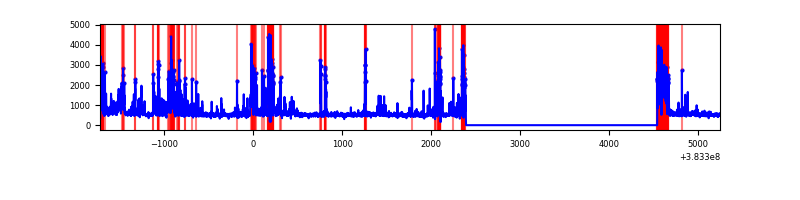 |
| C | 6975 | 4824 | 72 | 72 | 1.03% | 1.49% | 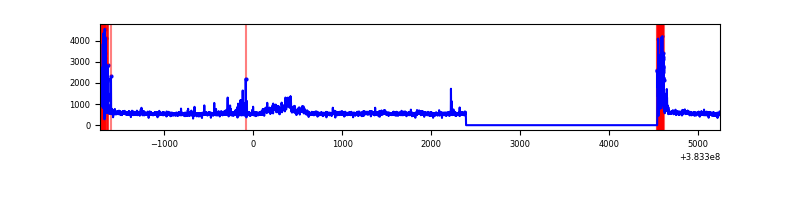 |
| D | 6975 | 4824 | 47 | 47 | 0.67% | 0.97% | 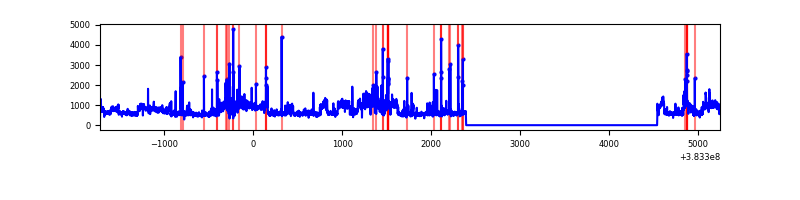 |
Top three noisy pixels from each quadrant. If the there are fewer than three noisy pixels in the level2.evt file, extra rows are filled as -1
| Pixel properties | Quadrant properties | ||||||
|---|---|---|---|---|---|---|---|
| Quadrant | DetID | PixID | Counts | Sigma | Mean | Median | Sigma |
| A | 10 | 83 | 45290 | 358.97 | 624 | 613 | 124.5 |
| A | 15 | 174 | 19961 | 155.46 | 624 | 613 | 124.5 |
| A | 9 | 143 | 12778 | 97.74 | 624 | 613 | 124.5 |
| B | 5 | 172 | 1106905 | 9906.29 | 592 | 580 | 111.7 |
| B | 4 | 141 | 35142 | 309.48 | 592 | 580 | 111.7 |
| B | 4 | 173 | 25507 | 223.2 | 592 | 580 | 111.7 |
| C | 0 | 10 | 258780 | 1908.07 | 587 | 590 | 135.3 |
| C | 15 | 214 | 204010 | 1503.31 | 587 | 590 | 135.3 |
| C | 3 | 233 | 161851 | 1191.75 | 587 | 590 | 135.3 |
| D | 8 | 195 | 969190 | 6560.93 | 600 | 583 | 147.6 |
| D | 10 | 199 | 58216 | 390.38 | 600 | 583 | 147.6 |
| D | 2 | 250 | 51867 | 347.38 | 600 | 583 | 147.6 |
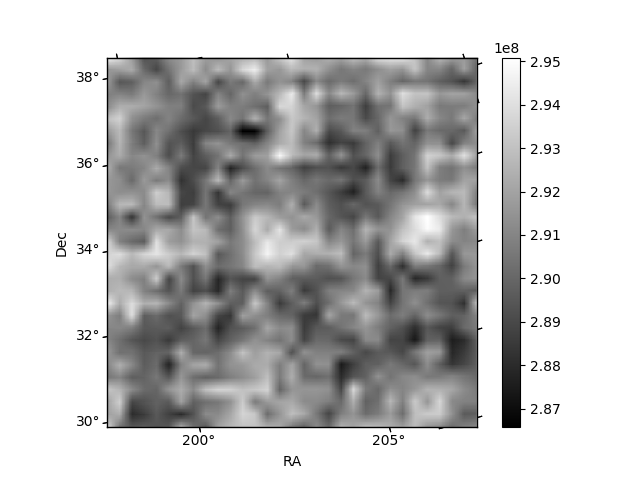
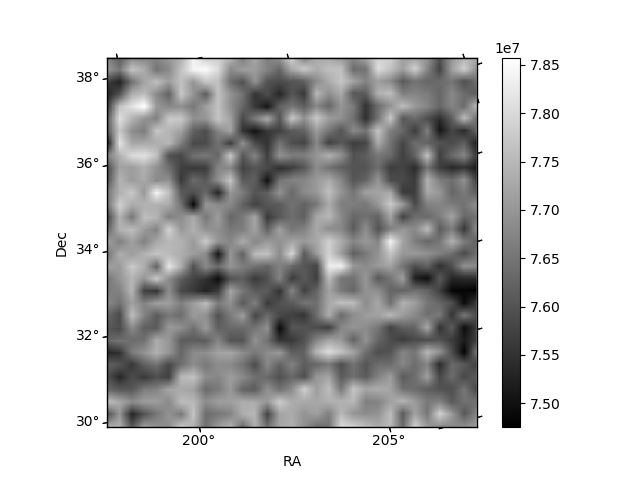
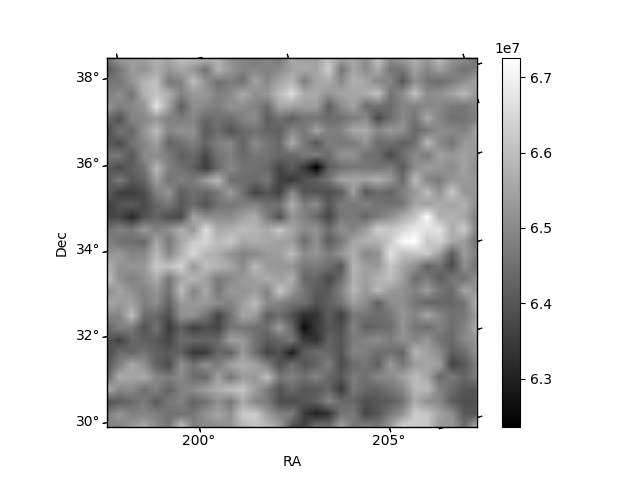
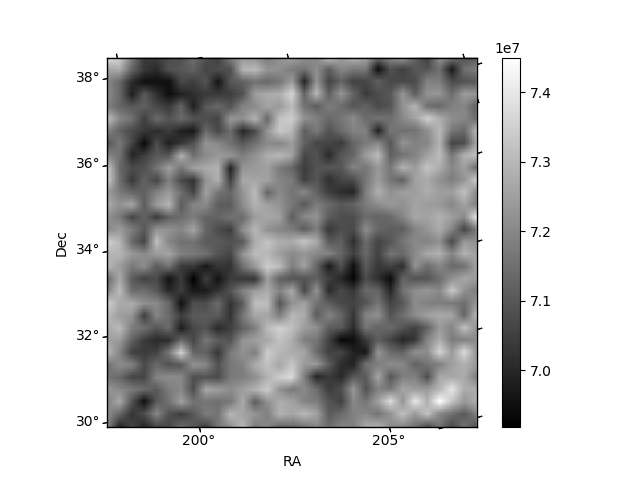
Histogram calculated using DETX and DETY for each event in the final _common_clean file
| Quadrant A | 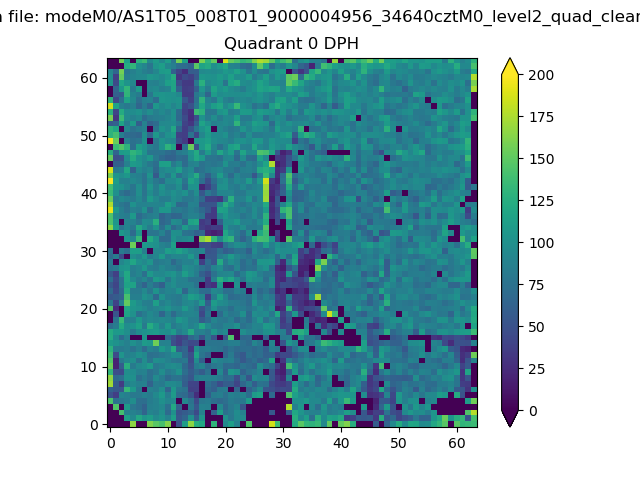 |
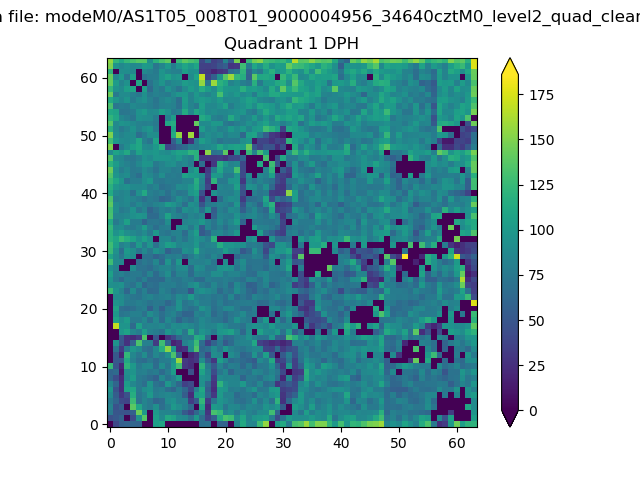 |
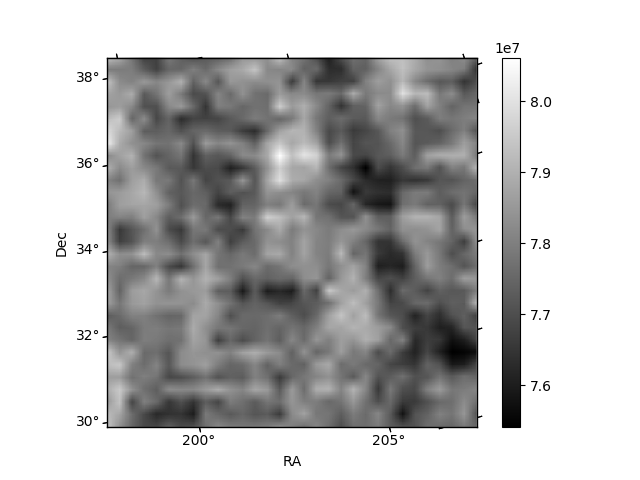
Quadrant B |
|---|---|---|---|
| Quadrant D | 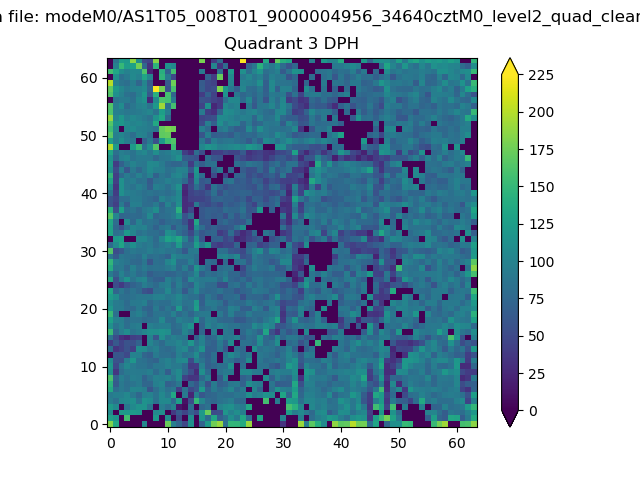 |
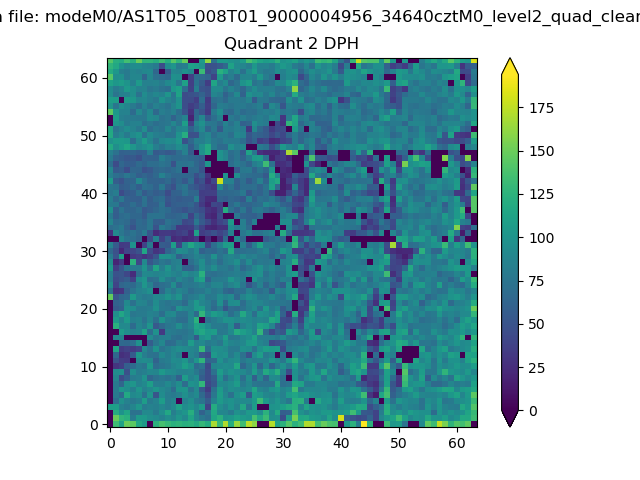 |
Quadrant C |
| Plot type | Count rate plots | Images |
|---|---|---|
| Comparison with Poisson distribution Blue bars denote a histogram of data divided into 1 sec bins. Red curve is a Poisson curve with rate = median count rate of data. |
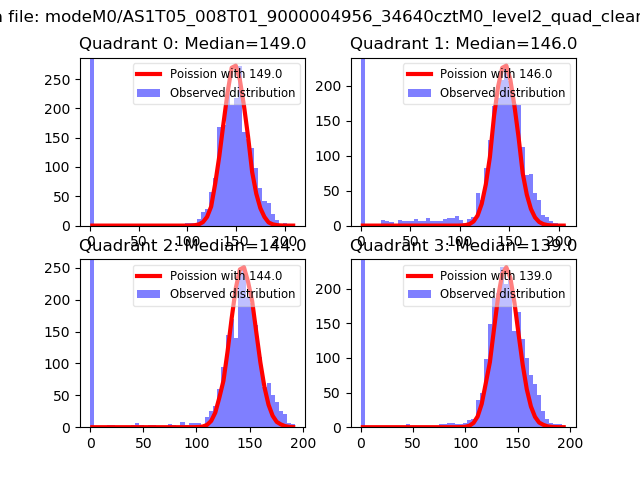 |
 |
| Quadrant-wise count rates Data is divided into 100 sec bins |
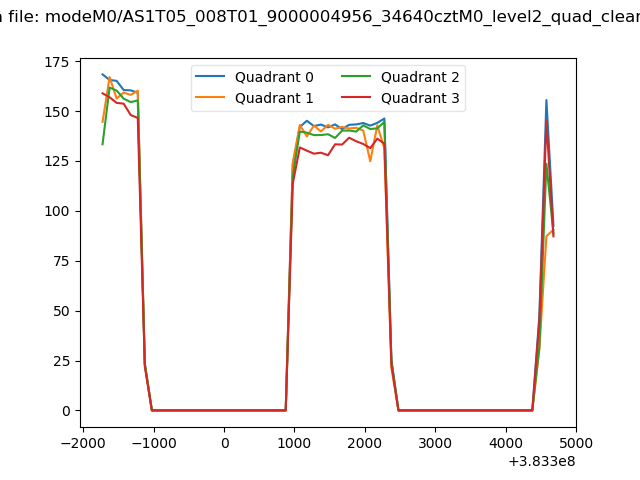 |
|
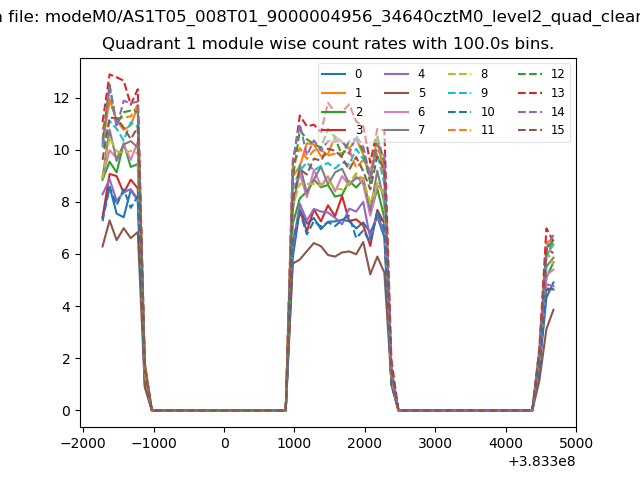
| Module-wise count rates for Quadrant A Data is divided into 100 sec bins |
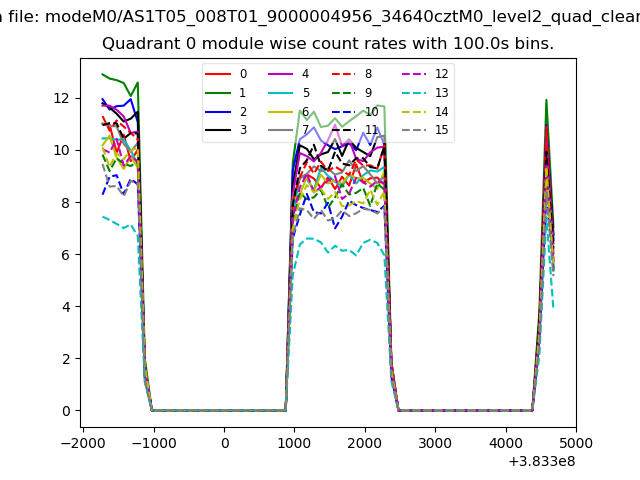 |
 |
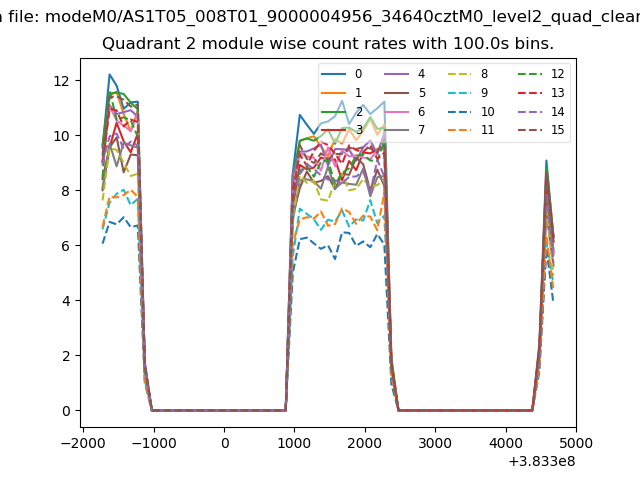
| Module-wise count rates for Quadrant B Data is divided into 100 sec bins |
 |
 |
| Module-wise count rates for Quadrant C Data is divided into 100 sec bins |
 |
 |
| Module-wise count rates for Quadrant D Data is divided into 100 sec bins |
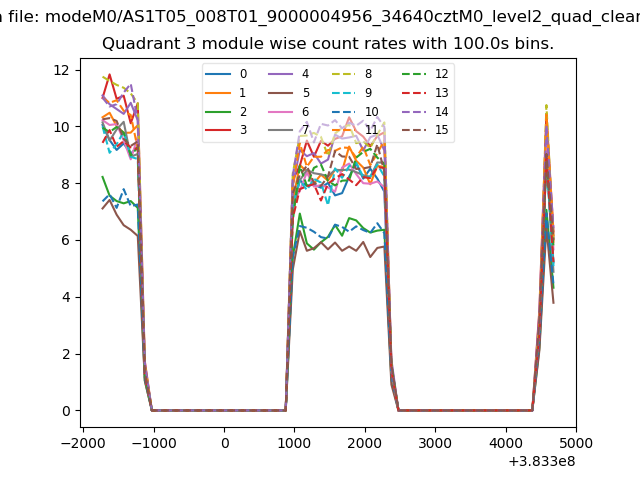 |
 |
| Parameter | Plot |
|---|---|
| CZT HV Monitor | 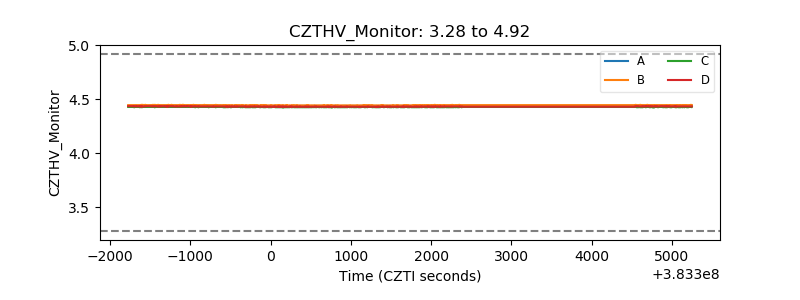 |
| D_VDD | 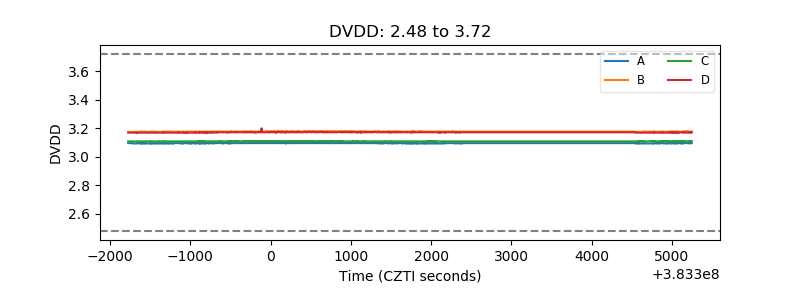 |
| Temperature 1 | 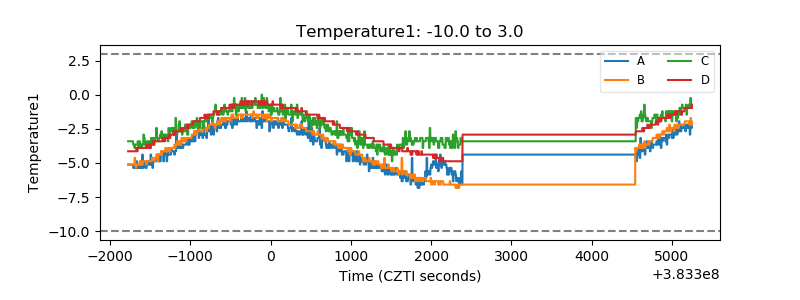 |
| Veto HV Monitor |  |
| Veto LLD | 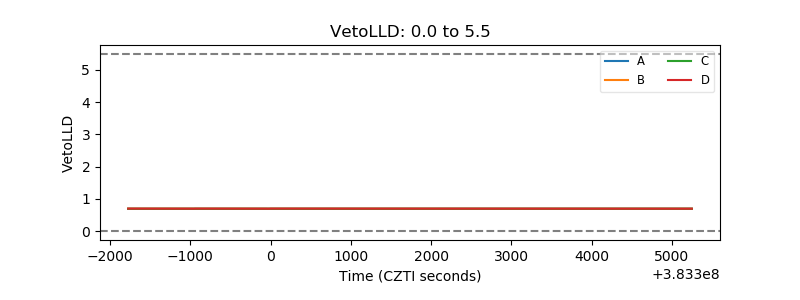 |
| Alpha Counter | 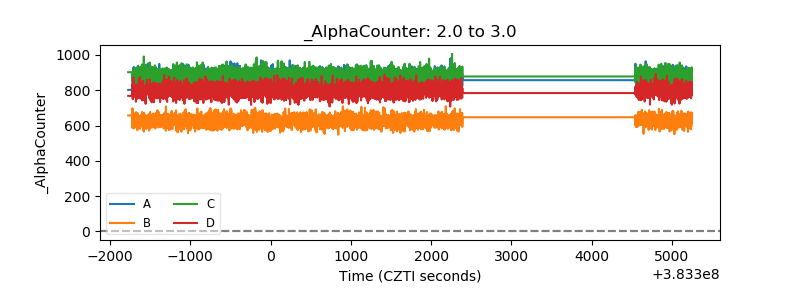 |
| _CPM_Rate | 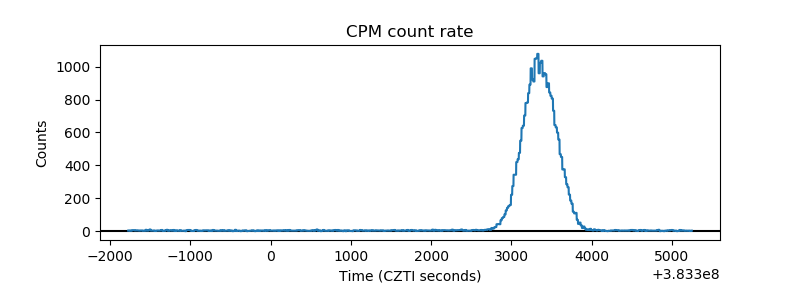 |
| CZT Counter |  |
| +2.5 Volts monitor | 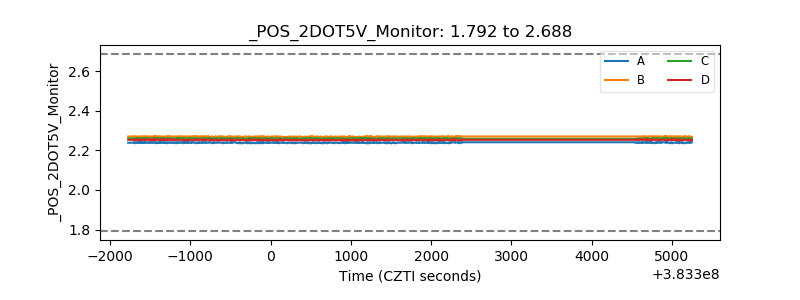 |
| +5 Volts monitor | 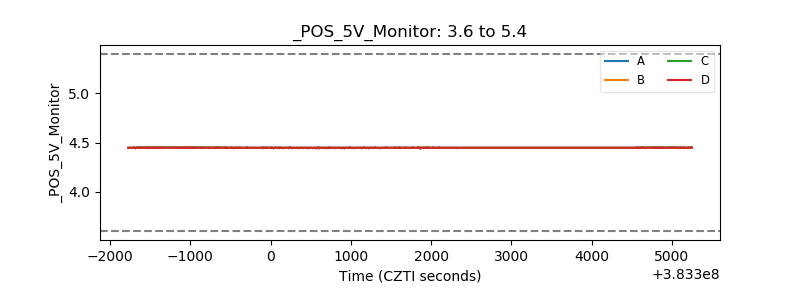 |
| _ROLL_ROT | 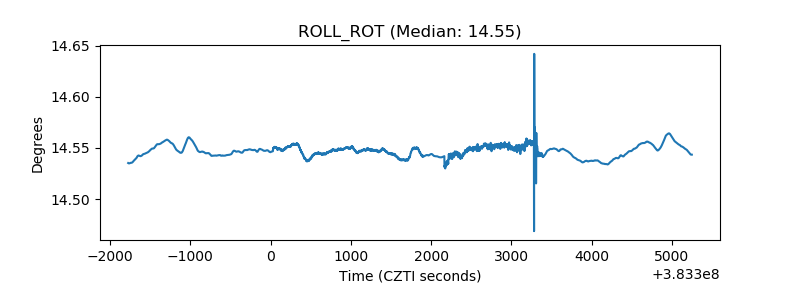 |
| _Roll_DEC | 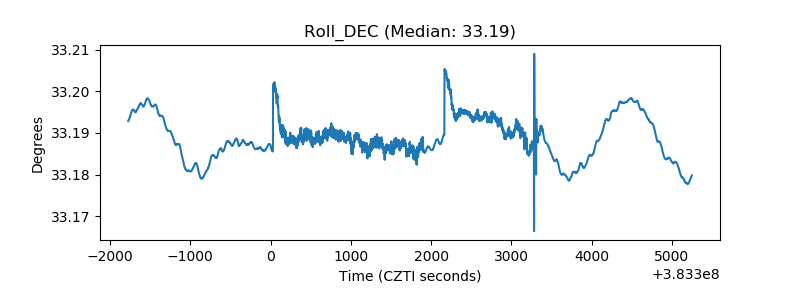 |
| _Roll_RA | 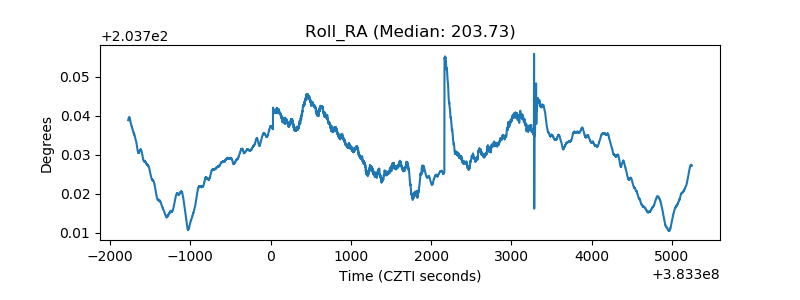 |
| Veto Counter | 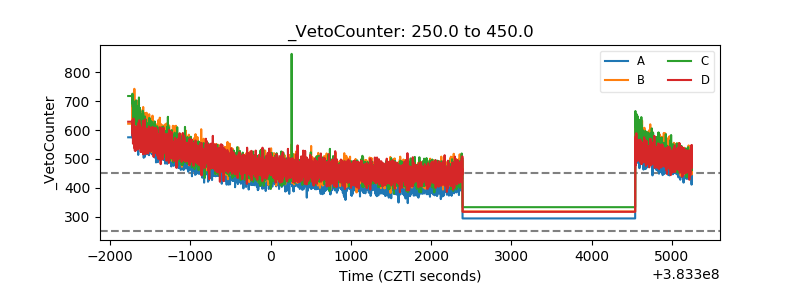 |