| Param | Original file | Final file |
|---|---|---|
| Filename | modeM0/AS1T05_008T01_9000004956_34639cztM0_level2.evt | modeM0/AS1T05_008T01_9000004956_34639cztM0_level2_quad_clean.evt |
| Size (bytes) | 409,478,400 | 60,145,920 |
| Size | 390.5 MB | 57.4 MB |
| Events in quadrant A | 2,572,598 | 383,546 |
| Events in quadrant B | 3,068,361 | 379,461 |
| Events in quadrant C | 2,718,005 | 370,017 |
| Events in quadrant D | 3,721,403 | 356,410 |
| Mode SS | |||
|---|---|---|---|
| Quadrant | BADHDUFLAG | Total packets | Discarded packets |
| A | 0 | 96 | 0 |
| B | 0 | 96 | 0 |
| C | 0 | 96 | 0 |
| D | 0 | 96 | 0 |
| Mode M9 | |||
|---|---|---|---|
| Quadrant | BADHDUFLAG | Total packets | Discarded packets |
| A | 0 | 21 | 0 |
| B | 0 | 21 | 0 |
| C | 0 | 21 | 0 |
| D | 0 | 21 | 0 |
| Mode M0 | |||
|---|---|---|---|
| Quadrant | BADHDUFLAG | Total packets | Discarded packets |
| A | 0 | 10179 | 2 |
| B | 0 | 11841 | 1 |
| C | 0 | 10613 | 1 |
| D | 0 | 14279 | 1 |
| Quadrant | Total seconds | Saturated seconds | Saturation percentage |
|---|---|---|---|
| A | 4725 | 66 | 1.396825% |
| B | 4725 | 181 | 3.830688% |
| C | 4725 | 47 | 0.994709% |
| D | 4725 | 57 | 1.206349% |
Noise dominated data is calculated using 1-second bins in cleaned event files. If a bin has >2000 counts, and if more than 50% of those come from <1% of pixels, then it is considered to be noise-dominated and hence unusable.
| Quadrant | # 1 sec bins | Bins with >0 counts | Bins with >2000 counts | High rate bins dominated by noise | Noise dominated (total time) | Noise dominated (detector-on time) | Marked lightcurve |
|---|---|---|---|---|---|---|---|
| A | 6818 | 4726 | 46 | 46 | 0.67% | 0.97% | 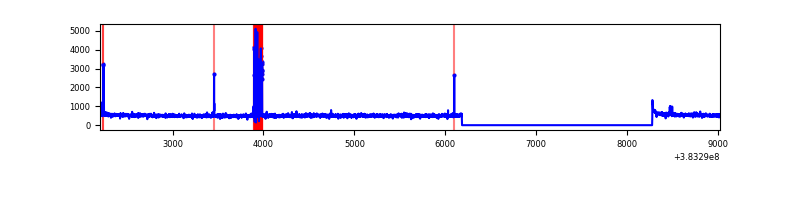 |
| B | 6818 | 4726 | 117 | 117 | 1.72% | 2.48% | 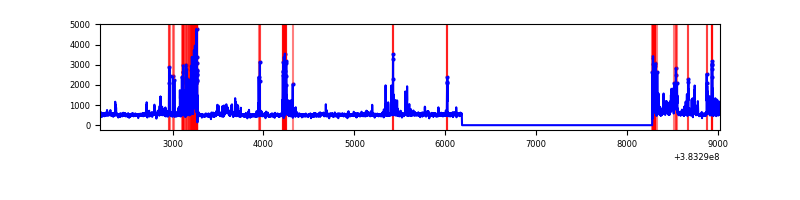 |
| C | 6818 | 4726 | 38 | 38 | 0.56% | 0.80% | 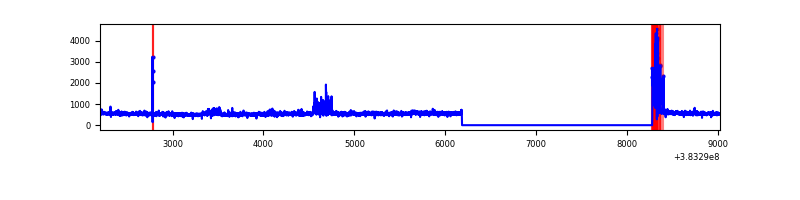 |
| D | 6818 | 4726 | 30 | 30 | 0.44% | 0.63% | 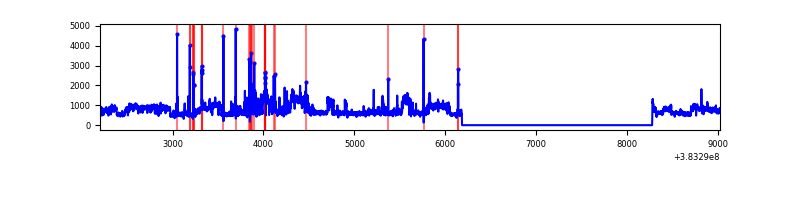 |
Top three noisy pixels from each quadrant. If the there are fewer than three noisy pixels in the level2.evt file, extra rows are filled as -1
| Pixel properties | Quadrant properties | ||||||
|---|---|---|---|---|---|---|---|
| Quadrant | DetID | PixID | Counts | Sigma | Mean | Median | Sigma |
| A | 15 | 174 | 155320 | 1263.18 | 612 | 601 | 122.5 |
| A | 10 | 83 | 30323 | 242.66 | 612 | 601 | 122.5 |
| A | 9 | 143 | 20970 | 166.3 | 612 | 601 | 122.5 |
| B | 5 | 172 | 663572 | 5953.79 | 591 | 578 | 111.4 |
| B | 4 | 232 | 23247 | 203.57 | 591 | 578 | 111.4 |
| B | 4 | 173 | 21802 | 190.59 | 591 | 578 | 111.4 |
| C | 15 | 214 | 199666 | 1498.68 | 579 | 584 | 132.8 |
| C | 0 | 10 | 121410 | 909.57 | 579 | 584 | 132.8 |
| C | 15 | 208 | 47273 | 351.47 | 579 | 584 | 132.8 |
| D | 8 | 195 | 1144846 | 8087.47 | 587 | 573 | 141.5 |
| D | 10 | 199 | 94981 | 667.26 | 587 | 573 | 141.5 |
| D | 7 | 223 | 31331 | 217.39 | 587 | 573 | 141.5 |
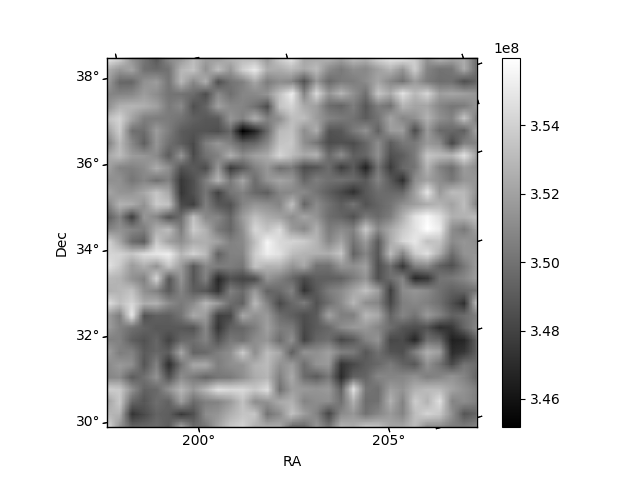
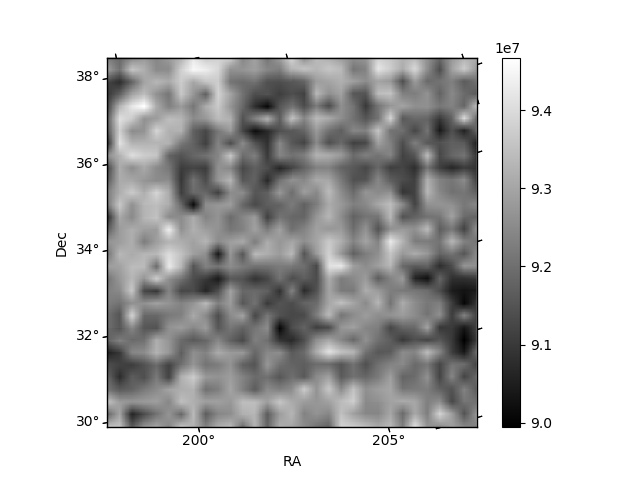
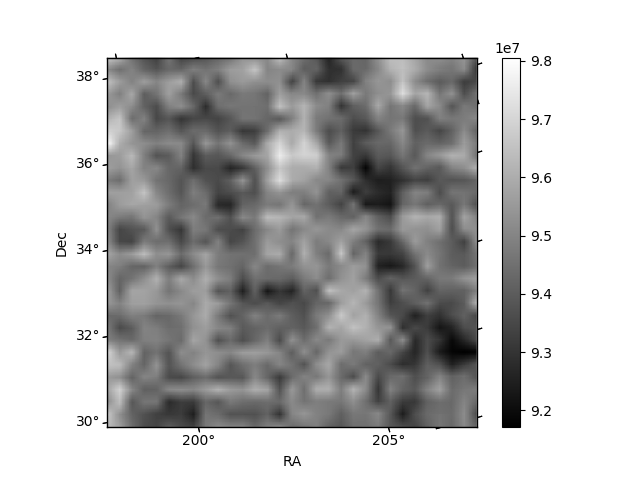
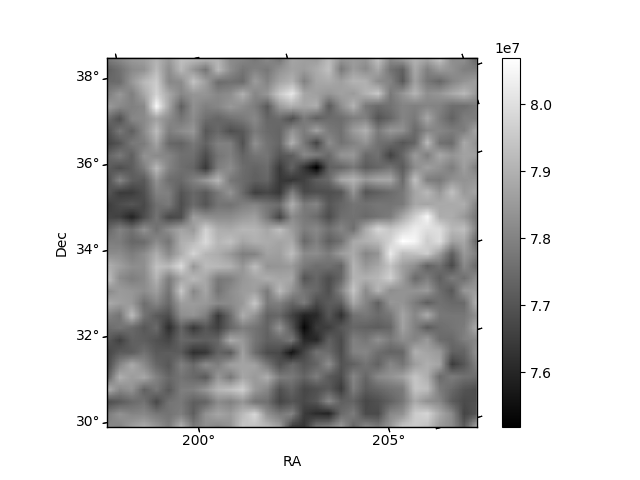
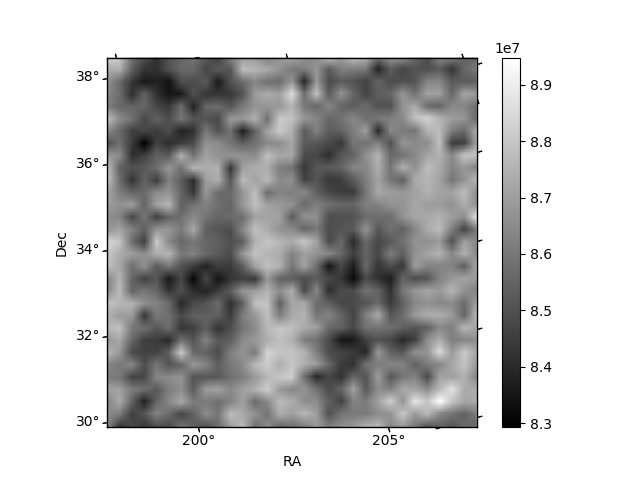
Histogram calculated using DETX and DETY for each event in the final _common_clean file
| Quadrant A | 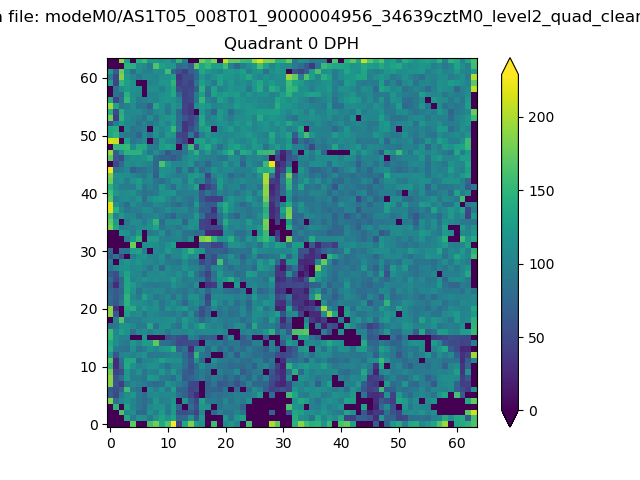 |
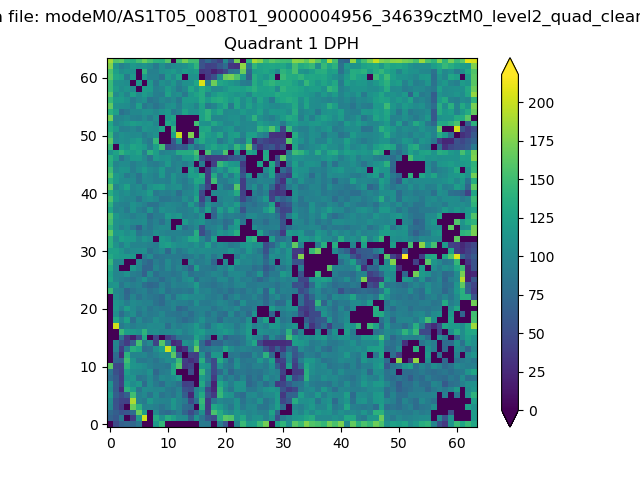 |
Quadrant B |
|---|---|---|---|
| Quadrant D | 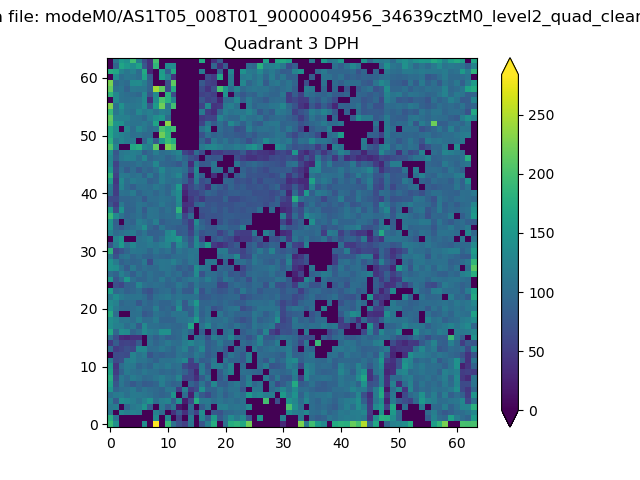 |
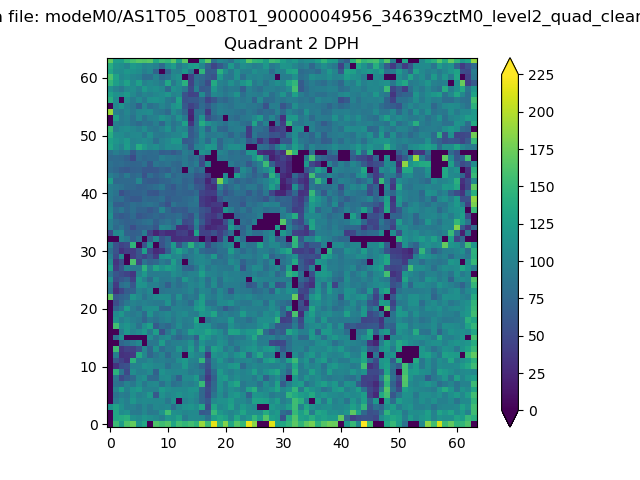 |
Quadrant C |
| Plot type | Count rate plots | Images |
|---|---|---|
| Comparison with Poisson distribution Blue bars denote a histogram of data divided into 1 sec bins. Red curve is a Poisson curve with rate = median count rate of data. |
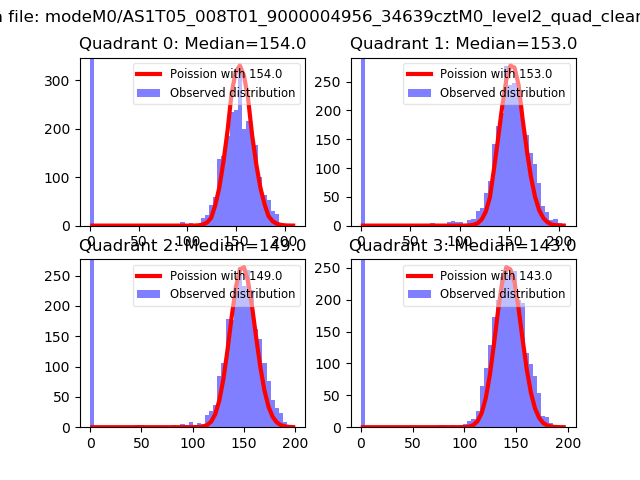 |
 |
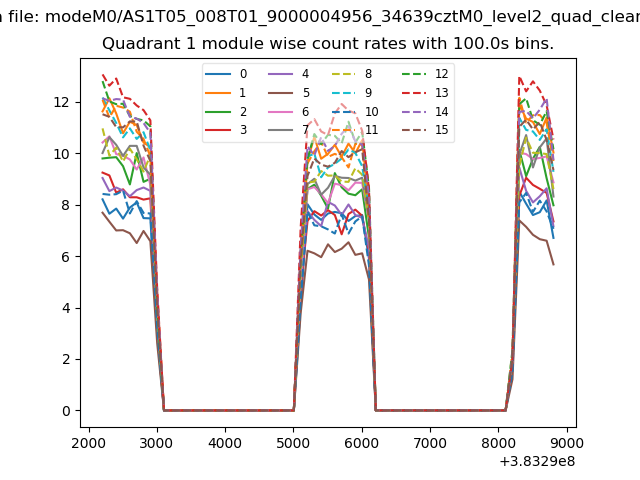
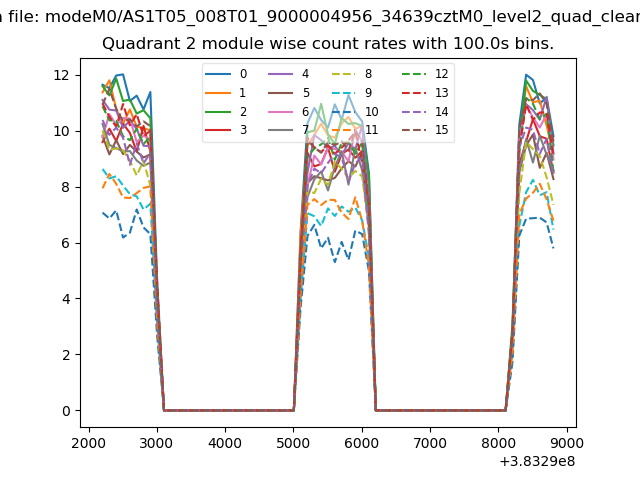
| Quadrant-wise count rates Data is divided into 100 sec bins |
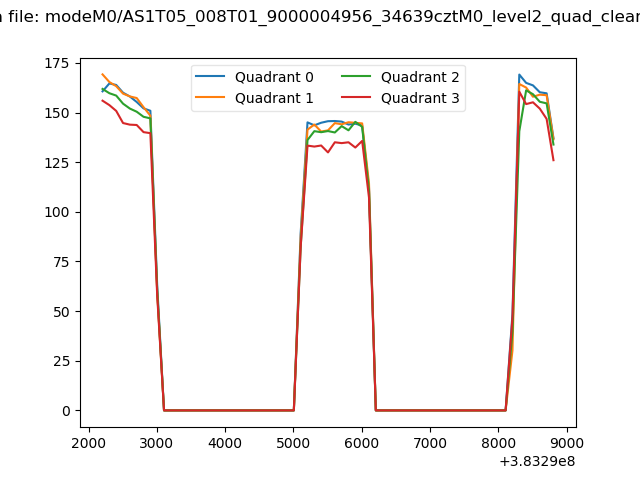 |
|
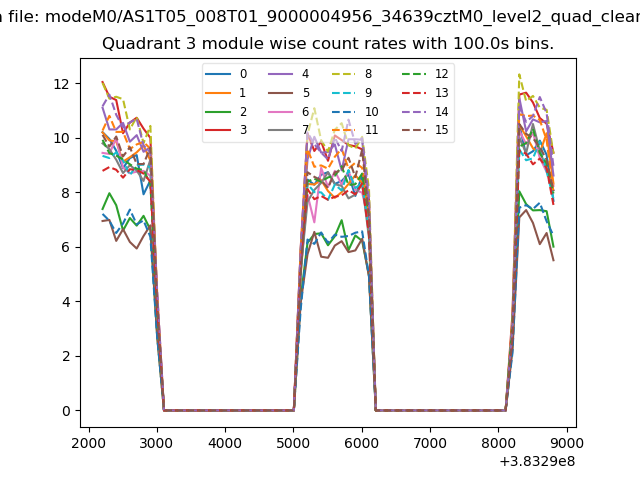
| Module-wise count rates for Quadrant A Data is divided into 100 sec bins |
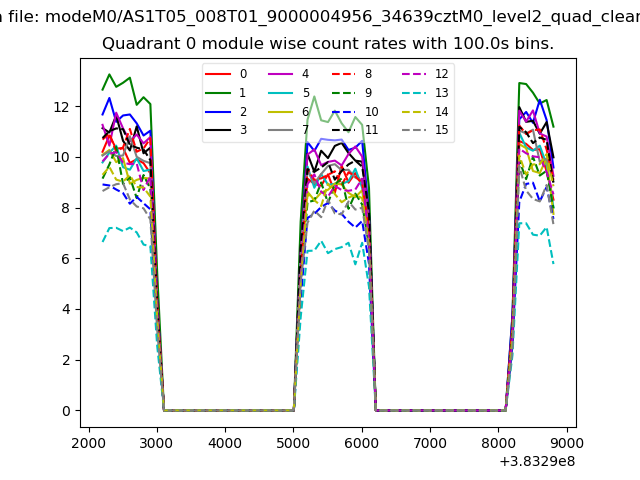 |
 |
| Module-wise count rates for Quadrant B Data is divided into 100 sec bins |
 |
 |
| Module-wise count rates for Quadrant C Data is divided into 100 sec bins |
 |
 |
| Module-wise count rates for Quadrant D Data is divided into 100 sec bins |
 |
 |
| Parameter | Plot |
|---|---|
| CZT HV Monitor | 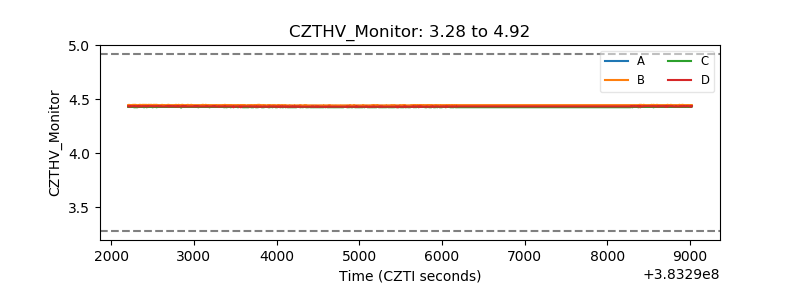 |
| D_VDD | 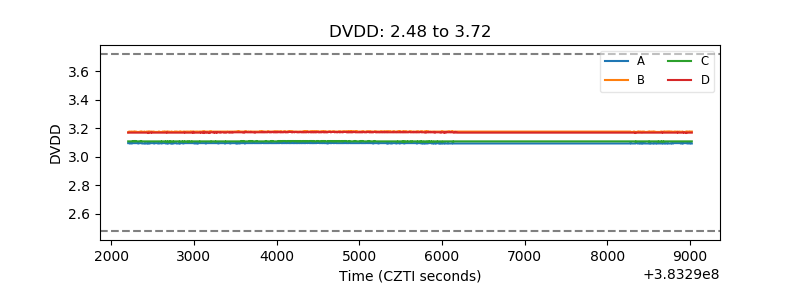 |
| Temperature 1 | 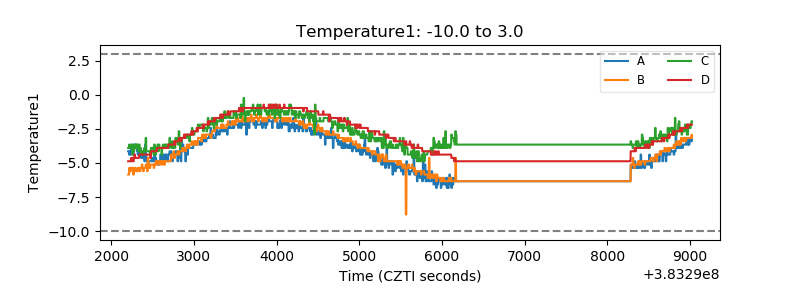 |
| Veto HV Monitor | 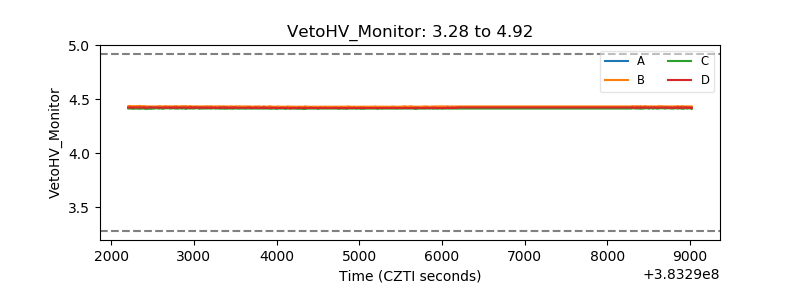 |
| Veto LLD | 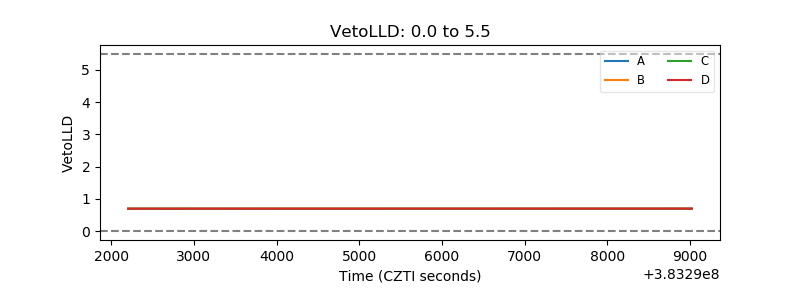 |
| Alpha Counter | 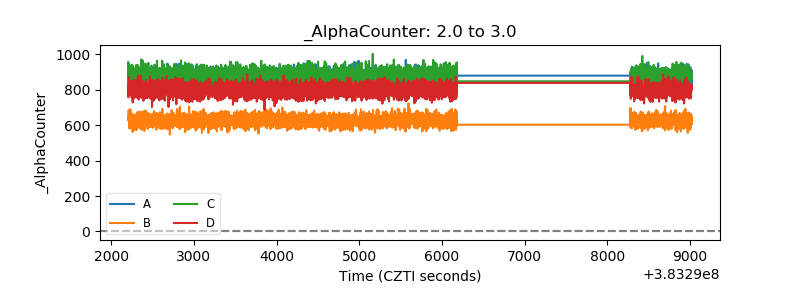 |
| _CPM_Rate | 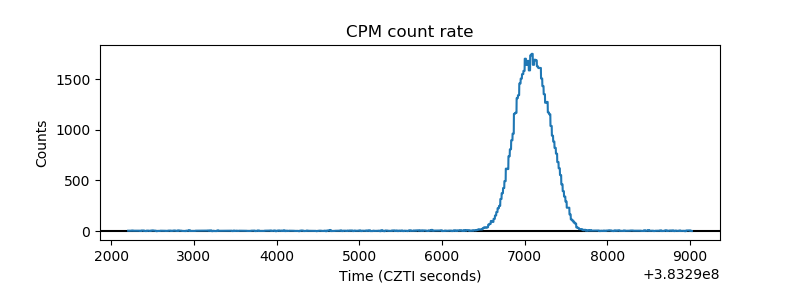 |
| CZT Counter | 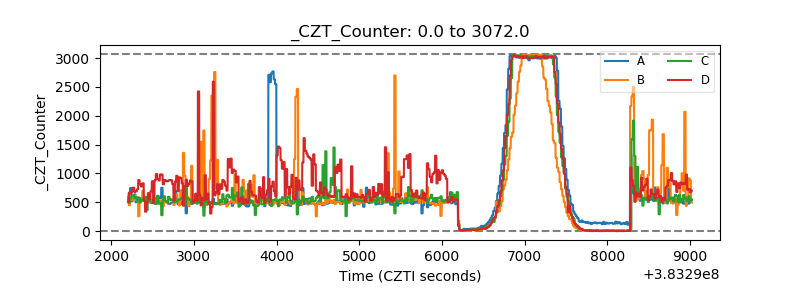 |
| +2.5 Volts monitor | 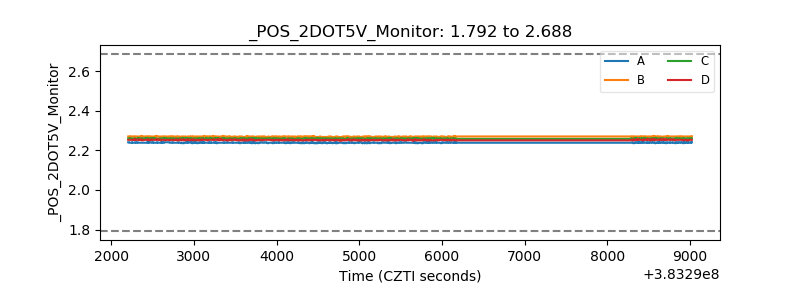 |
| +5 Volts monitor | 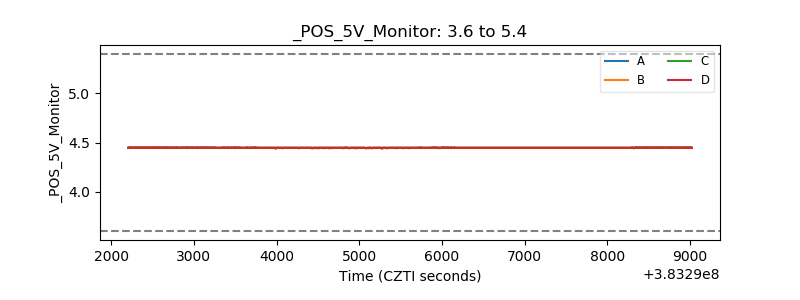 |
| _ROLL_ROT | 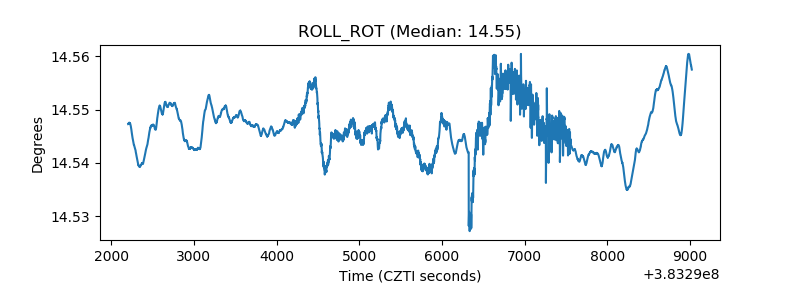 |
| _Roll_DEC | 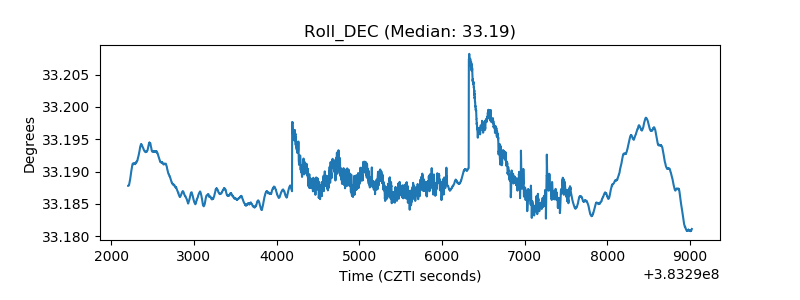 |
| _Roll_RA | 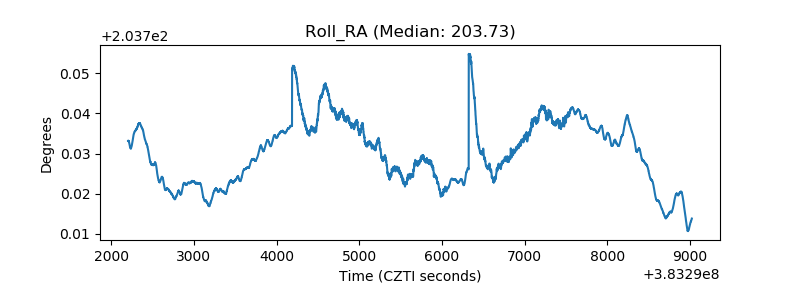 |
| Veto Counter | 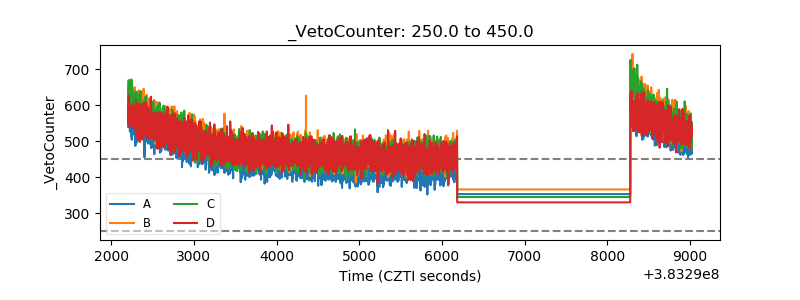 |